Working with Dashboards
20 minutes- Introduction to the Dashboards and Charts
- Editing and creating charts
- Filtering and analytical functions
- Using formulas
- Saving charts in a dashboard
- Introduction to SignalFlow
1. Dashboards
Dashboards are groupings of charts and visualizations of metrics. Well-designed dashboards can provide useful and actionable insight into your system at a glance. Dashboards can be complex or contain just a few charts that drill down only into the data you want to see.
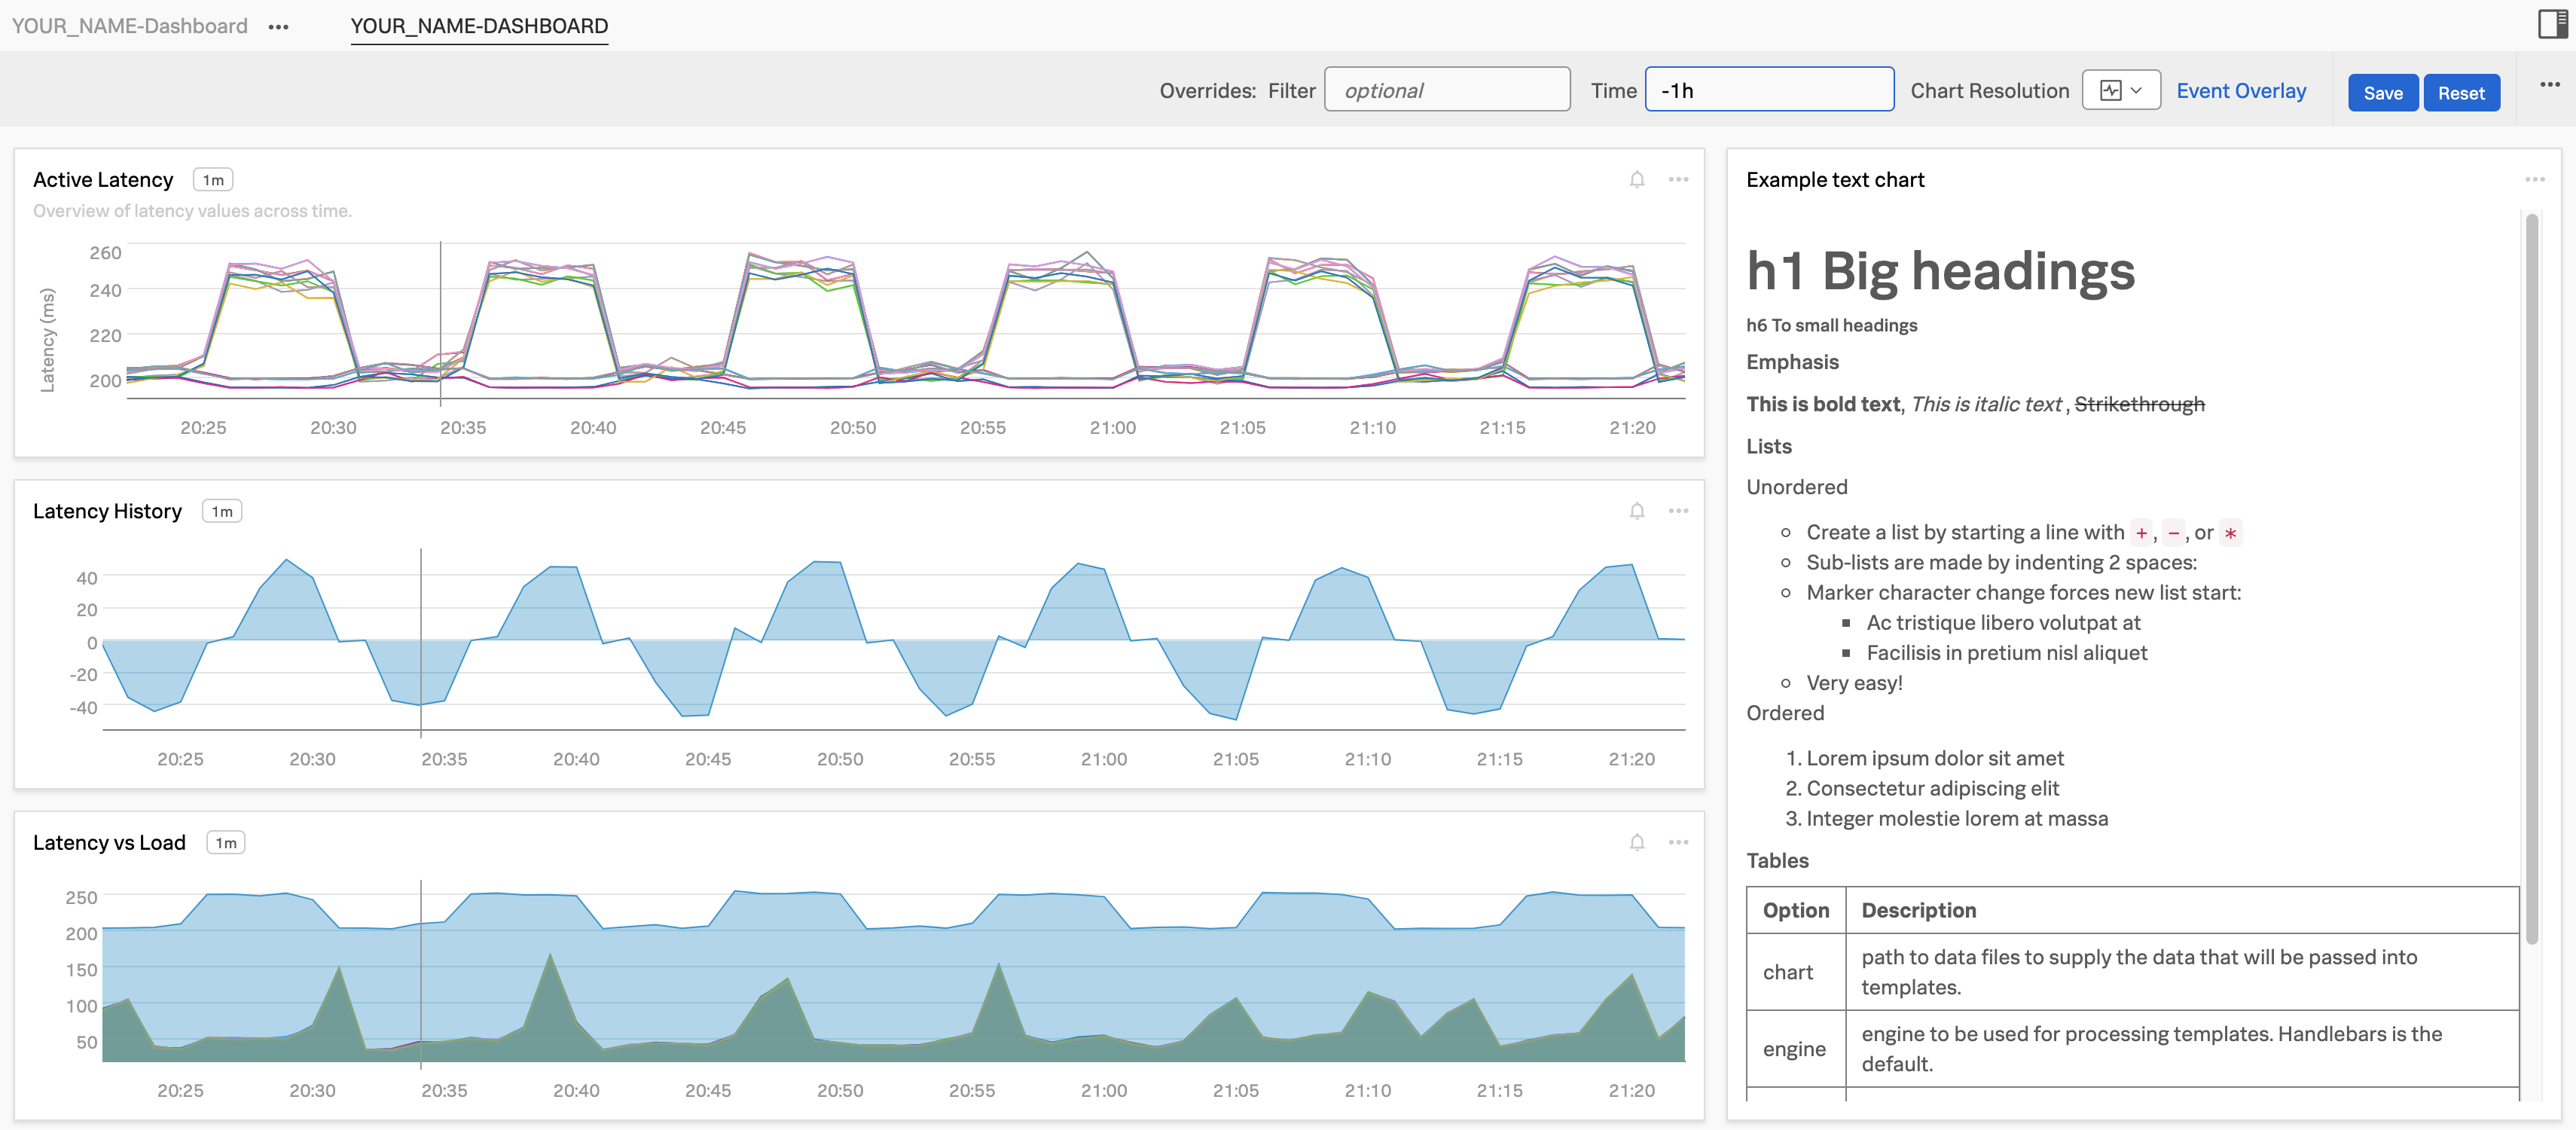
During this module, we are going to create the following charts and dashboard and connect them to your Team page.
2. Your Teams’ Page
Click on the  from the navbar. As you have already been assigned to a team, you will land on the team dashboard. We use the Example Team as an example here. The one in your workshop will be different!
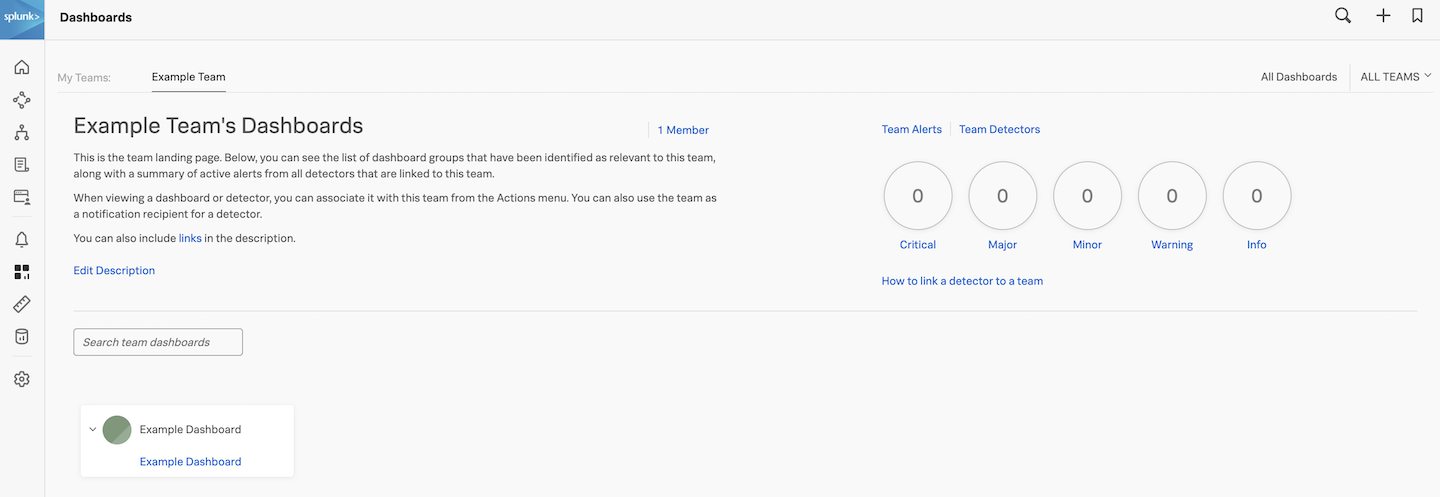
This page shows the total number of team members, how many active alerts for your team and all dashboards that are assigned to your team. Right now there are no dashboards assigned but as stated before, we will add the new dashboard that you will create to your Teams page later.
3. Sample Charts
To continue, click on All Dashboards in the top right corner of the screen. This brings you to the view that shows all the available dashboards, including the pre-built ones.
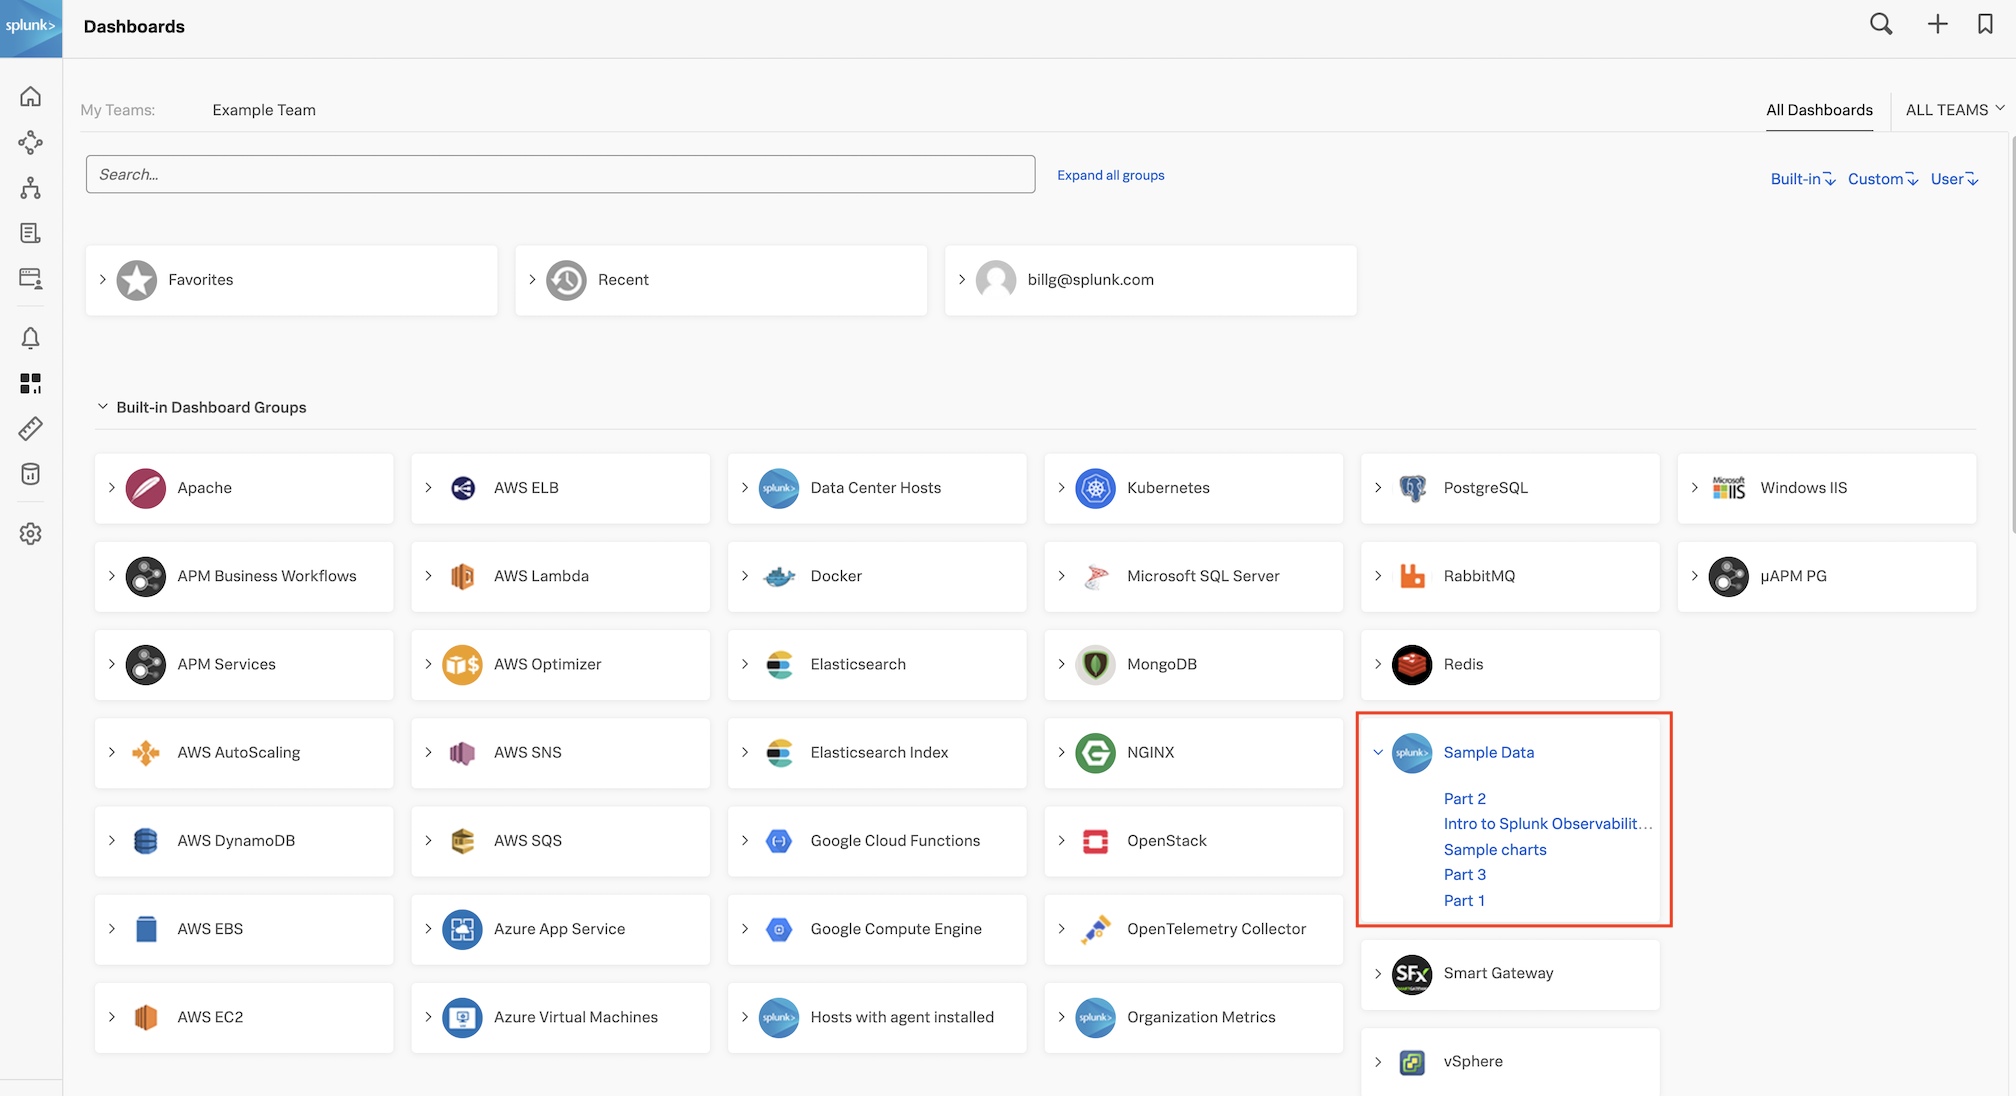
If you are already receiving metrics from a Cloud API integration or another service through the Splunk Agent you will see relevant dashboards for these services.
4. Inspecting the Sample Data
Among the dashboards, you will see a Dashboard group called Sample Data. Expand the Sample Data dashboard group by clicking on it, and then click on the Sample Charts dashboard.
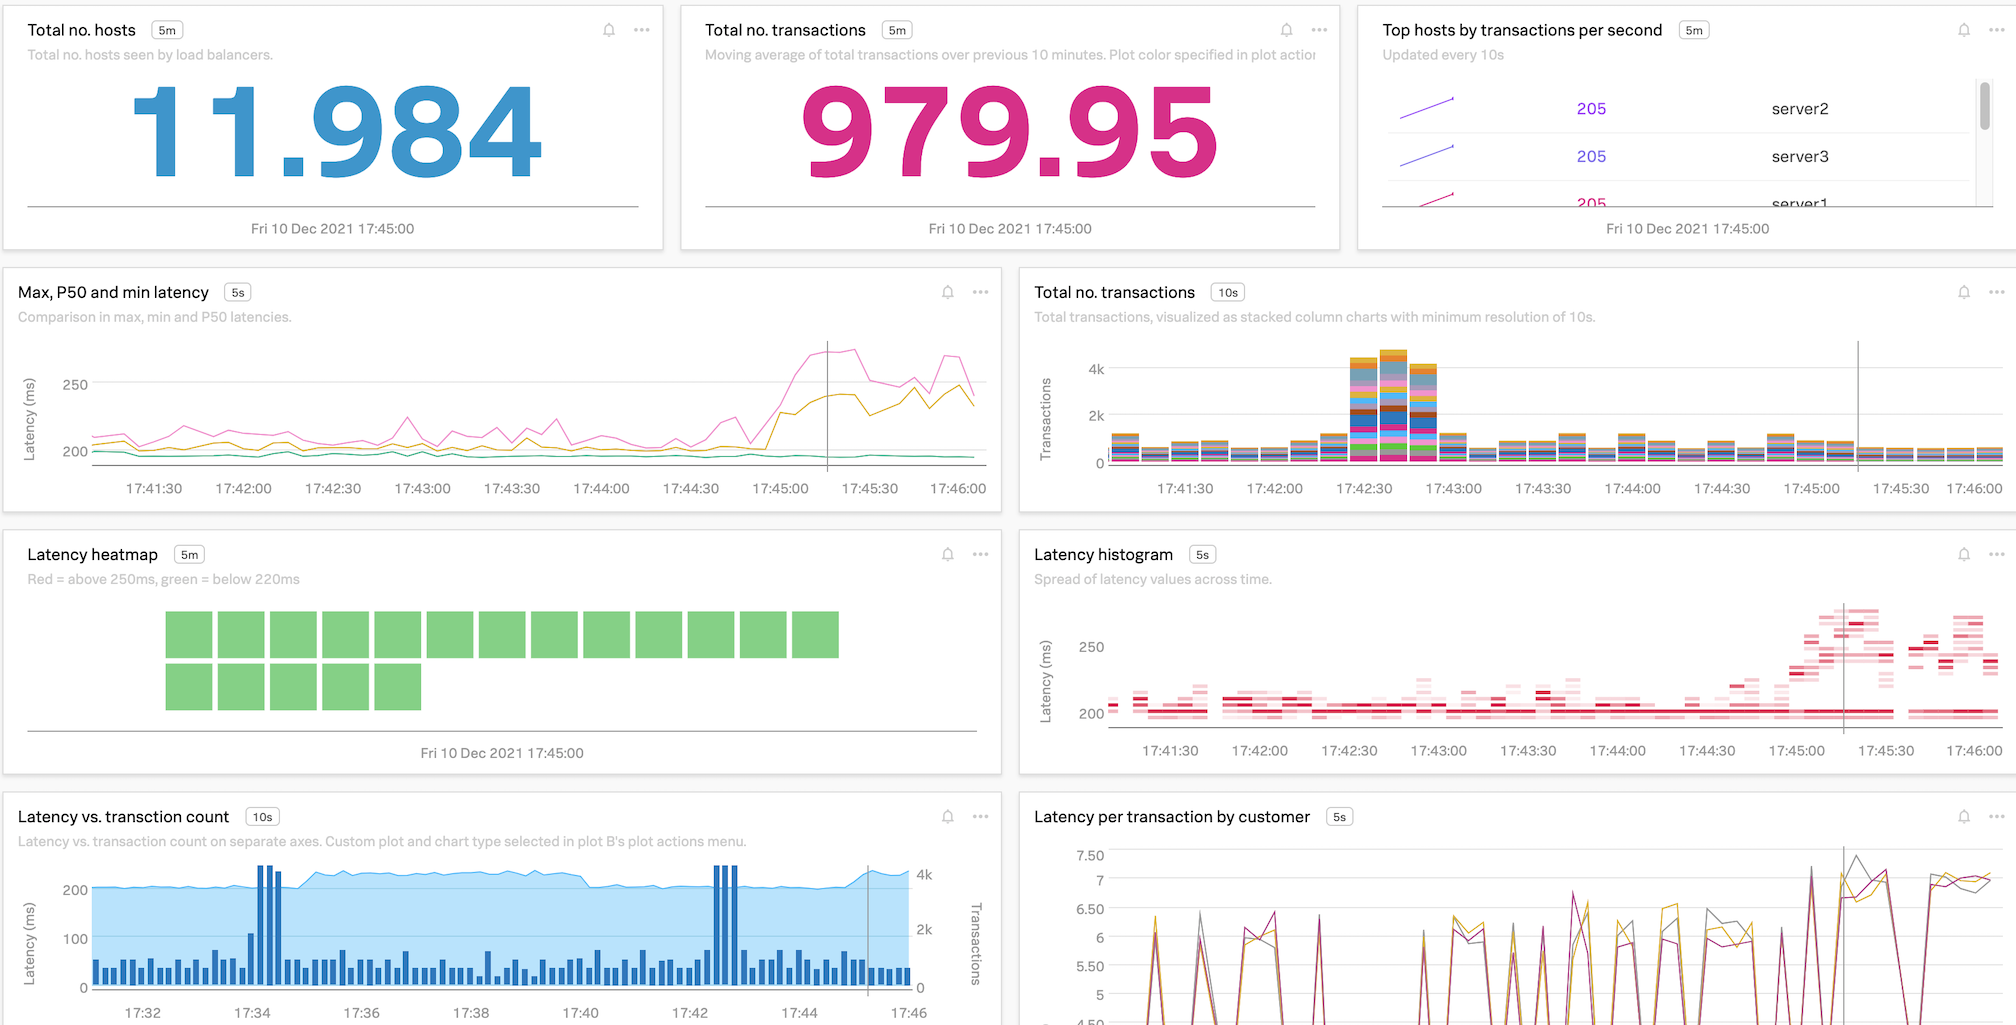
In the Sample Charts dashboard, you can see a selection of charts that show a sample of the various styles, colors and formats you can apply to your charts in the dashboards.
Have a look through all the dashboards in this dashboard group (PART 1, PART 2, PART 3 and INTRO TO SPLUNK OBSERVABILITY CLOUD)