Adding Notes and Dashboard Layout
1. Adding Notes
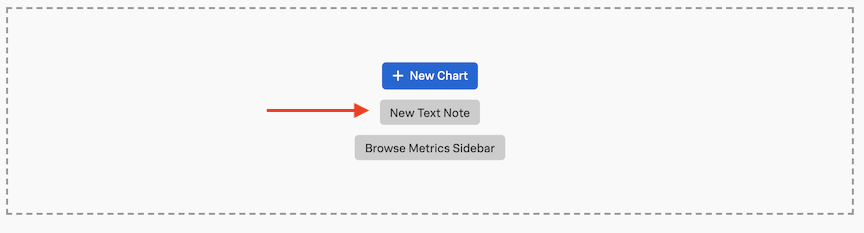
Often on dashboards it makes sense to place a short “instruction” pane that helps users of a dashboard. Lets add one now by clicking on the New Text Note Button.
This will open the notes editor.
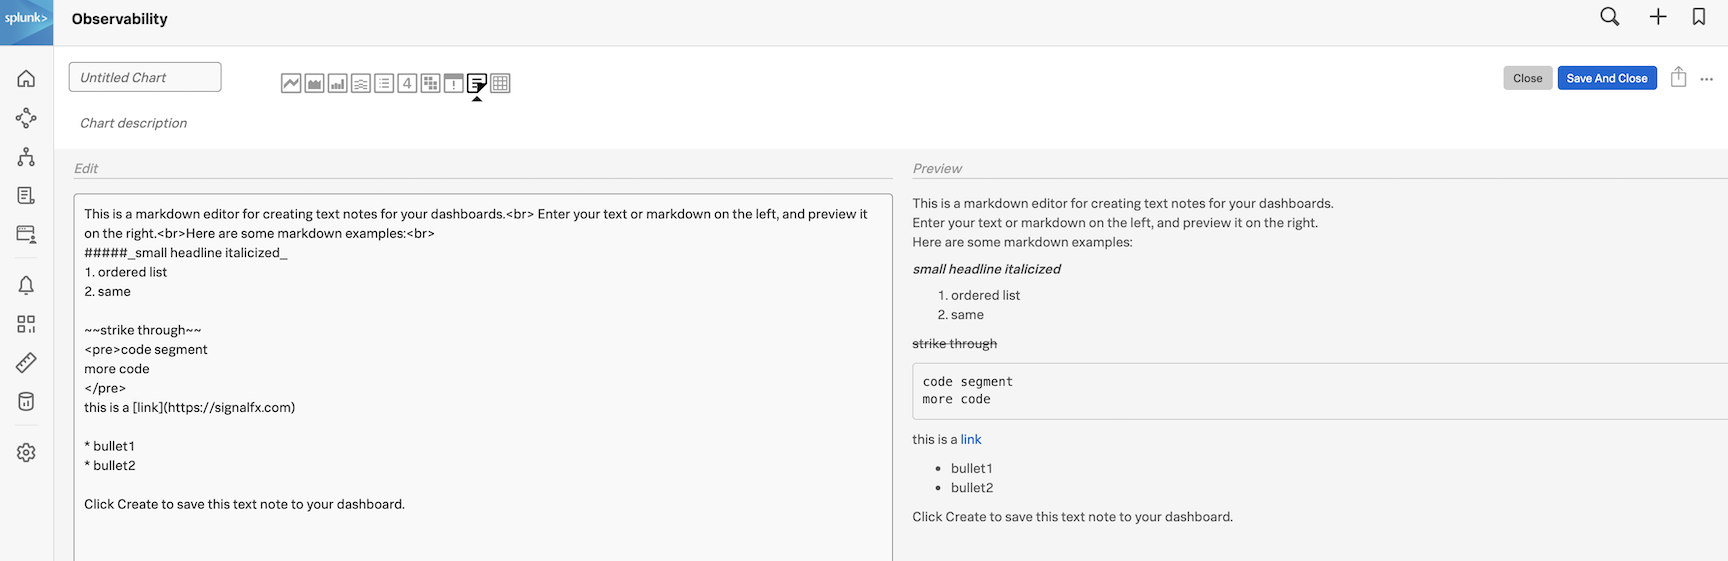
To allow you to add more then just text to you notes, Splunk is allowing you to use Markdown in these notes/panes. Markdown is a lightweight markup language for creating formatted text using plain-text often used in Webpages.
This includes (but not limited to):
- Headers. (in various sizes)
- Emphasis styles.
- Lists and Tables.
- Links. These can be external webpages (for documentation for example) or directly to other Splunk IM Dashboards
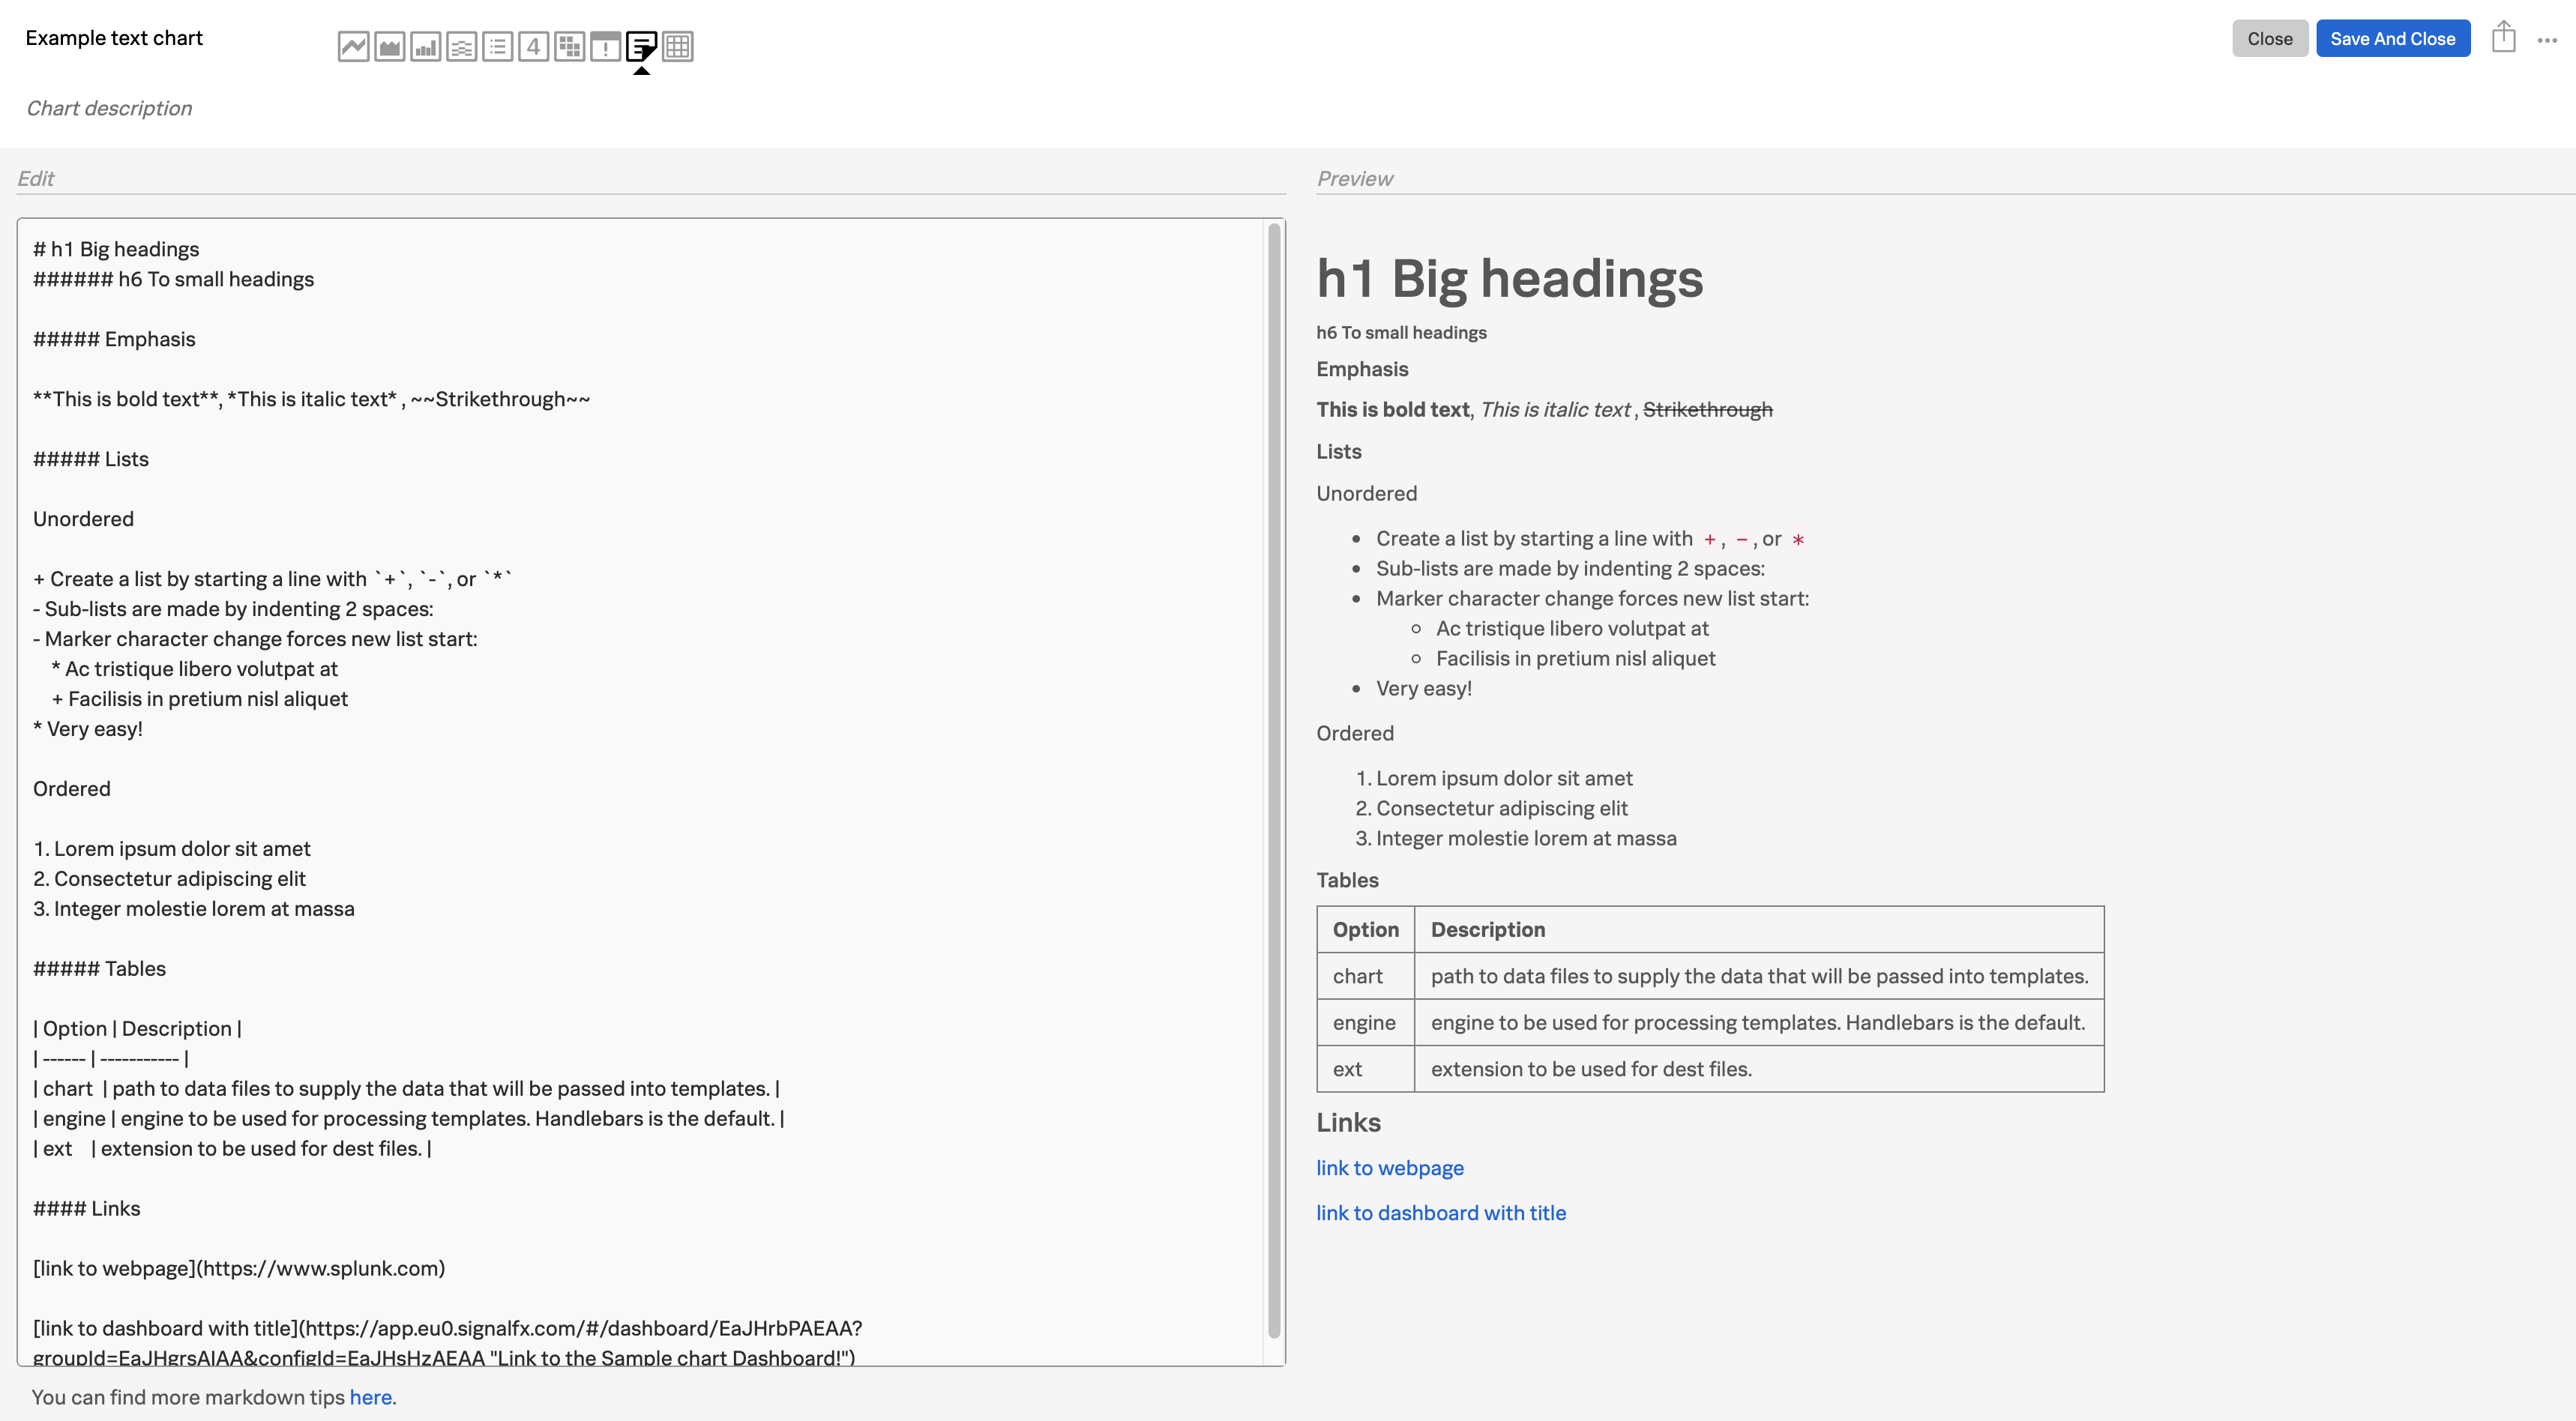
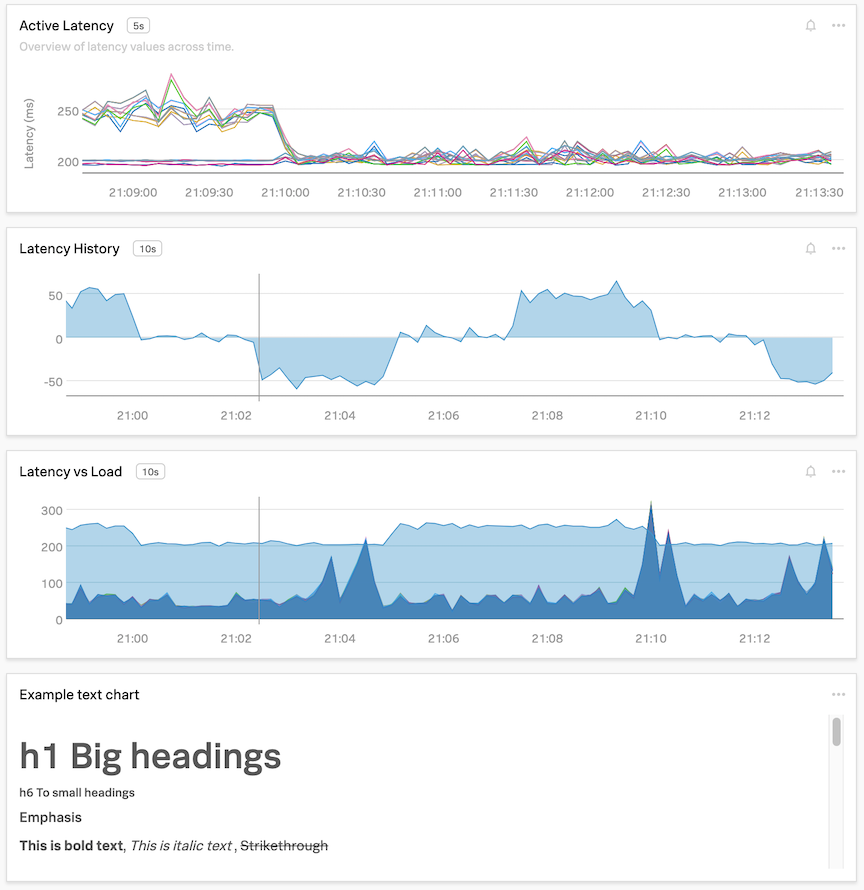
Below is an example of above Markdown options you can use in your note.
# h1 Big headings

###### h6 To small headings

##### Emphasis

**This is bold text**, *This is italic text* , ~~Strikethrough~~

##### Lists

Unordered

+ Create a list by starting a line with `+`, `-`, or `*`
- Sub-lists are made by indenting 2 spaces:
- Marker character change forces new list start:
    * Ac tristique libero volutpat at
    + Facilisis in pretium nisl aliquet
* Very easy!

Ordered

1. Lorem ipsum dolor sit amet
2. Consectetur adipiscing elit
3. Integer molestie lorem at massa

##### Tables

| Option | Description |
| ------ | ----------- |
| chart  | path to data files to supply the data that will be passed into templates. |
| engine | engine to be used for processing templates. Handlebars is the default. |
| ext    | extension to be used for dest files. |

#### Links

[link to webpage](https://www.splunk.com)

[link to dashboard with title](https://app.eu0.signalfx.com/#/dashboard/EaJHrbPAEAA?groupId=EaJHgrsAIAA&configId=EaJHsHzAEAA "Link to the Sample chart Dashboard!")
Copy the above by using the copy button and paste it in the Edit box. the preview will show you how it will look.
2. Saving our chart
Give the Note chart a name, in our example we used Example text chart, then press the Save And Close Button.
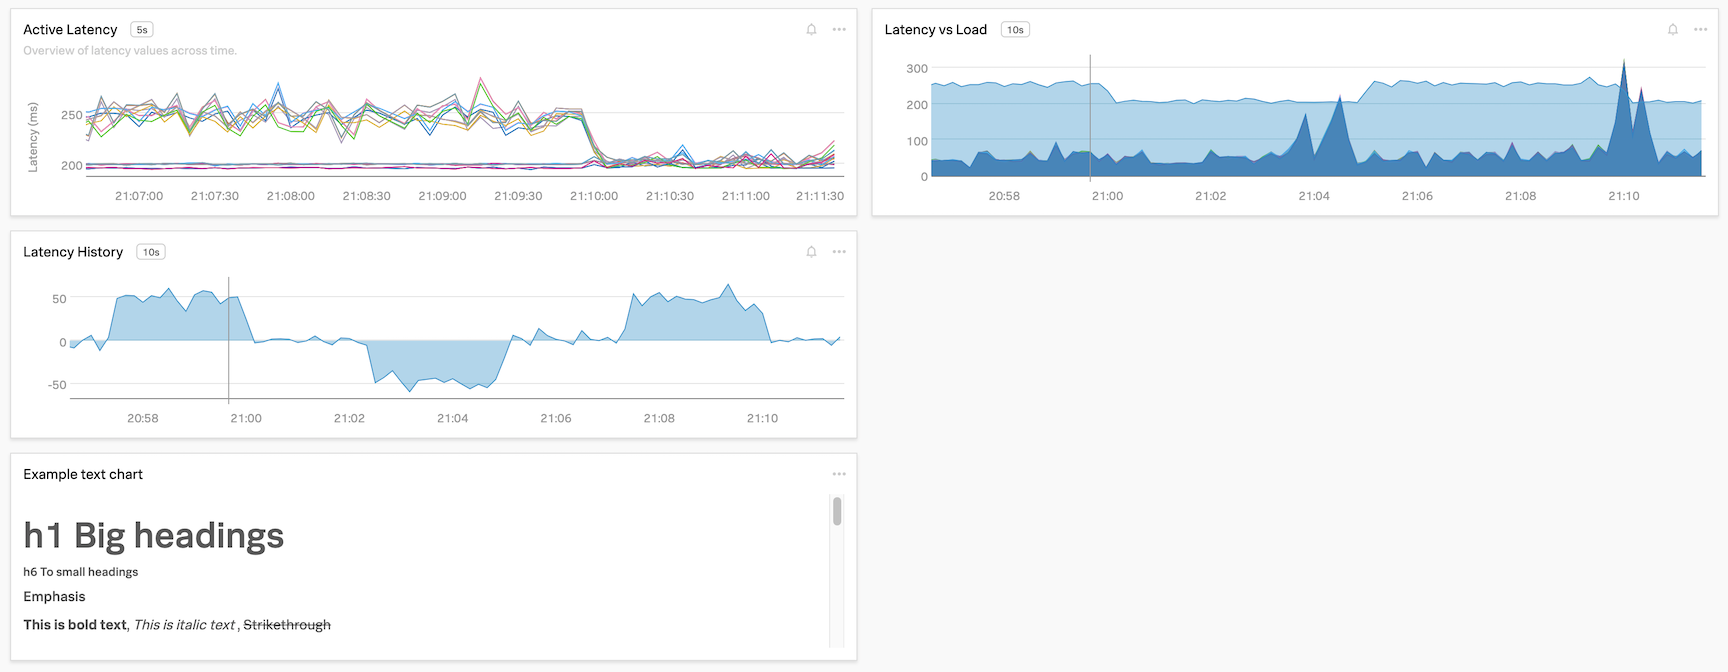
This will bring you back to you Dashboard, that now includes the note.
3. Ordering & sizing of charts
If you do not like the default order and sizes of your charts you can simply use window dragging technique to move and size them to the desired location.
Grab the top border of a chart and you should see the mouse pointer change to a drag icon (see picture below).
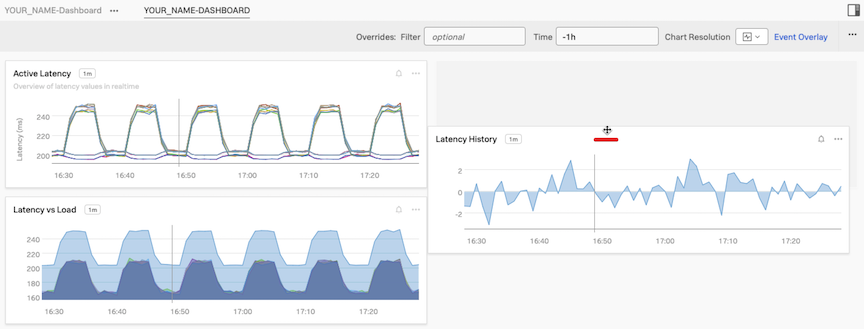
Now drag the Latency vs Load chart to sit between the Latency History Chart and the Example text chart.
You can also resize windows by dragging from the left, right and bottom edges.
As a last exercise reduce the width of the note chart to about a third of the other charts. The chart will automatically snap to one of the sizes it supports. Widen the 3 other charts to about a third of the Dashboard. Drag the notes to the right of the others and resize it to match it to the 3 others. Set the Time to -1h and you should have the following dashboard!
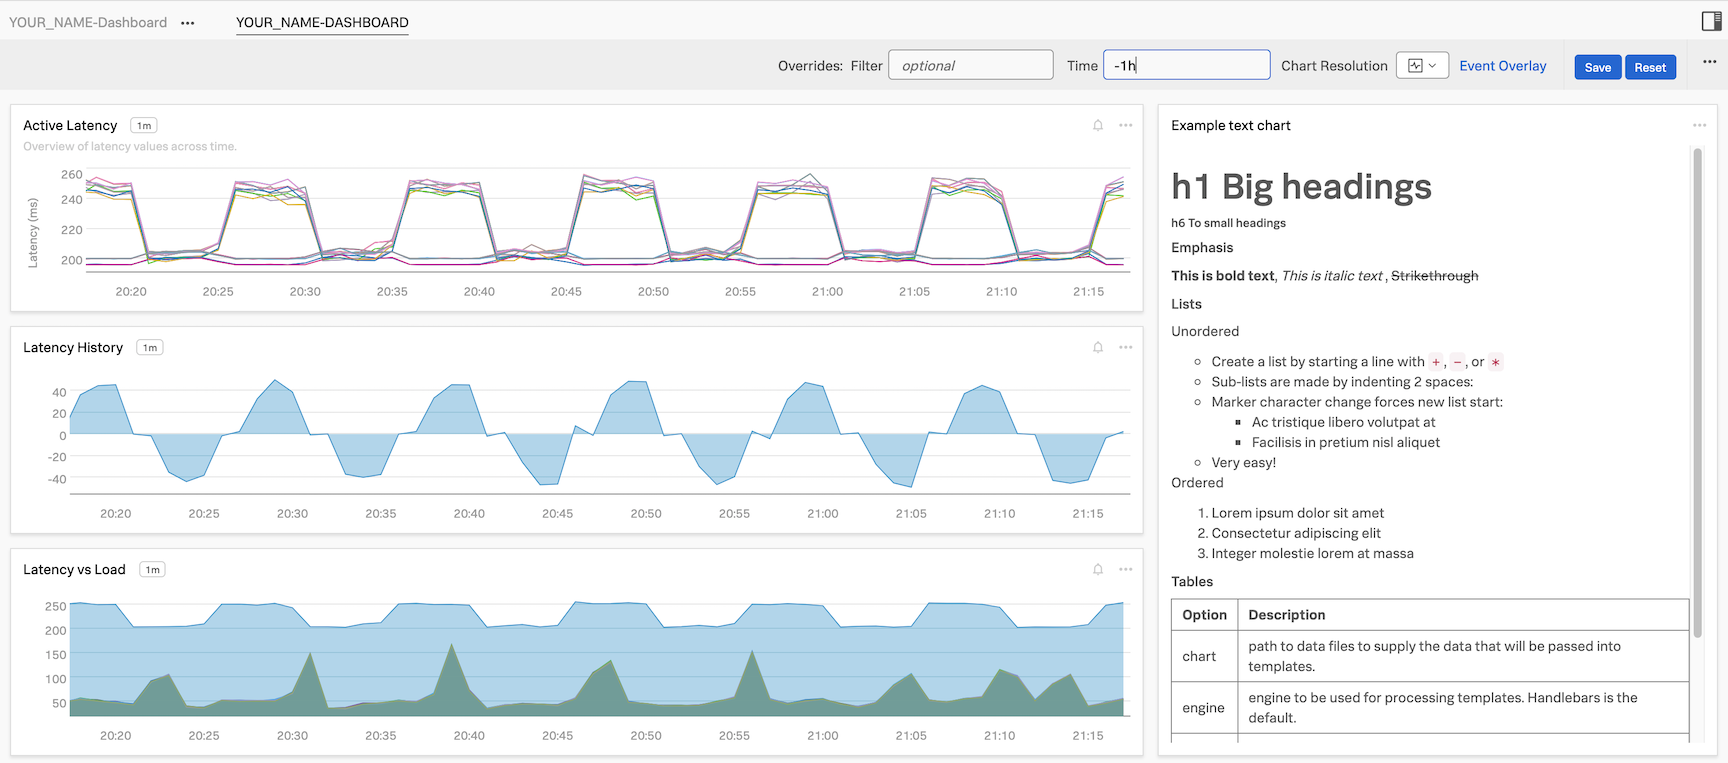
On to Detectors!