Saving charts
1. Saving a chart
To start saving your chart, lets give it a name and description. Click the name of the chart Copy of Latency Histogram and rename it to “Active Latency”.
To change the description click on Spread of latency values across time. and change this to Overview of latency values in real-time.
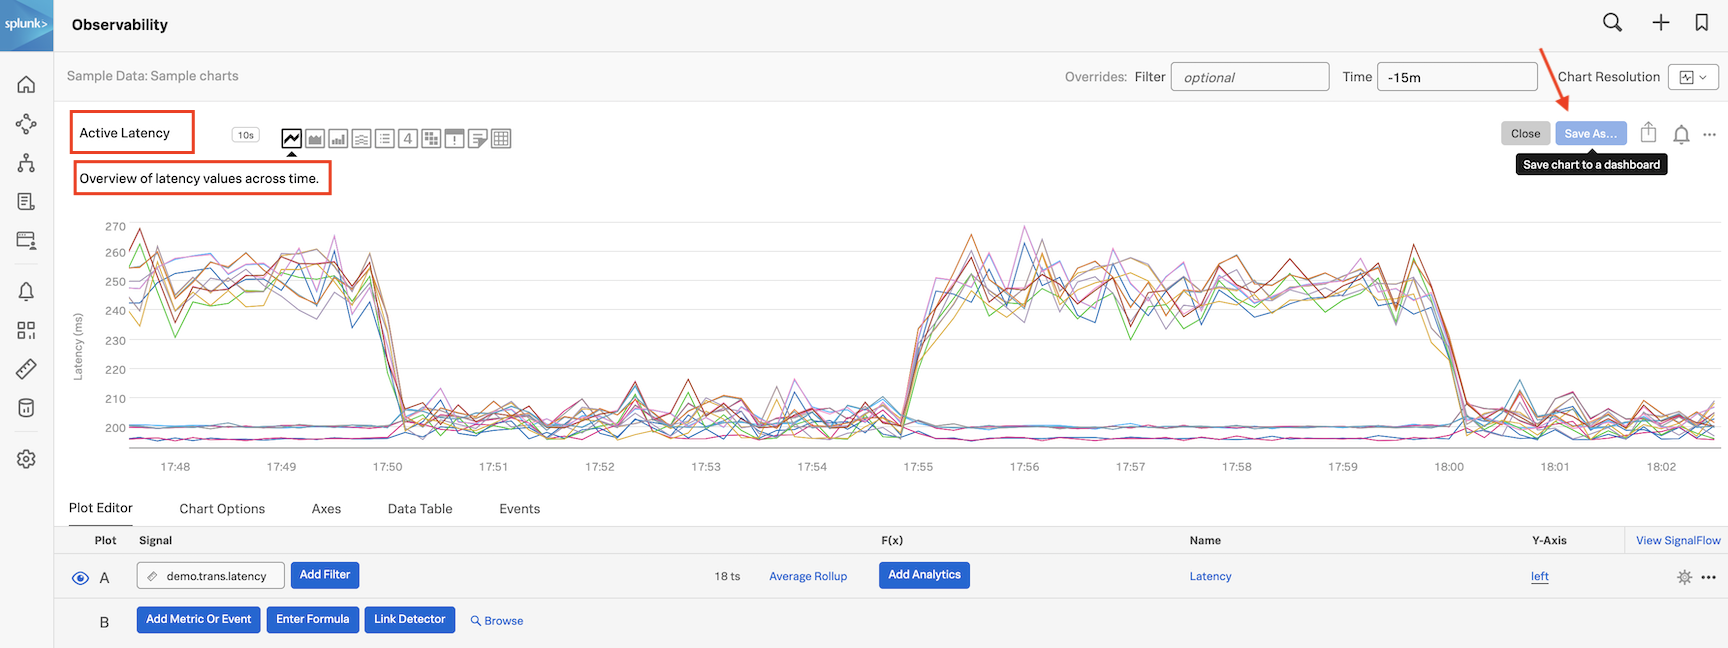
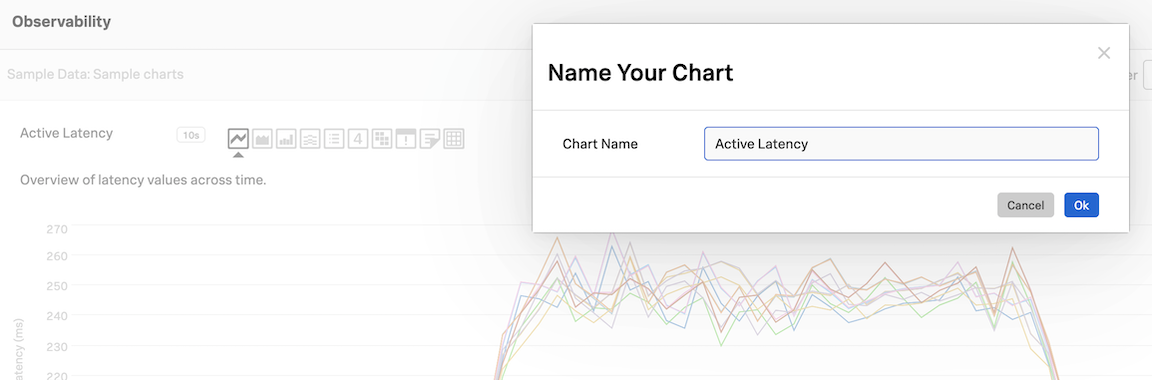
Click the Save As button. Make sure your chart has a name, it will use the name Active Latency the you defined in the previous step, but you can edit it here if needed.
Press the Ok button to continue.
2. Creating a dashboard
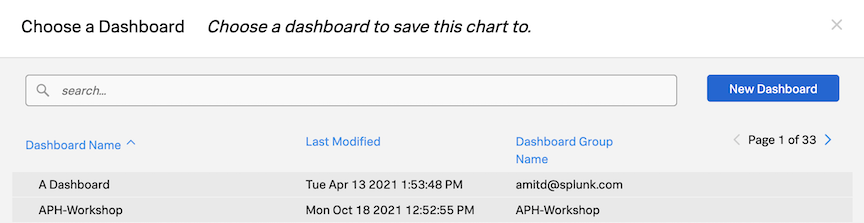
In the Choose dashboard dialog, we need to create a new dashboard, click on the New Dashboard button.
You will now see the New Dashboard Dialog. In here you can give you dashboard a name and description, and set Read and Write Permissions.
Please use your own name in the following format to give your dashboard a name e.g. YOUR_NAME-Dashboard.
Please replace YOUR_NAME with your own name, change the dashboard permissions to Restricted Read and Write access, and verify your user can read/write.
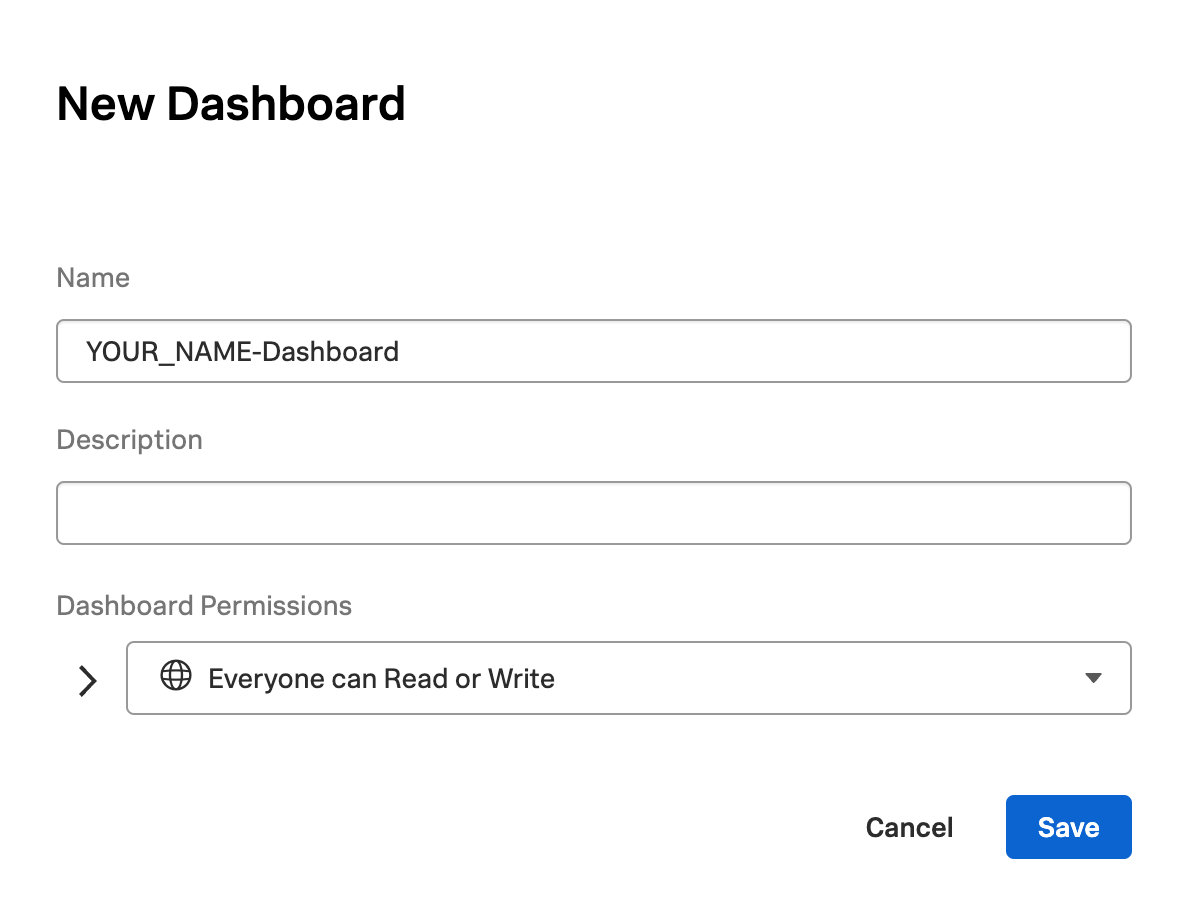
You should see you own login information displayed, meaning you are now the only one who can edit this dashboard. Of course you have the option to add other users or teams from the drop box below that may edit your dashboard and charts, but for now make sure you change it back to Everyone can Read or Write to remove any restrictions and press the Save Button to continue.
Your new dashboard is now available and selected so you can save your chart in your new dashboard.
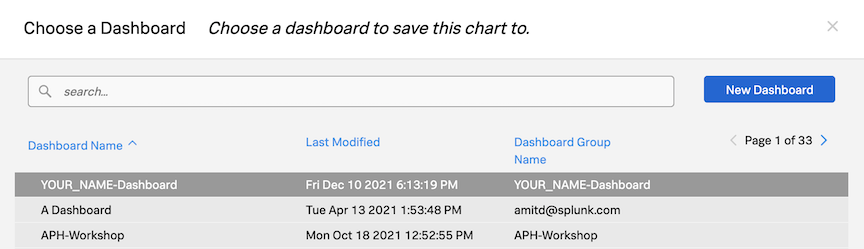
Make sure you have your dashboard selected and press the Ok button.
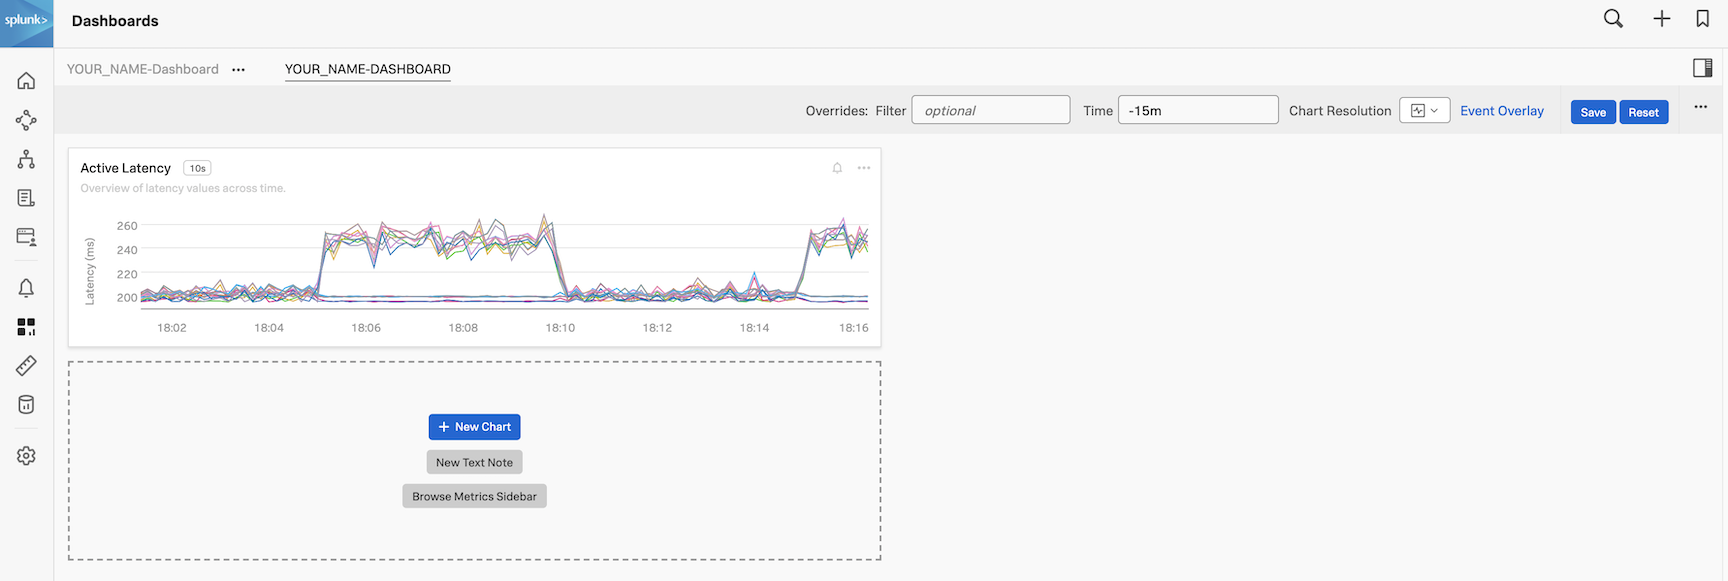
You will now be taken to your dashboard like below. You can see at the top left that your YOUR_NAME-DASHBOARD is part of a Dashboard Group YOUR_NAME-Dashboard. You can add other dashboards to this dashboard group.
3. Add to Team page
It is common practice to link dashboards that are relevant to a Team to a teams page. So let’s add your dashboard to the team page for easy access later. Use the  from the navbar again.
This will bring you to your teams dashboard, We use the team Example Team as an example here, the workshop one will be different.
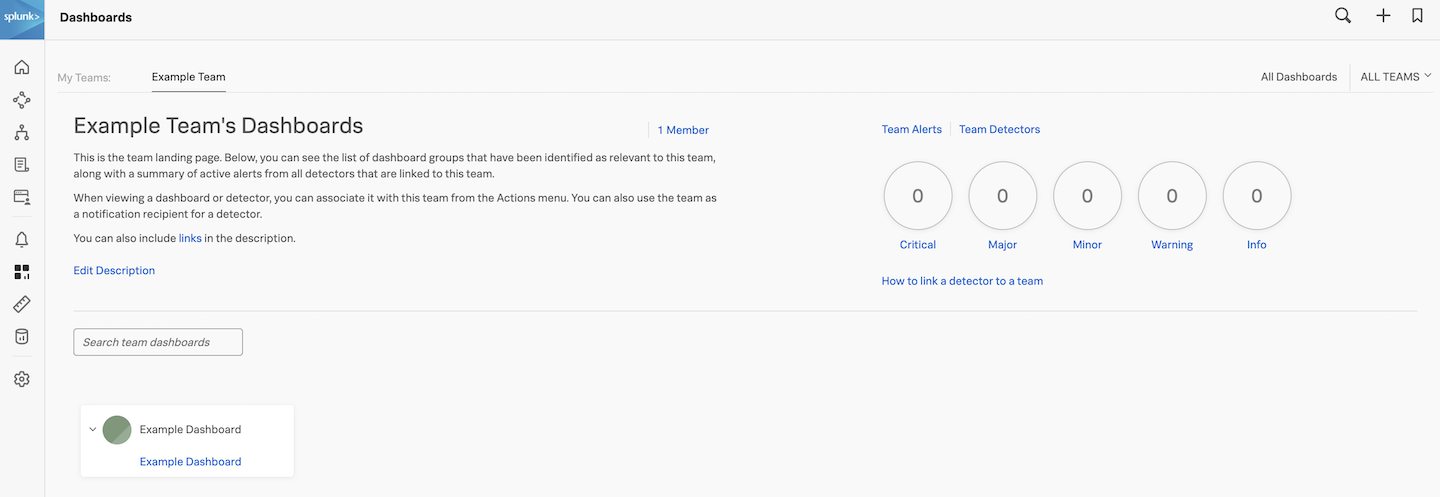
Press the + Add Dashboard Group button to add you dashboard to the team page.
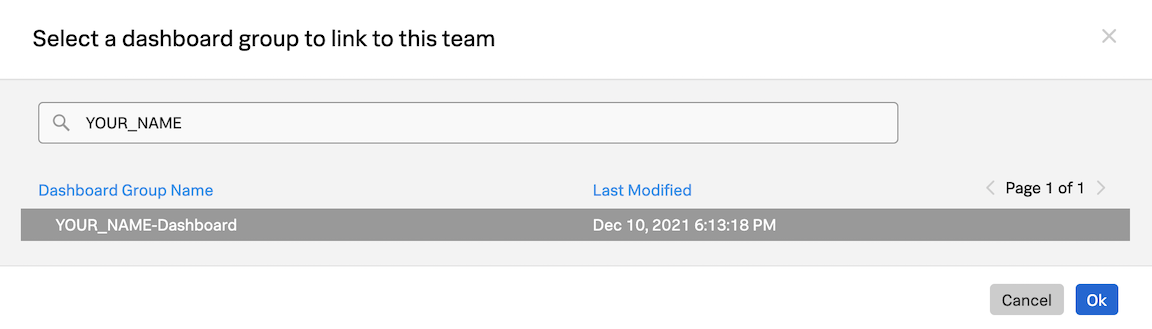
This will bring you to the Select a dashboard group to link to this team dialog. Type your name (that you used above) in the search box to find your Dashboard. Select it so its highlighted and click the Ok button to add your dashboard.
Your dashboard group will appear as part of the team page. Please note during the course of the workshop many more will appear here.
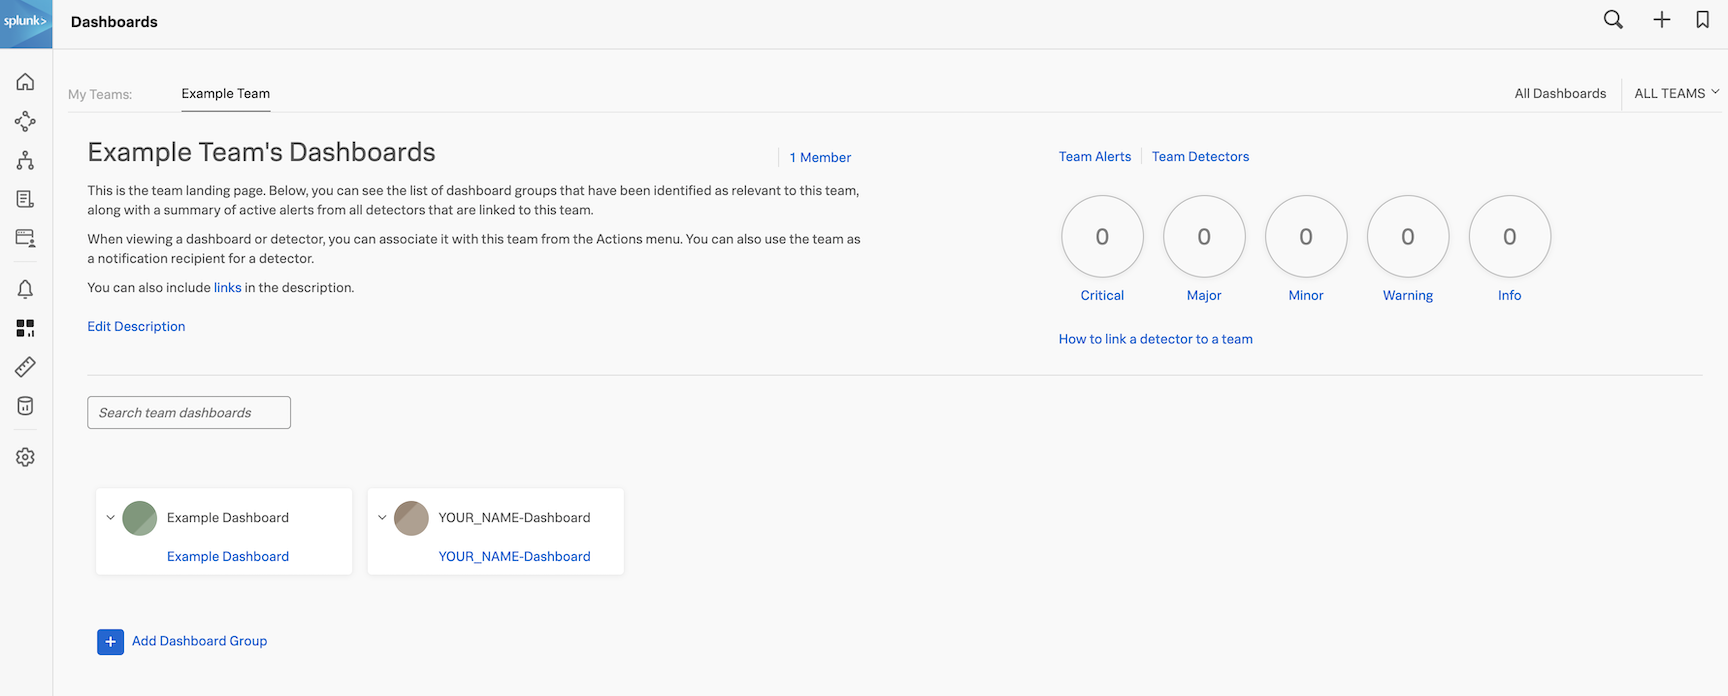
Now click on the link for your Dashboard to add more charts!