Manage Incidents
1. Acknowledge
Use your Splunk On-Call App on your phone to acknowledge the Incident by clicking on the push notification …
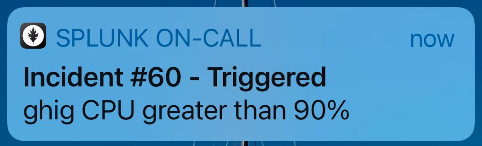
…to open the alert in the Splunk On-Call mobile app, then clicking on either the single tick in the top right hand corner, or the Acknowledge link to acknowledge the incident and stop the escalation process.
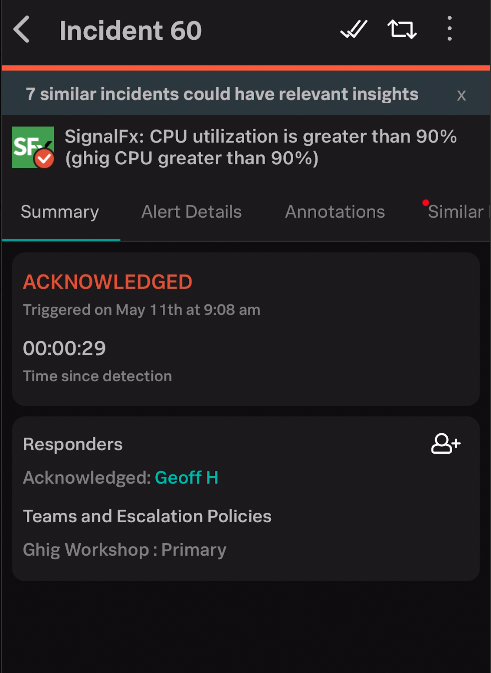
The :fontawesome-solid-check: will then transform into a :fontawesome-solid-check::fontawesome-solid-check:, and the status will change from TRIGGERED to ACKNOWLEDGED.
| Triggered Incident | Acknowledge Incident |
|---|---|
| 
|
2. Details and Annotations
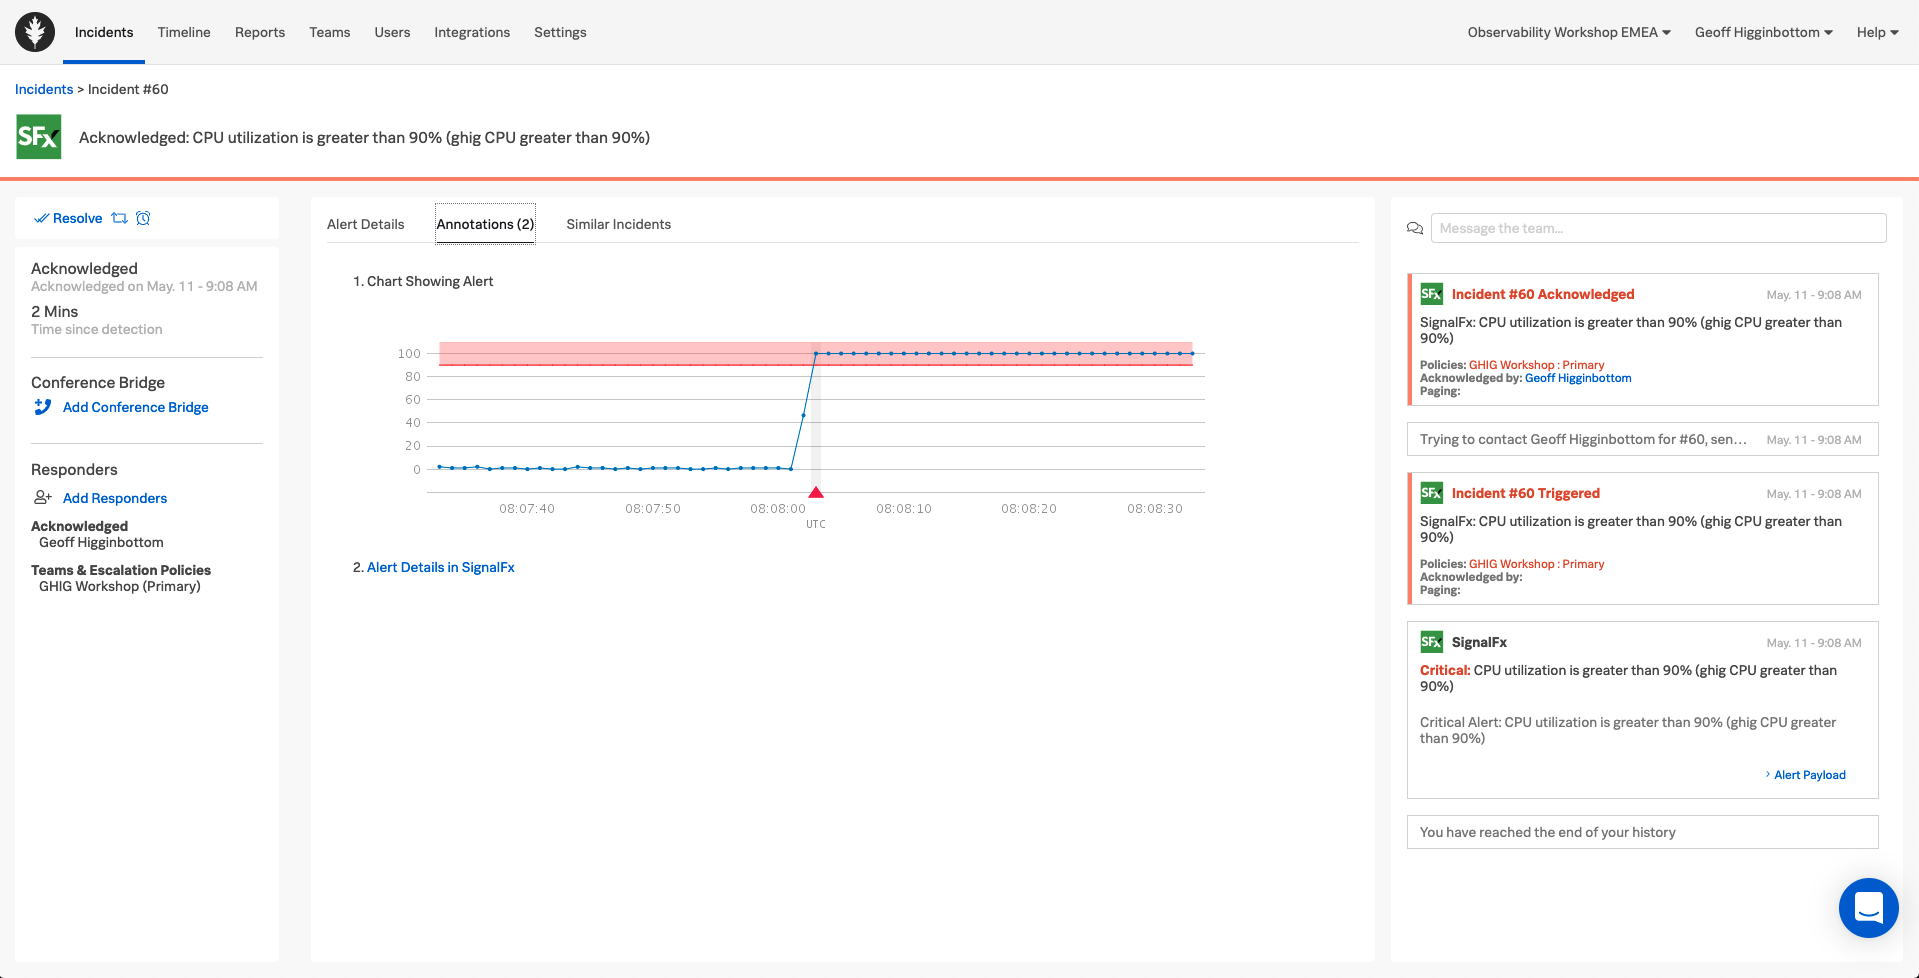
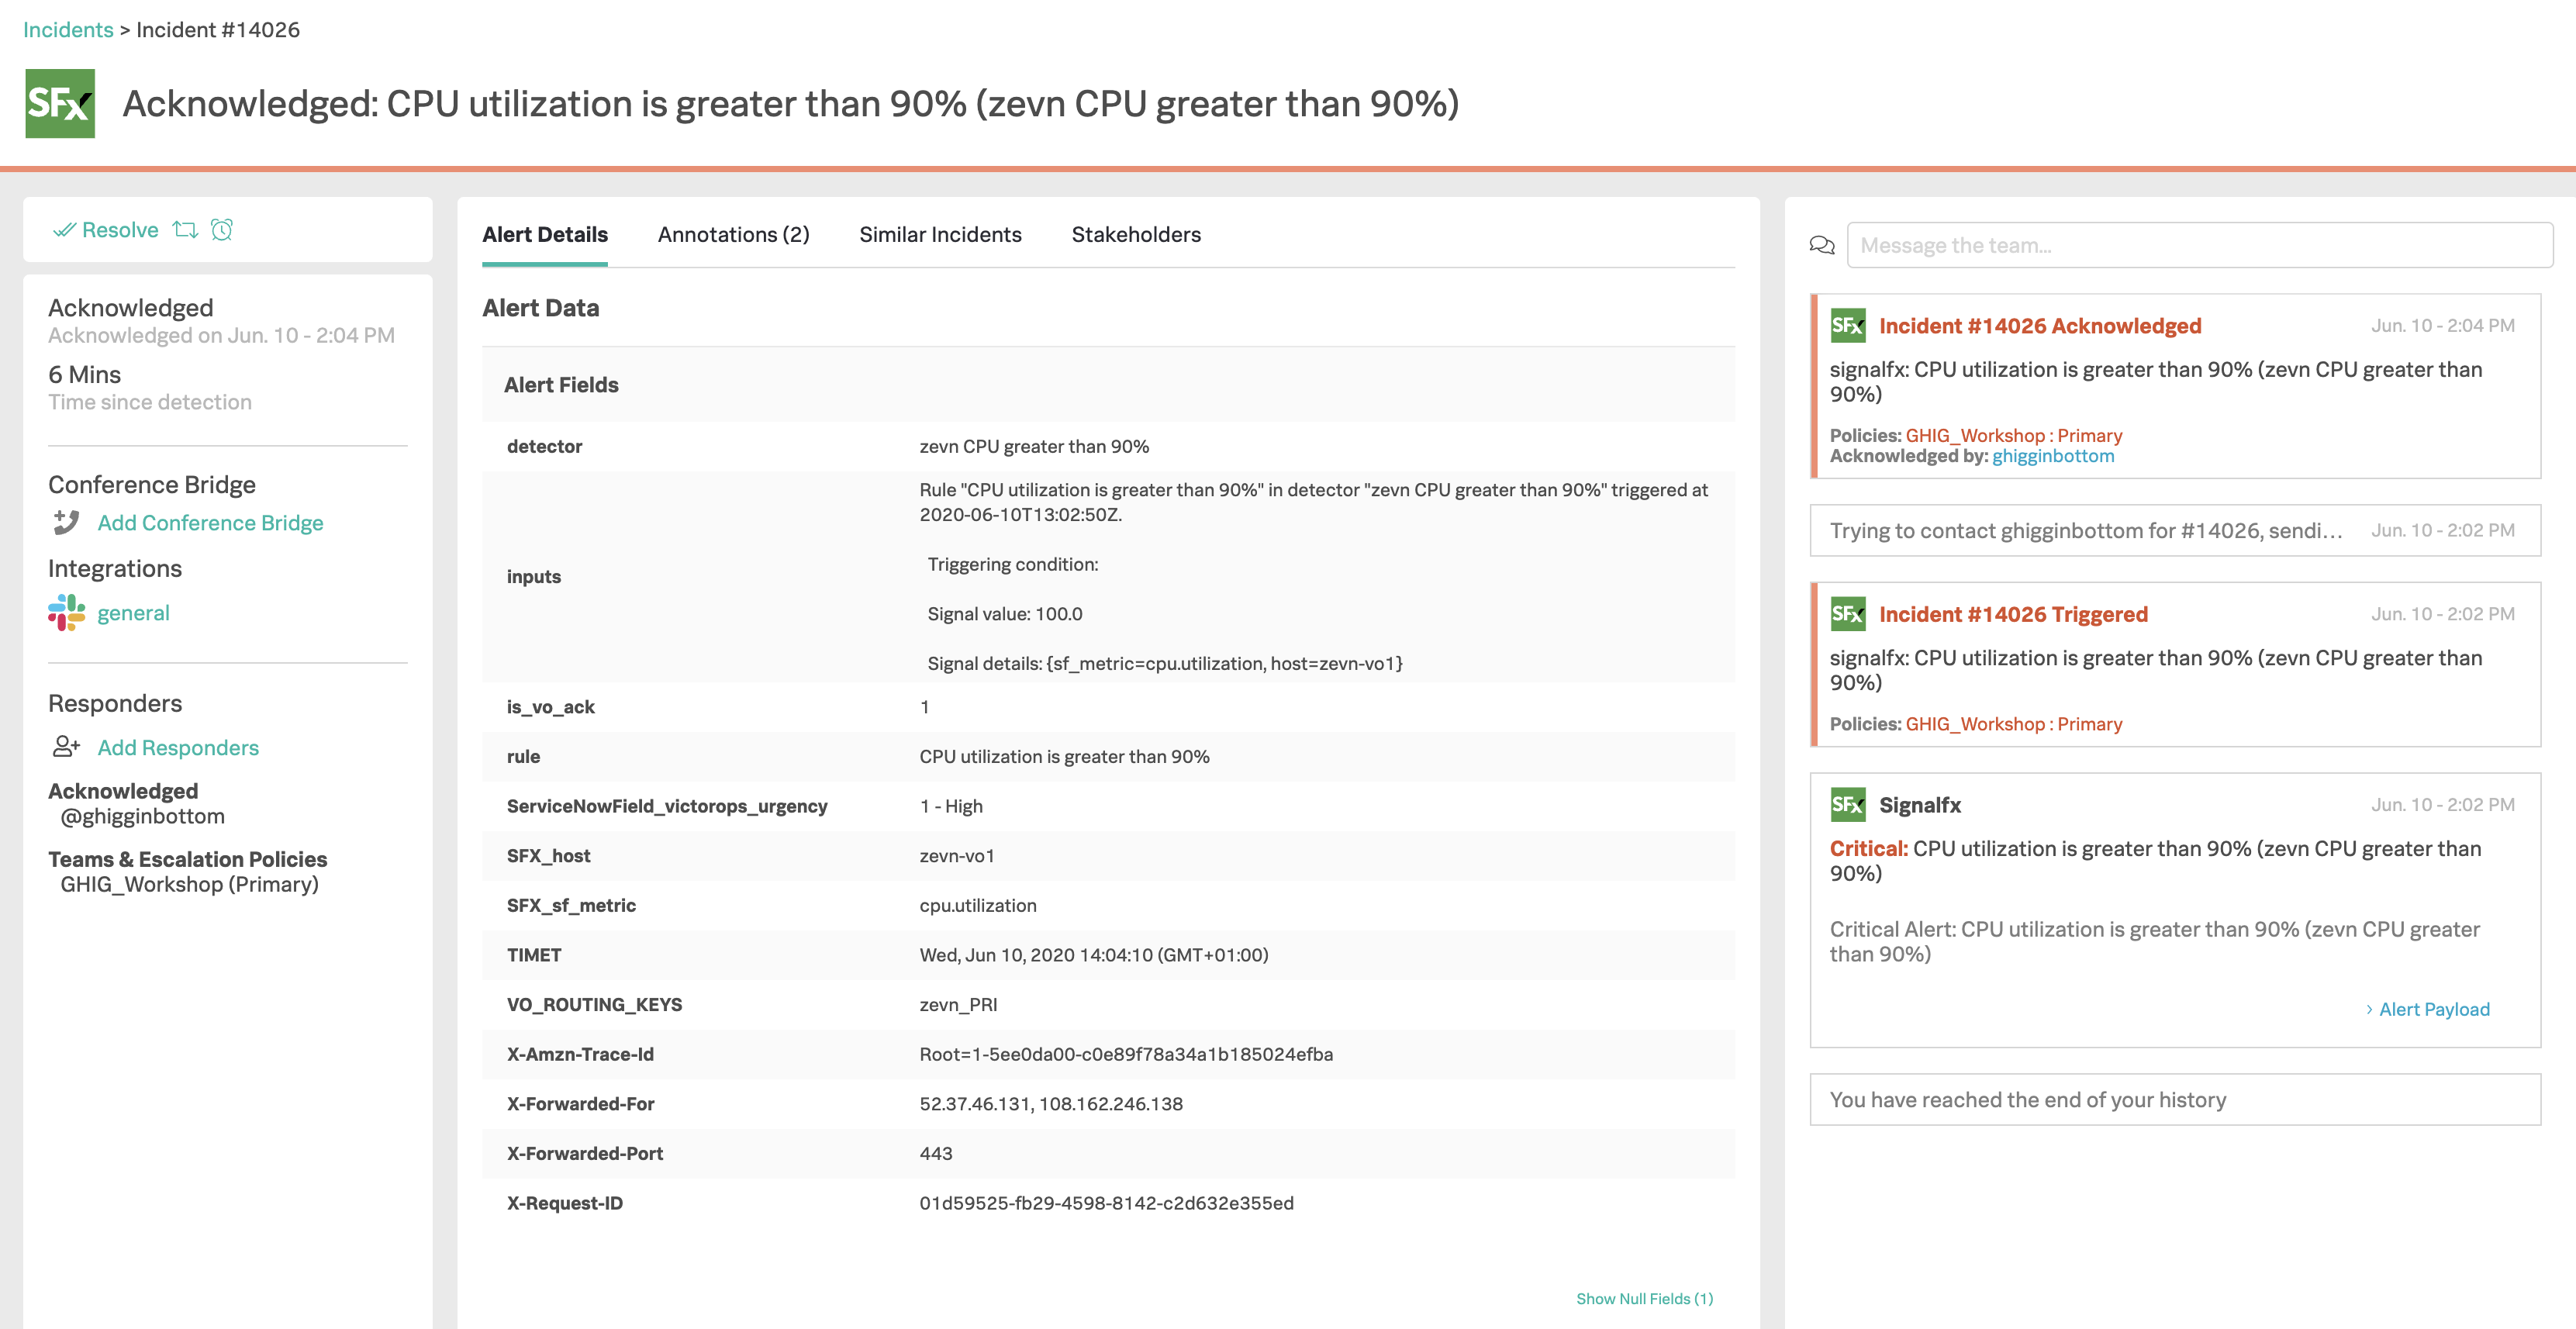
Still on your phone, select the Alert Details tab. Then on the Web UI, navigate back to Timeline, select Team Incidents on the right, then select Acknowledged and click into the new Incident, this will open up the War Room Dashboard view of the Incident.
You should now have the Details tab displayed on both your Phone and the Web UI. Notice how they both show the exact same information.
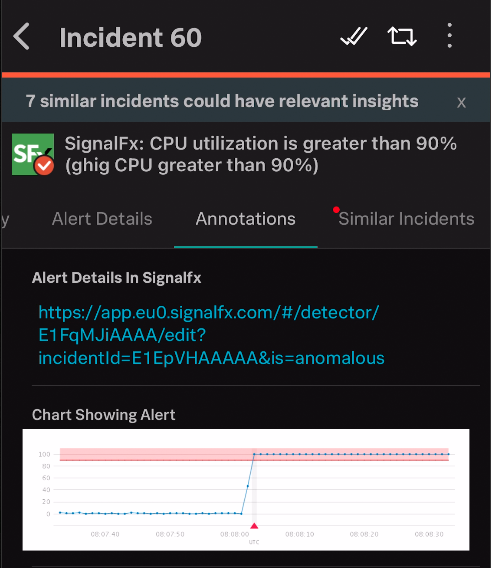
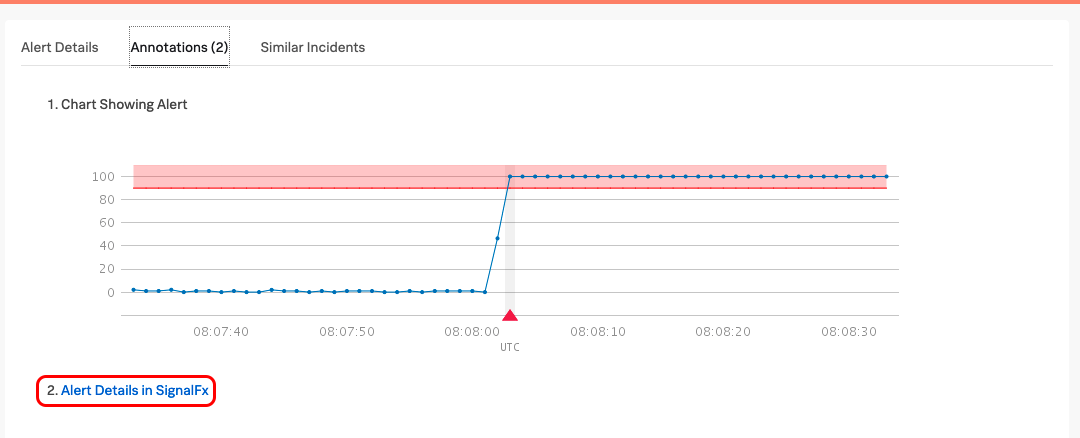
Now select the Annotations tab on both the Phone and the Web UI, you should have a Graph displayed in the UI which is generated by Splunk Infrastructure Monitoring.
On your phone you should get the same image displayed (sometimes it’s a simple hyperlink depending on the image size)
Splunk On-Call is a ‘Mobile First’ platform meaning the phone app is full functionality and you can manage an incident directly from your phone.
For the remainder of this module we will focus on the Web UI however please spend some time later exploring the phone app features.
3. Link to Alerting System
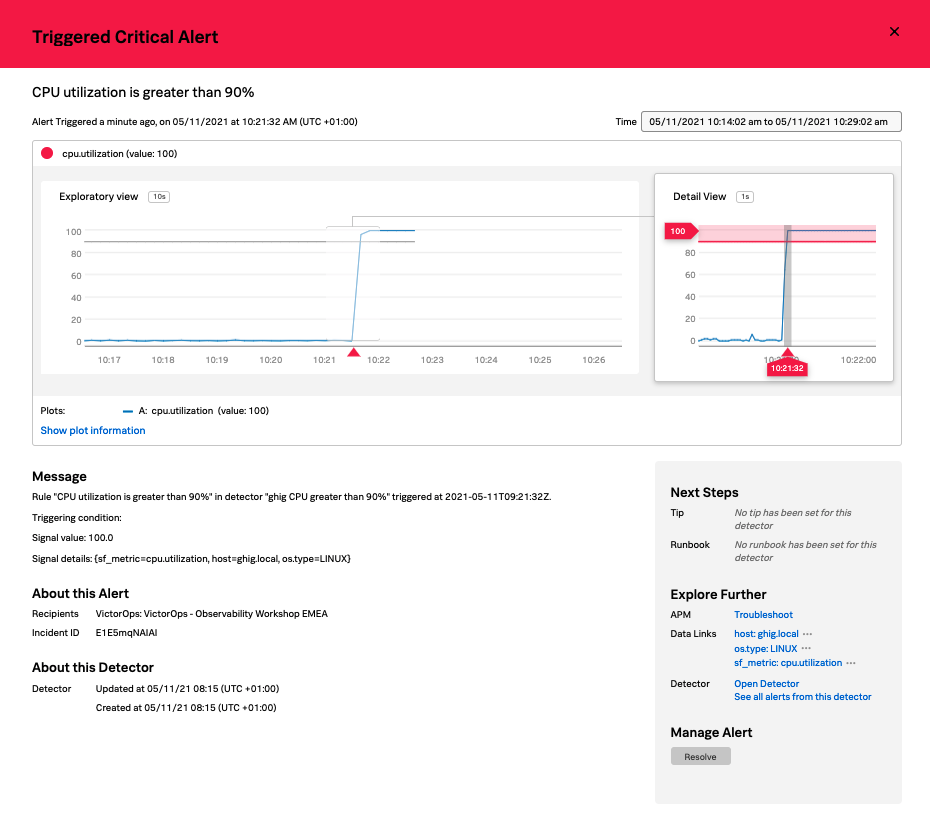
Sticking with the Web UI, click the 2. Alert Details in SignalFx link.
This will open a new browser tab and take you directly to the Alert within Splunk Infrastructure Monitoring where you could then progress your troubleshooting using the powerful tools built into its UI.
However, we are focussing on Splunk On-Call so close this tab and return to the Splunk On-Call UI.
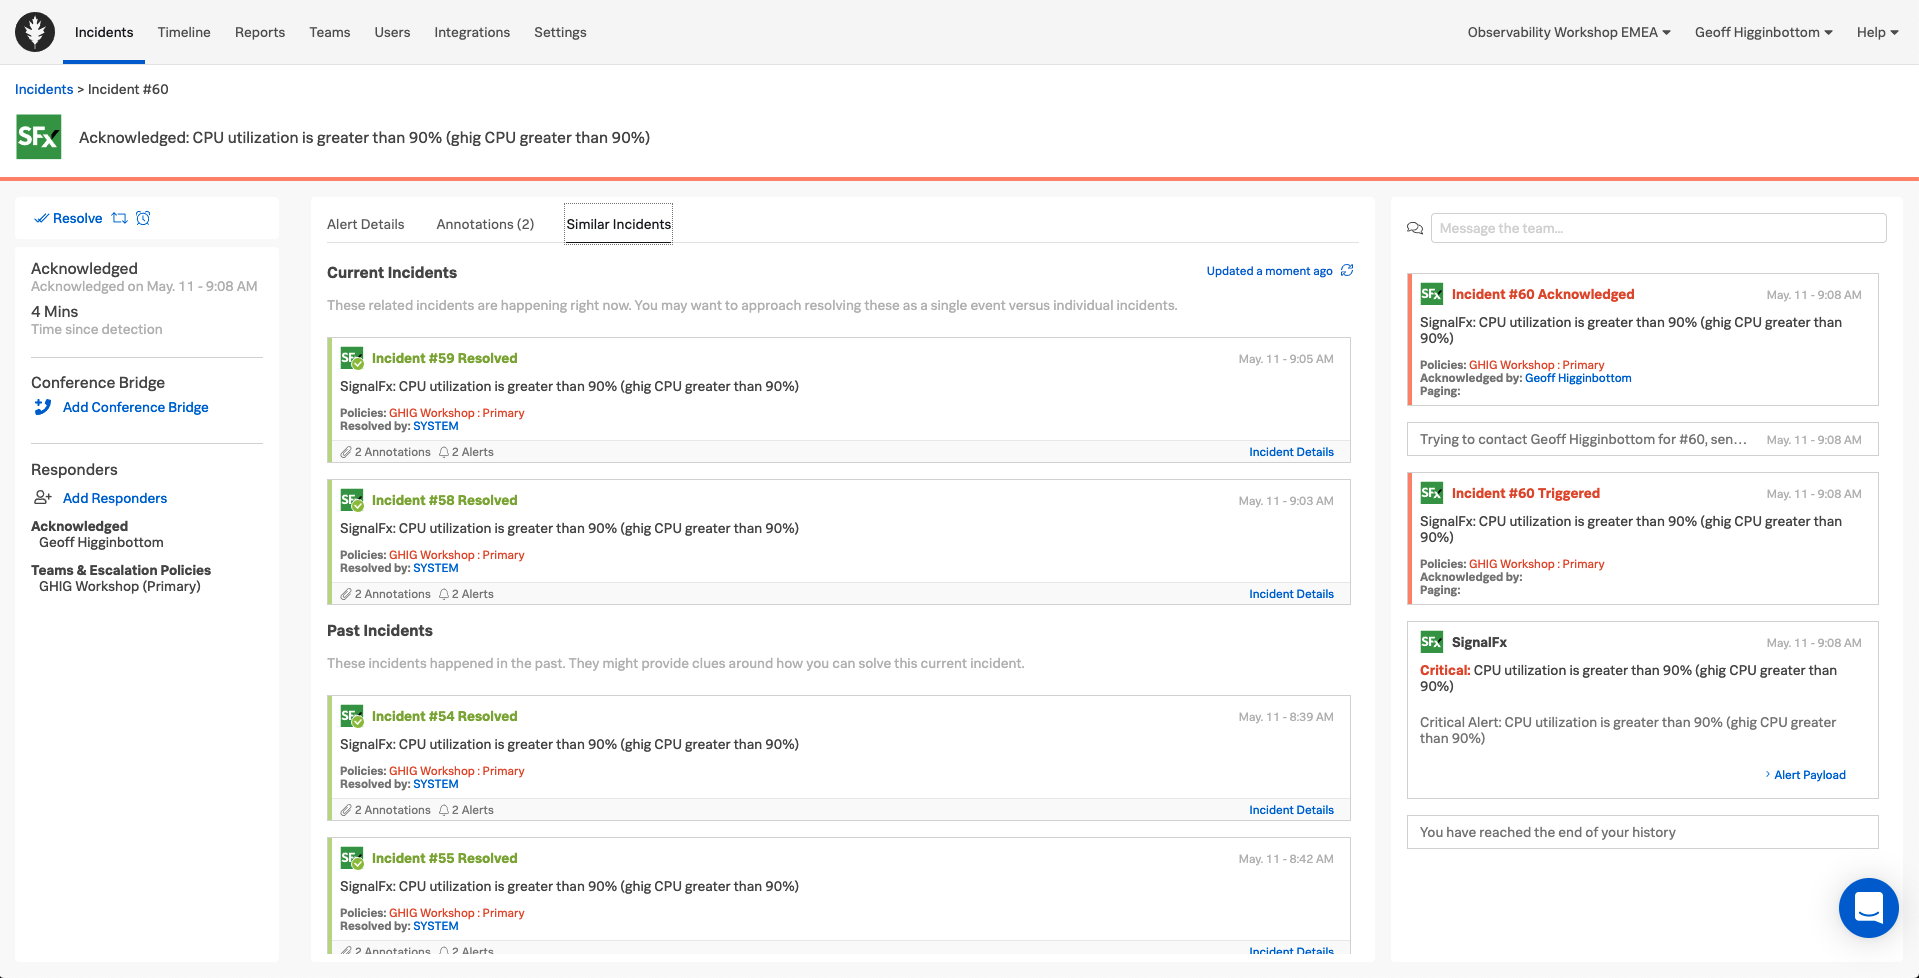
4. Similar Incidents
What if Splunk On-Call could identify previous incidents within the system which may give you a clue to the best way to tackle this incident.
The Similar Incidents tab does exactly that, surfacing previous incidents allowing you to look at them and see what actions were taken to resolve them, actions which could be easily repeated for this incident.
5 Timeline
On right we have a Time Line view where you can add messages and see the history of previous alerts and interactions.
6 Add Responders
On the far left you have the option of allocating additional resources to this incident by clicking on the Add Responders link.
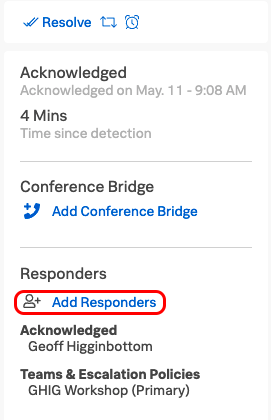
This allows you build a virtual team specific to this incident by adding other Teams or individual Users, and also share details of a Conference Bridge where you can all get together and collaborate.
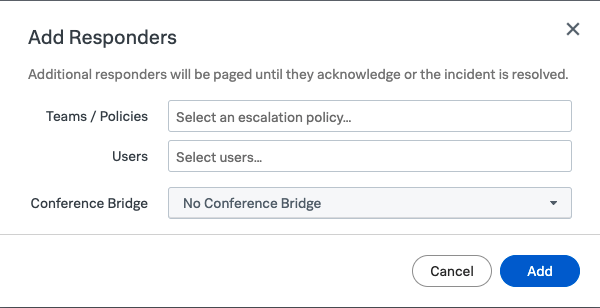
Once the system has built up some incident data history, it will use Machine Learning to suggest Teams and Users who have historically worked on similar incidents, as they may be best placed to help resolve this incident quickly.
You can select different Teams and/or Users and also choose from a pre-configured conference bridge, or populate the details of a new bridge from your preferred provider.
We do not need to add any Responders in this exercise so close the Add Responders dialogue by clicking Cancel.
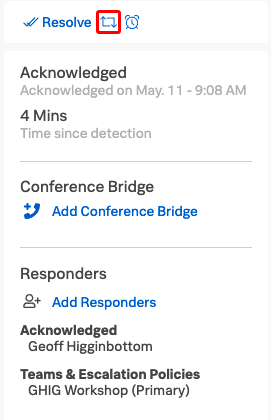
7 Reroute
If it’s decided that maybe the incident could be better dealt with by a different Team, the call can be Rerouted by clicking the Reroute Button at the top of the left hand panel.
In a similar method to that used in the Add Responders dialogue, you can select Teams or Users to Reroute the Incident to.
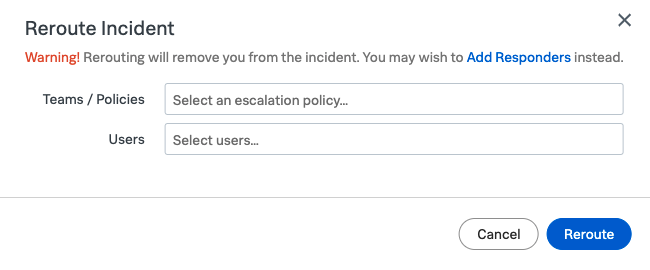
We do not need to actually Reroute in this exercise so close the Reroute Incident dialogue by clicking Cancel.
8 Snooze
You can also snooze this incident by clicking on the alarm clock Button at the top of the left hand panel.
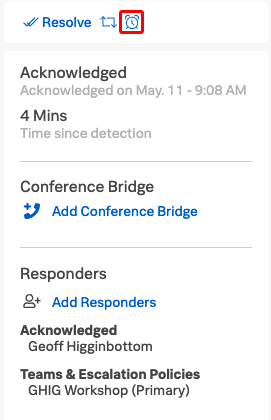
You can enter an amount of time upto 24 hours to snooze the incident. This action will be tracked in the Timeline, and when the time expires the paging will restart.
This is useful for low priority incidents, enabling you to put them on a back burner for a few hours, but it ensures they do not get forgotten thanks to the paging process starting again.
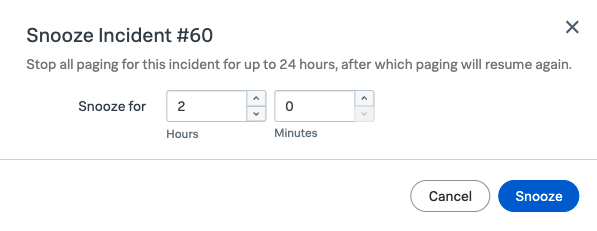
We do not need to actually Snooze in this exercise so close the Snooze Incident dialogue by clicking Cancel.
9 Action Tracking
Now lets fix this issue and update the Incident with what we did. Add a new message at the top of the right hand panel such as Discovered rogue process, terminated it.
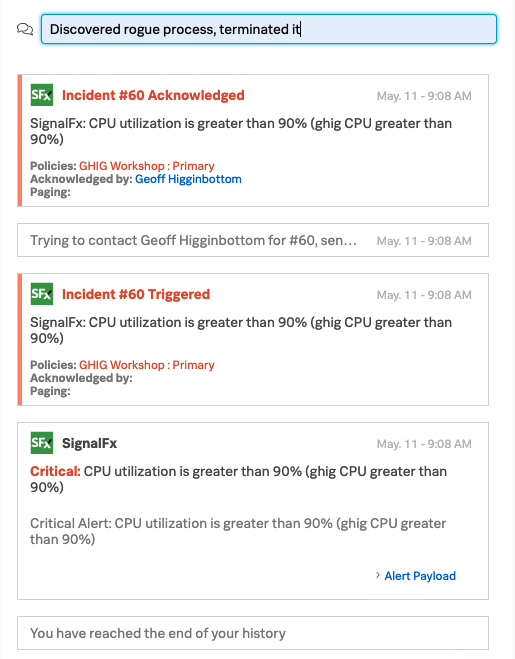
All the actions related to the Incident will be recorded here, and can then be summarized is a Post Incident Review Report available from the Reports tab
10 Resolution
Now kill off the process we started in the VM to max out the CPU by switching back the Shell session for the VM and pressing ctrl+c
Within no more than 10 seconds SignalFx should detect the new CPU value, clear the alert state in SignalFx, then automatically update the Incident in VictorOps marking it as Resolved.
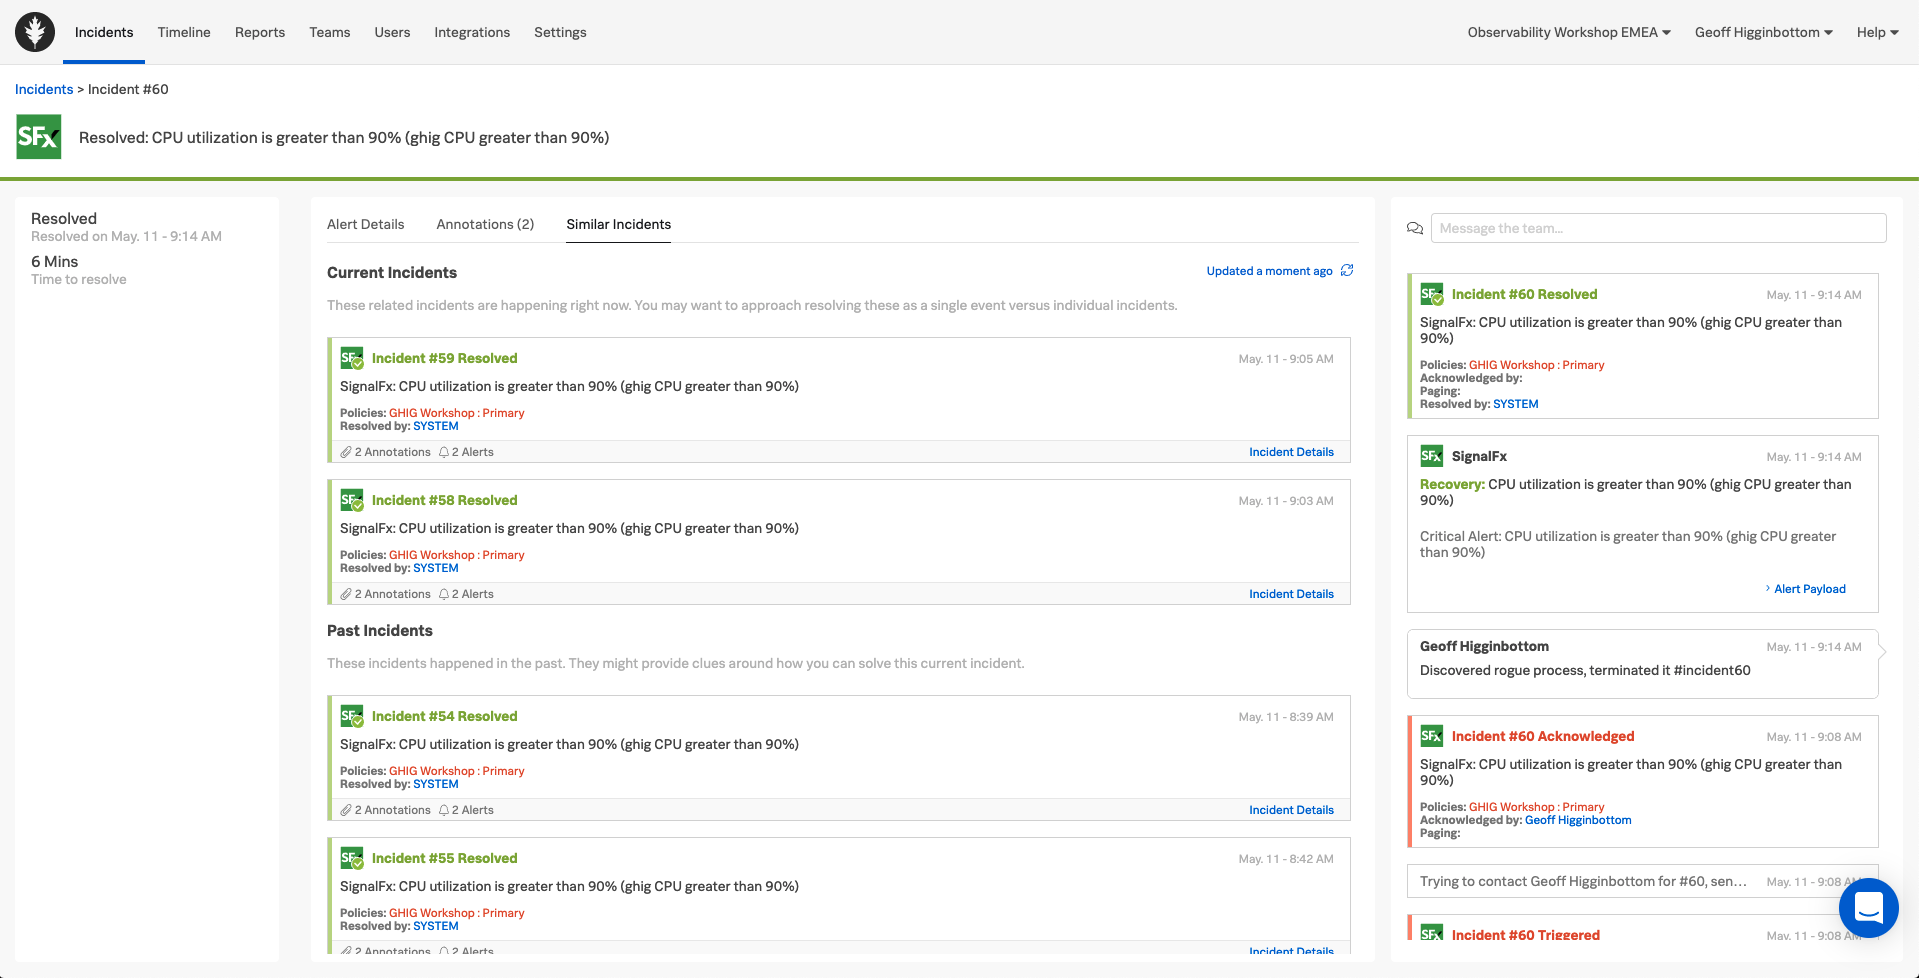
As we have two way integration between Splunk Infrastructure Monitoring and Splunk On-Call we could have also marked the incident as Resolved in Splunk On-Call, and this would have resulted in the alert in Splunk Infrastructure Monitoring being resolved as well.
That completes this introduction to Splunk On-Call!