1.1 Validate APM data
5 minutes1. RED Metrics
Go to Dashboards → All Dashboards → APM Services → Service. Here we can view the RED metrics (Rate, Error & Duration) for the Online Boutique application.
For this, we need to know the name of your application environment. In this workshop all the environments use: <instance>-workshop.
To find the instance, on the AWS/EC2 instance run the following command:
echo $INSTANCE-workshopbdzx-workshopSelect the environment you found in the previous step then select the frontend service and set the time to Past 15 minutes.
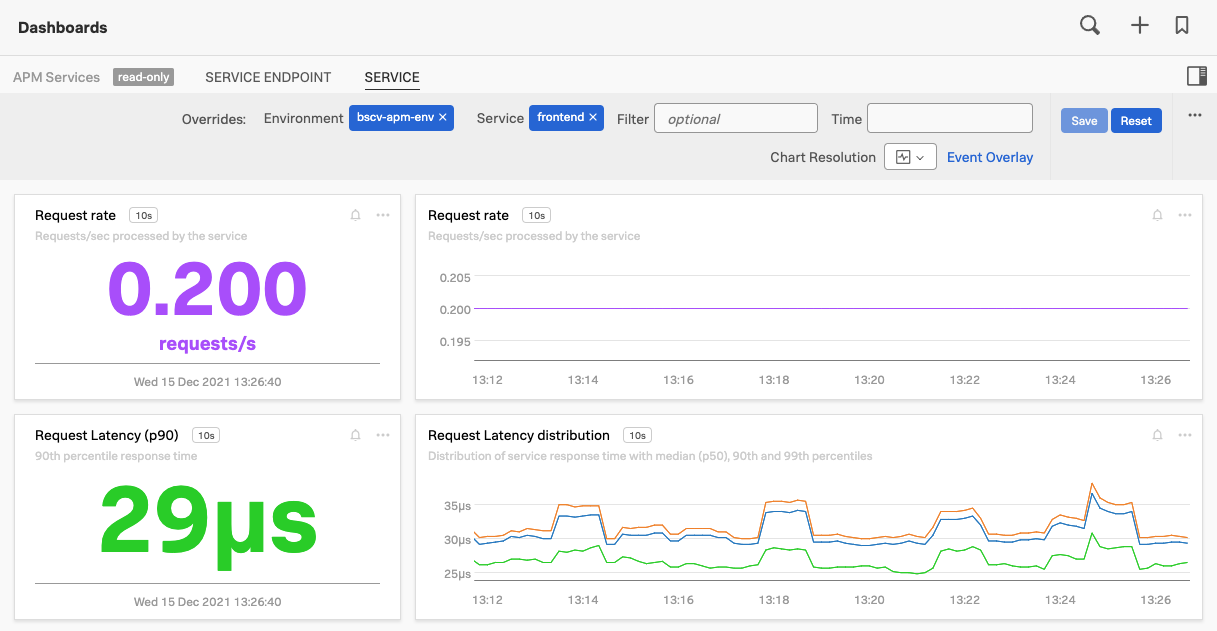
With this automatically generated dashboard, you can keep an eye out for the health of your service(s) using RED (Rate, Error & Duration) metrics. It provides various performance-related charts as well as correlated information on the underlying host and Kubernetes pods (if applicable).
Take some time to explore the various charts in this dashboard
2. APM Metrics
In the left-hand menu card click on APM this will bring you to the APM Overview dashboard:
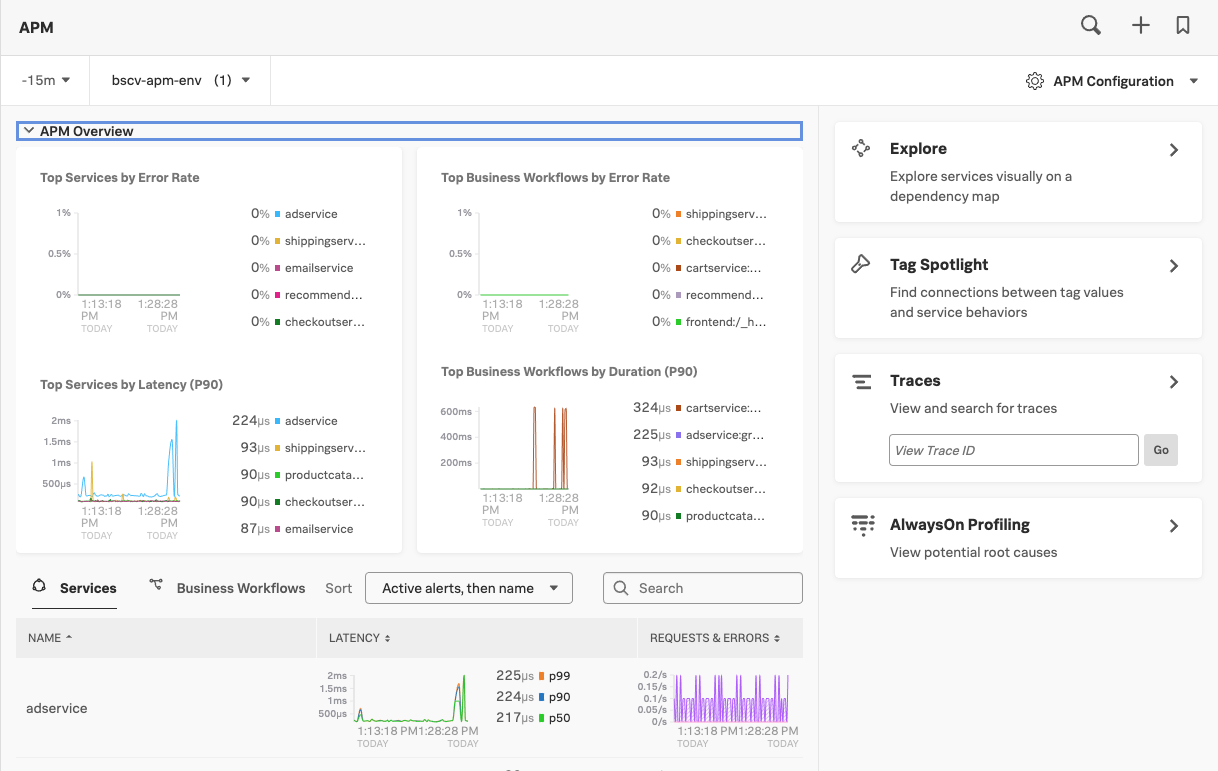
Select Explore on the right-hand side select the environment you found before and set the time to 15 minutes. This will show you the automatically generated Dependency/Service Map for the Online Boutique application.
It should look similar to the screenshot below:
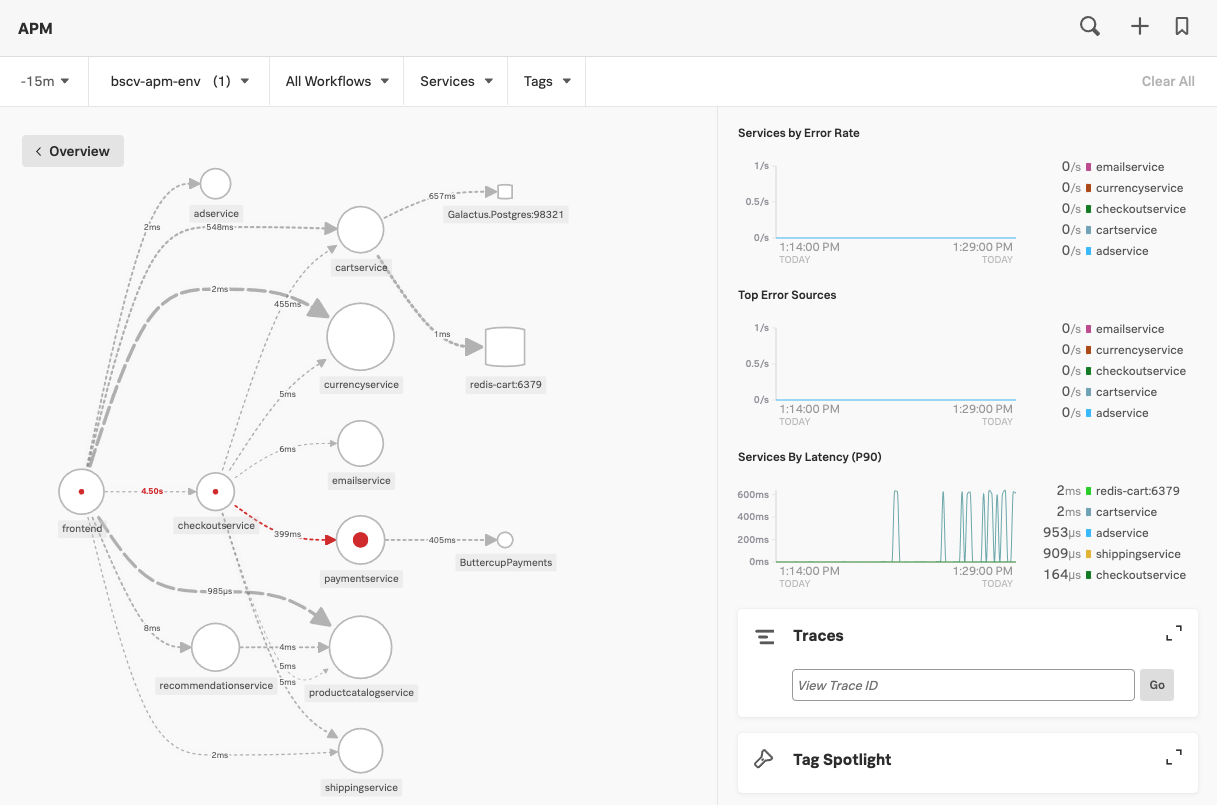
The legend at the bottom of the page explains the different visualizations in the Dependency/Service Map.
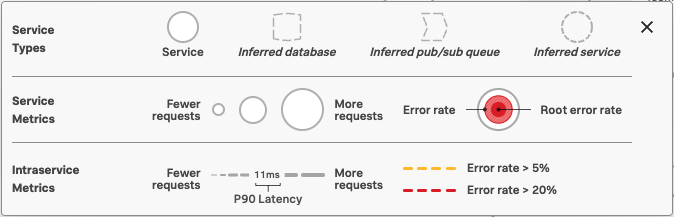
- Service requests, error rate and root error rate.
- Request rate, latency and error rate
Also in this view, you can see the overall Error and Latency rates over time charts.
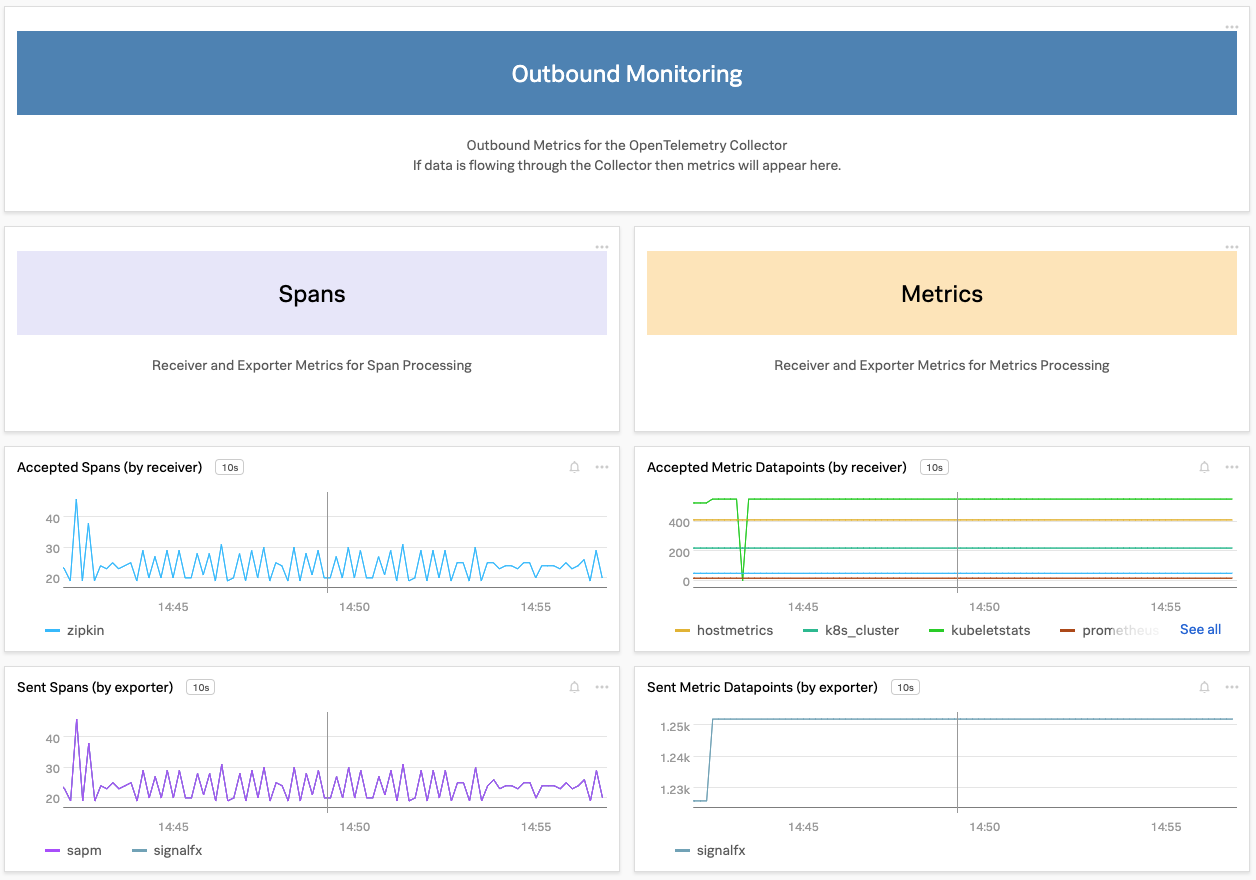
3. OpenTelemetry Dashboard
Once the Open Telemetery Collector is deployed the platform will automatically provide a built in dashboard display OpenTelemetry Collector metrics.
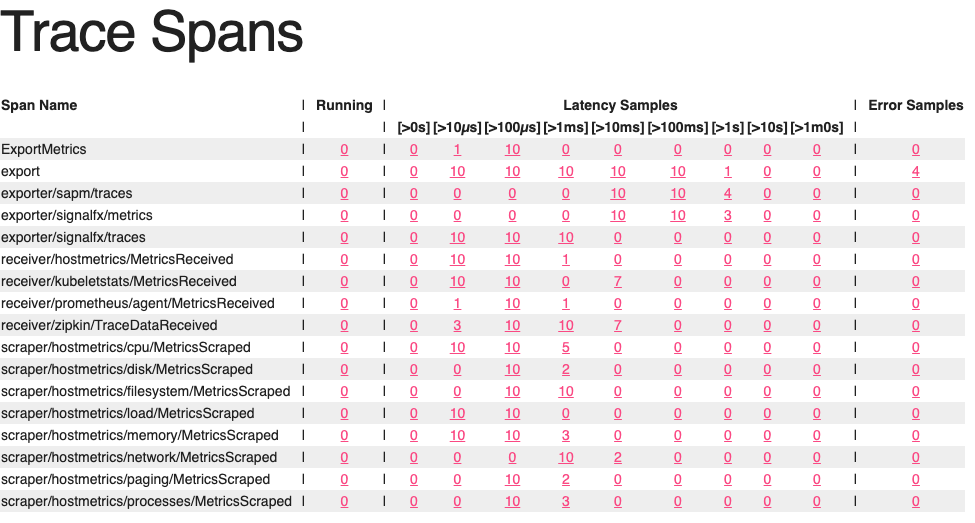
From the top left hamburger menu Dashboards → OpenTelemetry Collector, scroll all the way to the bottom of the page and validate metrics and spans are being sent:
4. OpenTelemetry zpages
To debug the traces being sent you can use the zpages extension. zpages are part of the OpenTelemetry collector and provide live data for troubleshooting and statistics.
Your Workshop instructor will provide you with a URL to access zPages. Enter this URL into your browser and you will see the zPages output.