2.3 Example trace
Example Trace
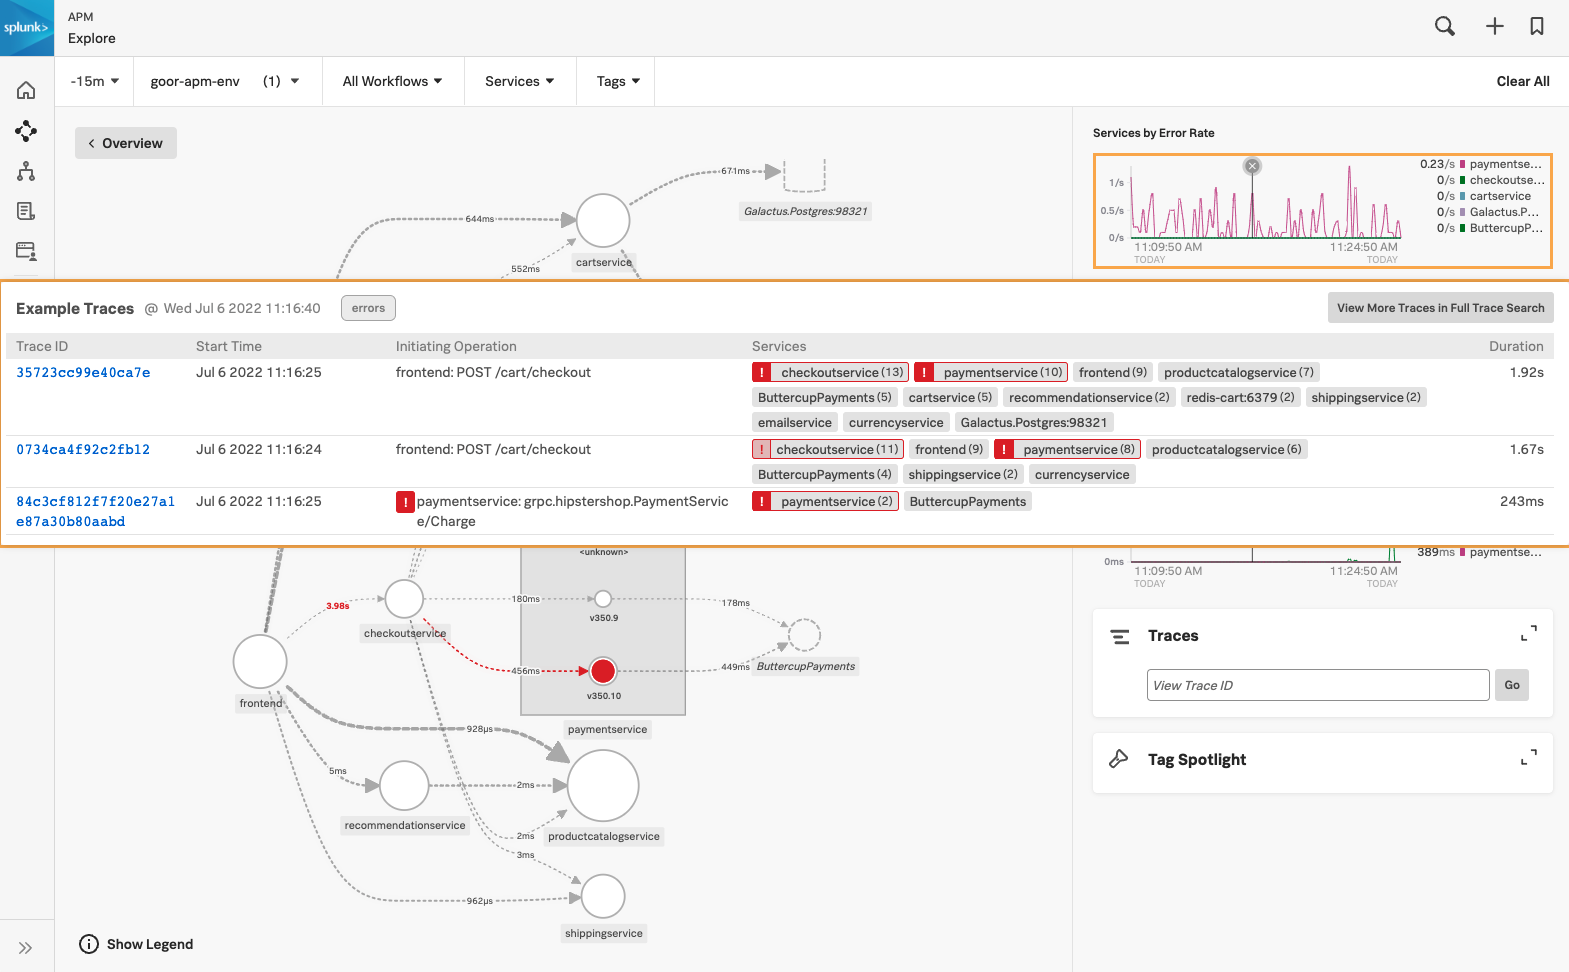
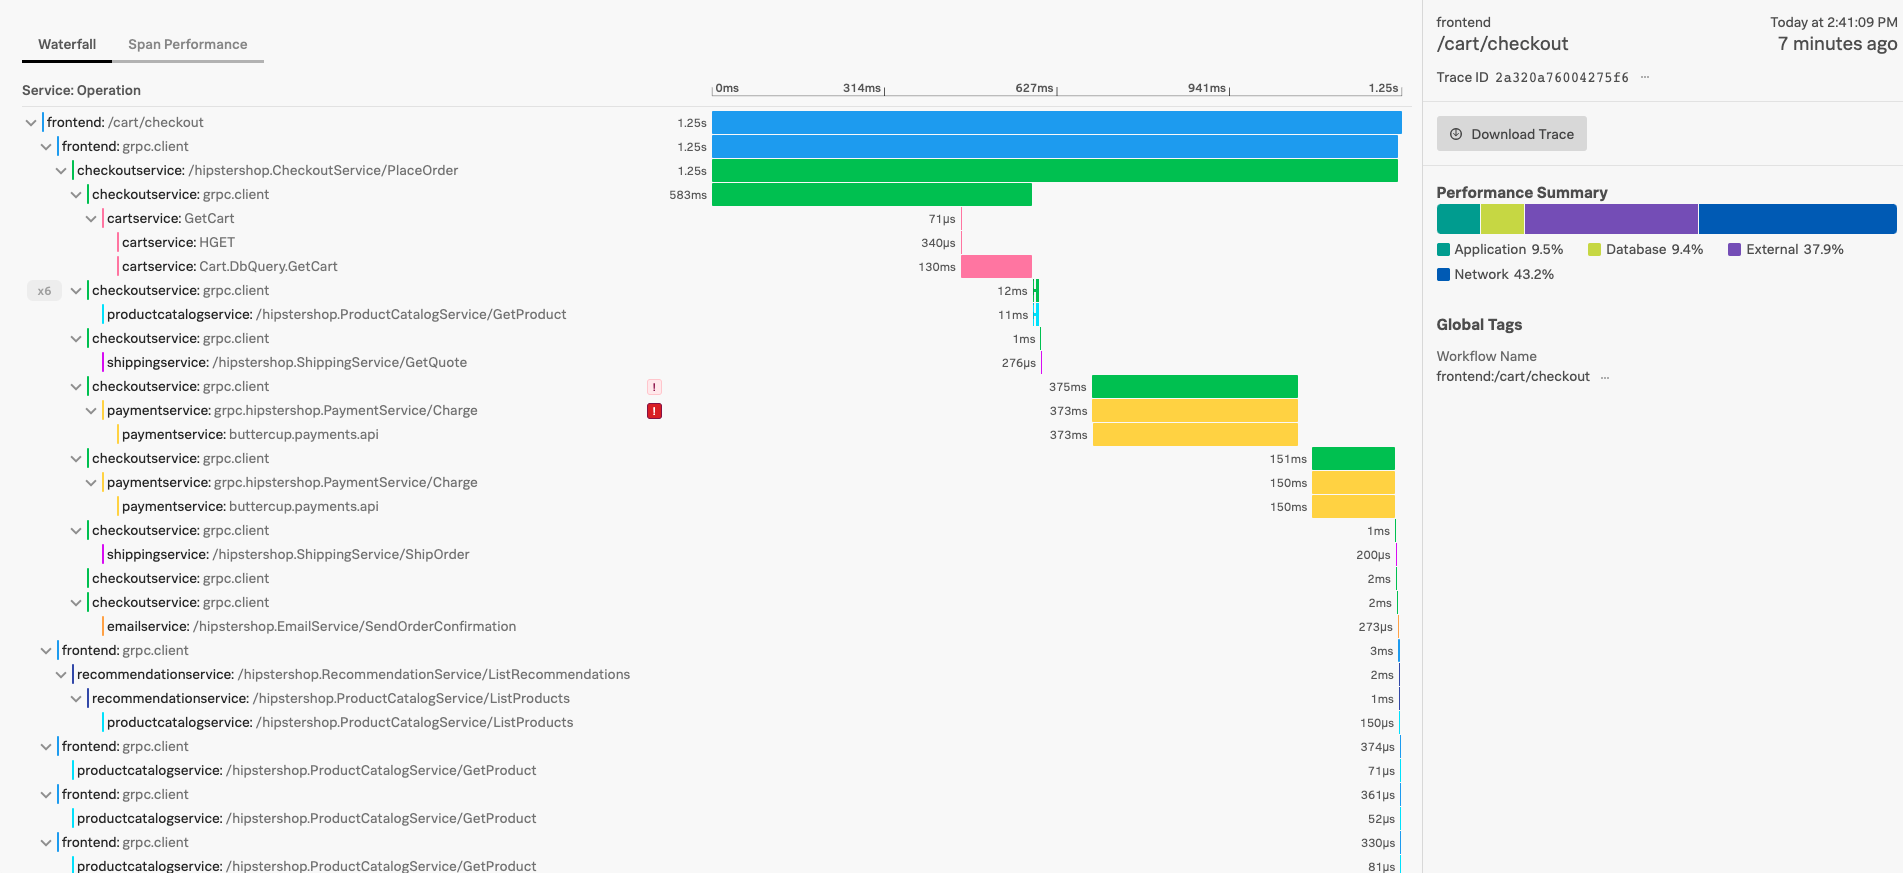
You should now see the entire trace along with the spans for the example trace that was selected. Spans which have errors are indicated by a red exclamation mark beside it. If you have a number such as x6 in a grey box, click it to expand the compacted paymentservice spans.
Now click one of the paymentservice spans with the red exclamation mark to expand it and see the associated metadata and some error details. Note that we are able to see that this error is caused by a 401 error and other useful information such as ‘tenant’ and ‘version’ is also displayed.
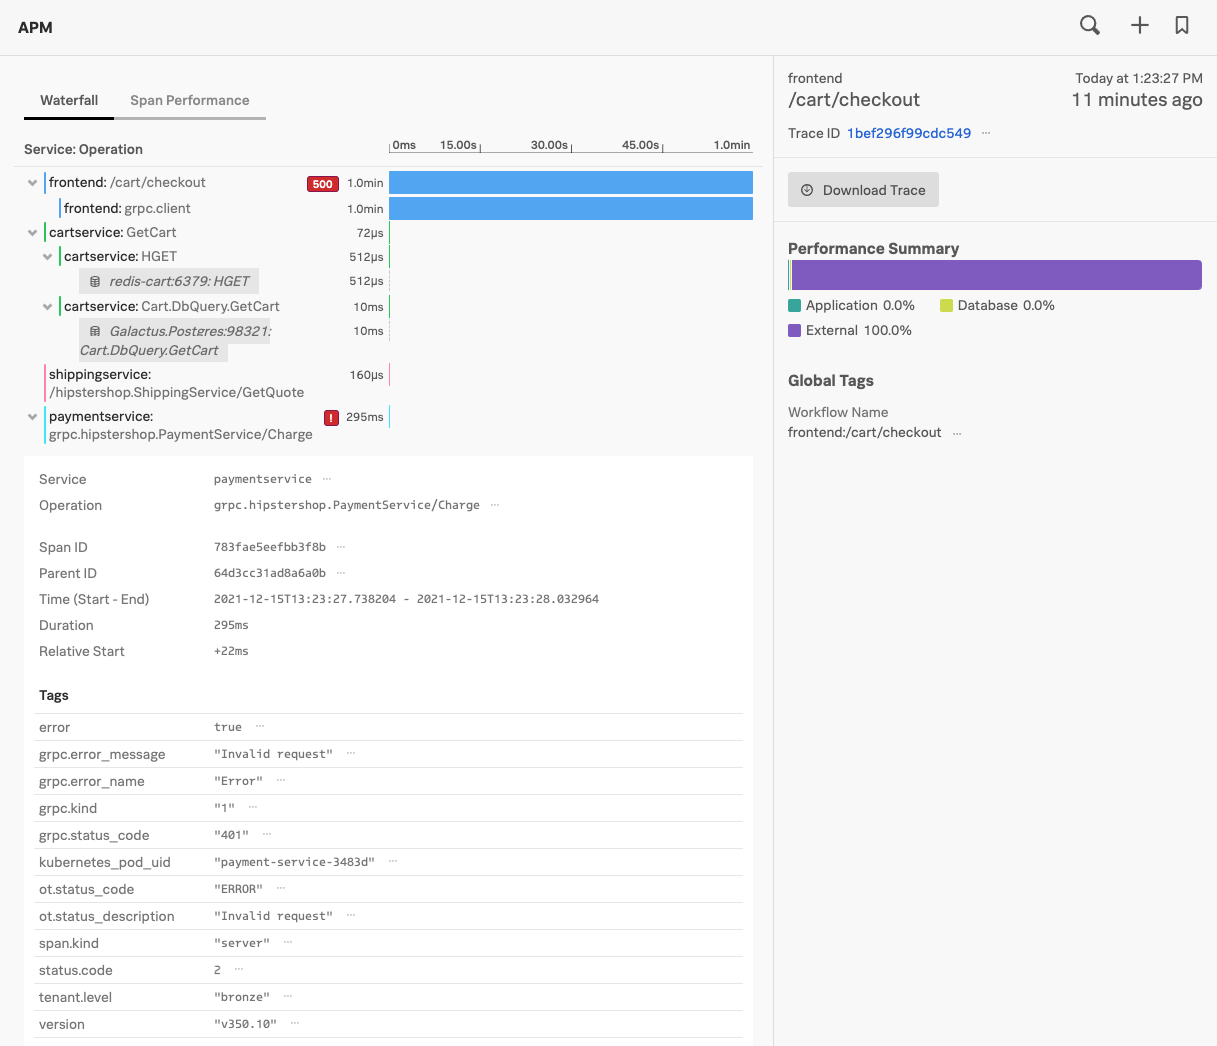
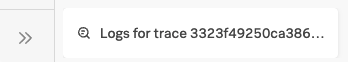
So we now know that the error is caused by an Invalid Request but we don’t know what exact request. At the bottom of the page you should see a contextual link to Logs, clink on this link to view the logs associated with this span.
You should now be looking at a Log Observer dashboard simialar to the image below.
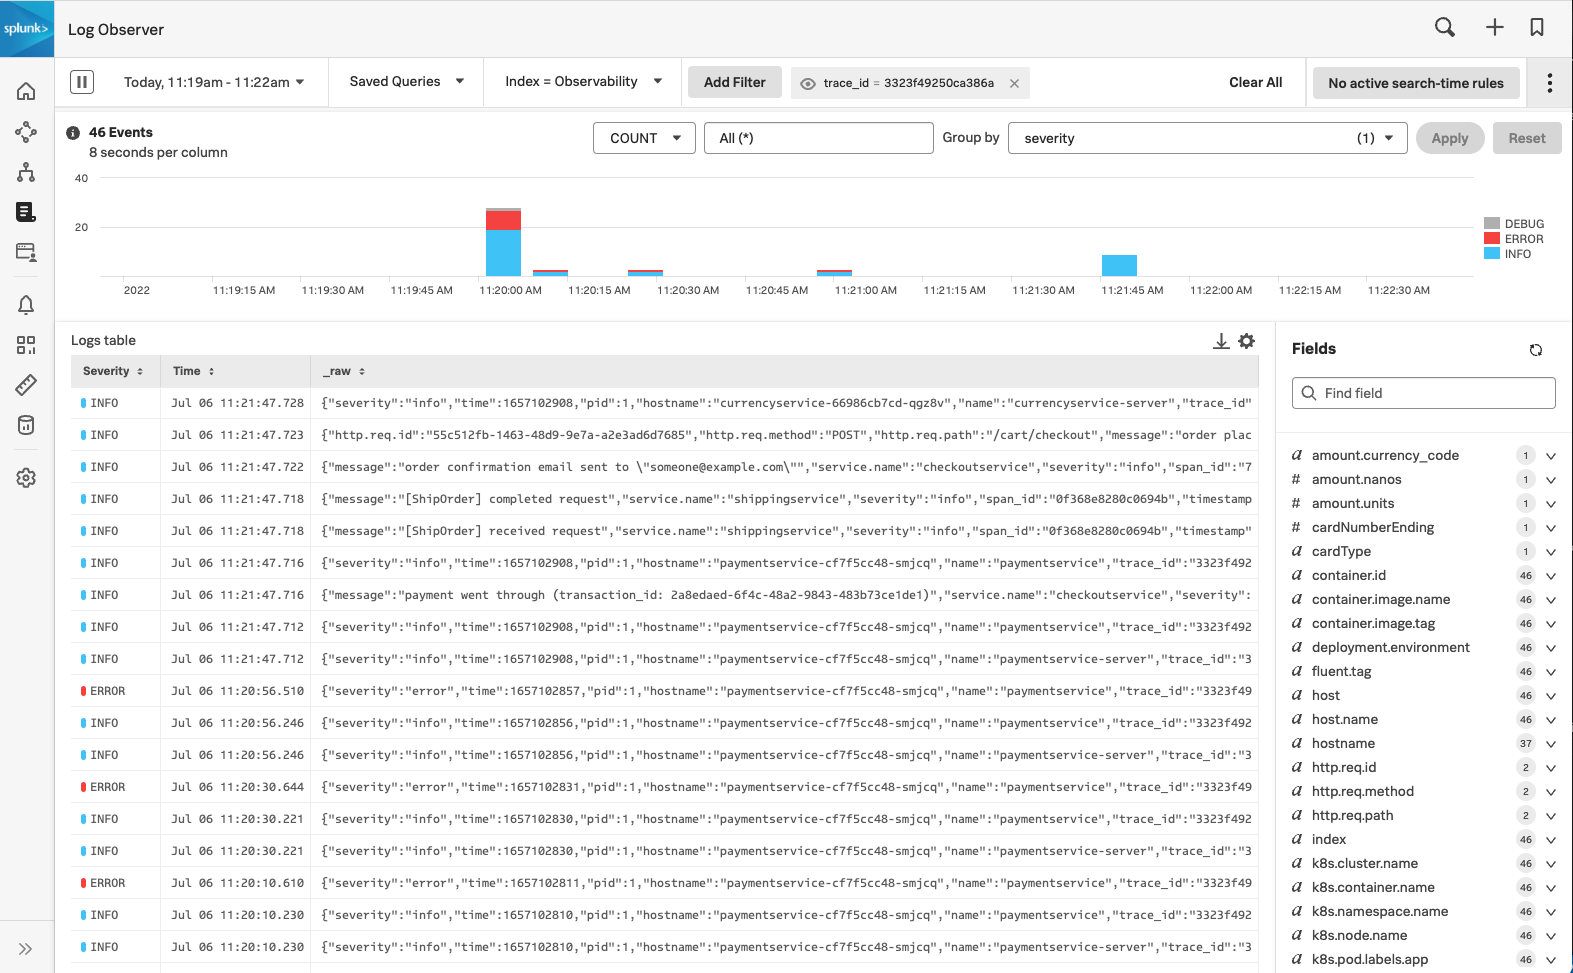
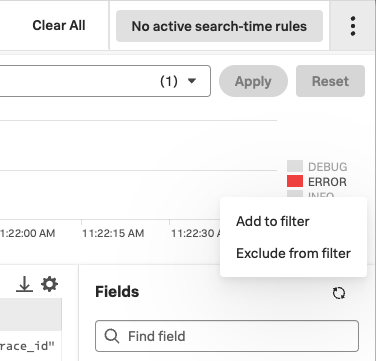
We can use the filter to display only the error logs. Click on ERROR in the top right hand corner, then Add to filter
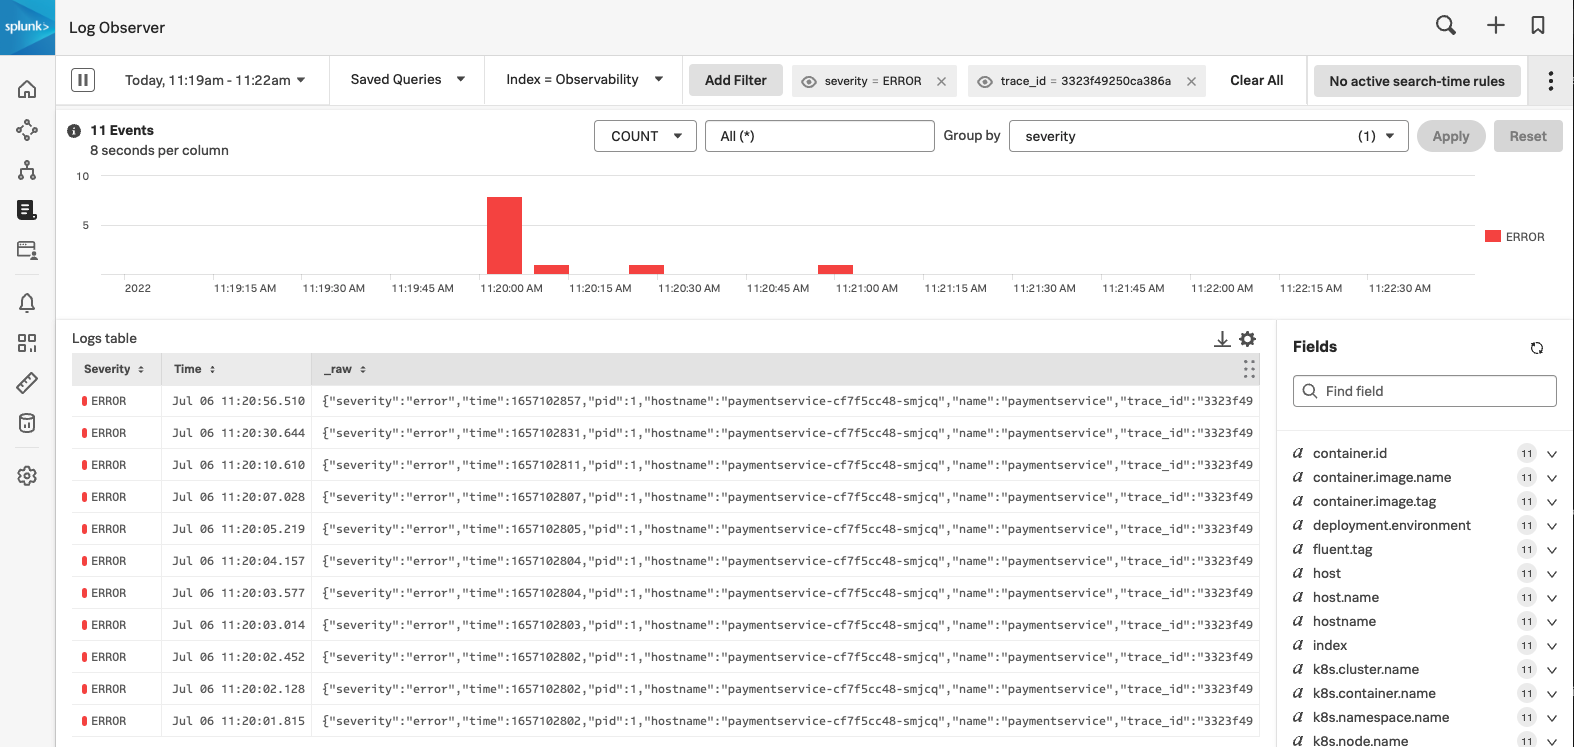
You should now have a shorter list of log entries which have a severity of ERROR
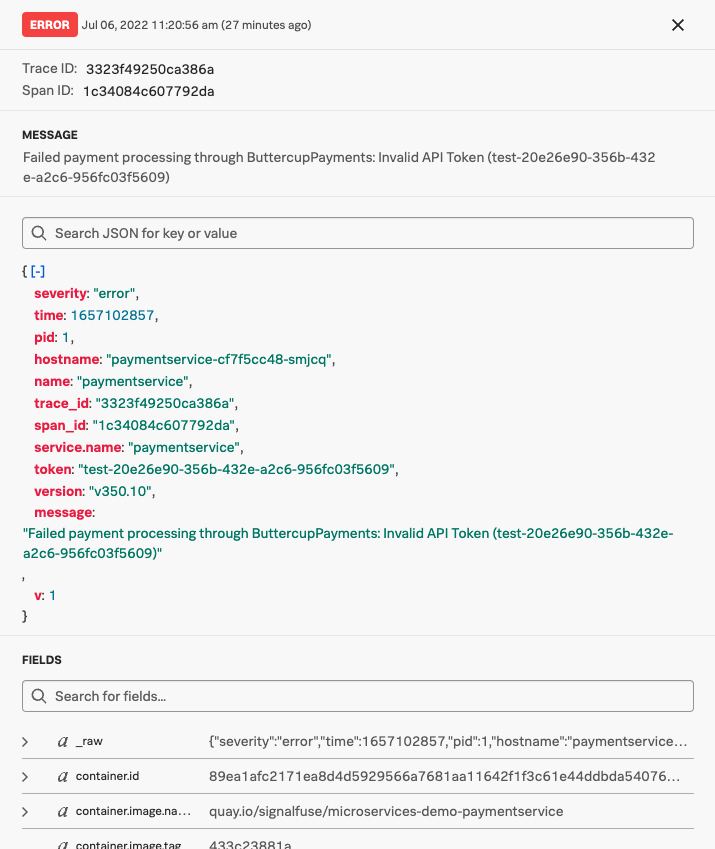
Select any of the entries to view the details. We can now see how the error was caused by the use of an Invalid API Token that our developers have accidentally pushed to production!
Congratulations, you have now completed the APM Workshop.