2. Using Splunk APM
15 minutes- APM Overview - RED metrics
- Using the Service Map
- Introduction to Tag Spotlight
- Example Traces
- Contextual Links to Infra
1. Traces and Spans explained
A trace is a collection of spans that share the same trace ID, representing a unique transaction handled by your application and its constituent services.
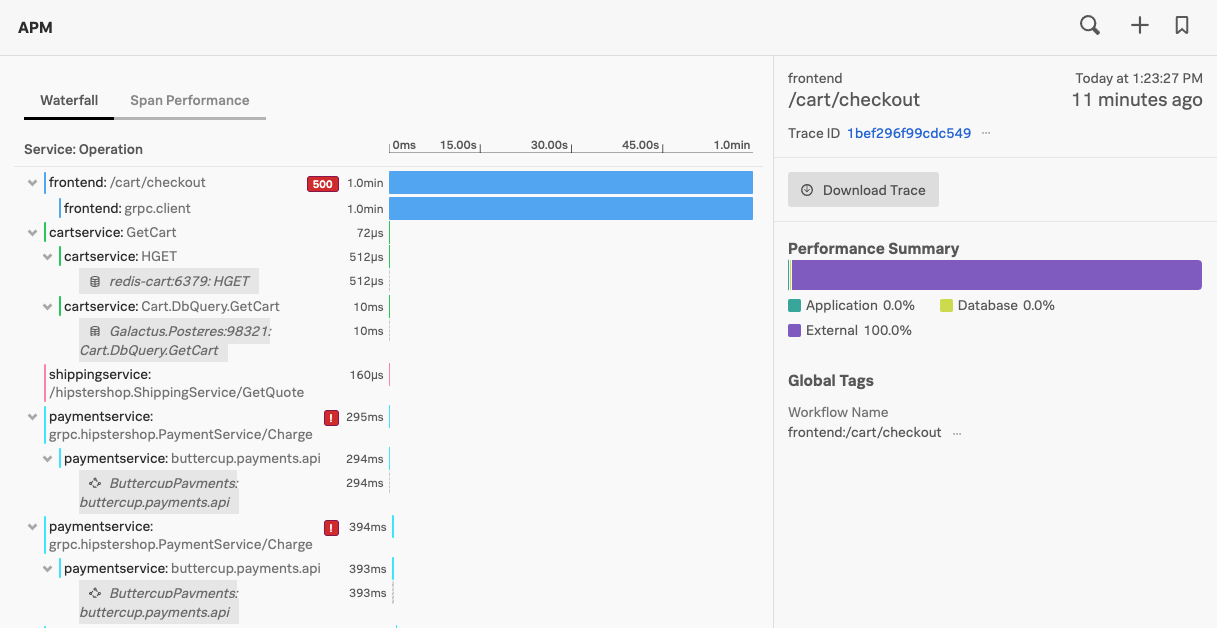
Each span has a name, representing the operation captured by this span, and a service name, representing within which service the operation took place.
Additionally, spans may reference another span as their parent, defining the relationships between the operations captured in the trace that were performed to process that transaction.
Each span contains a lot of information about the method, operation, or block of code that it captures, including:
- the operation name
- the start time of the operation with microsecond precision
- how long the operation took to execute, also with microsecond precision
- the logical name of the service on which the operation took place
- the IP address of the service instance on which the operation took place