2.2 Tag Spotlight
Tag Spotlight
On the right hand side of the screen scroll down on Tag Spotlight, ensure Top Across All Indexed Tags is selected in the dropdown click the full screen button as indicated in the screenshot below.
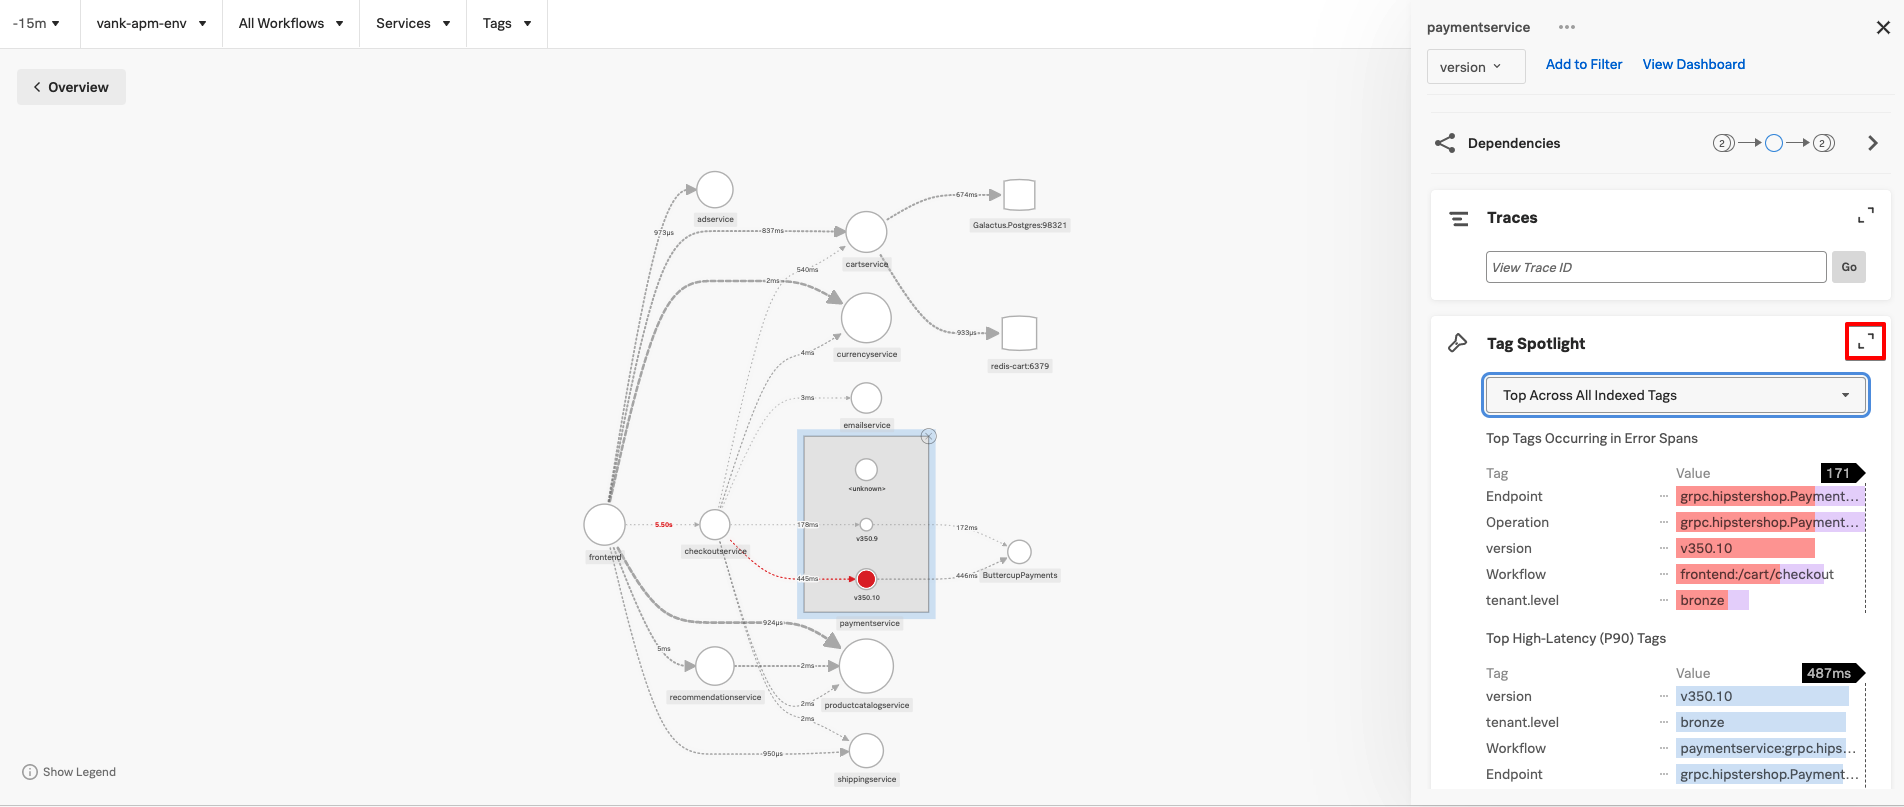
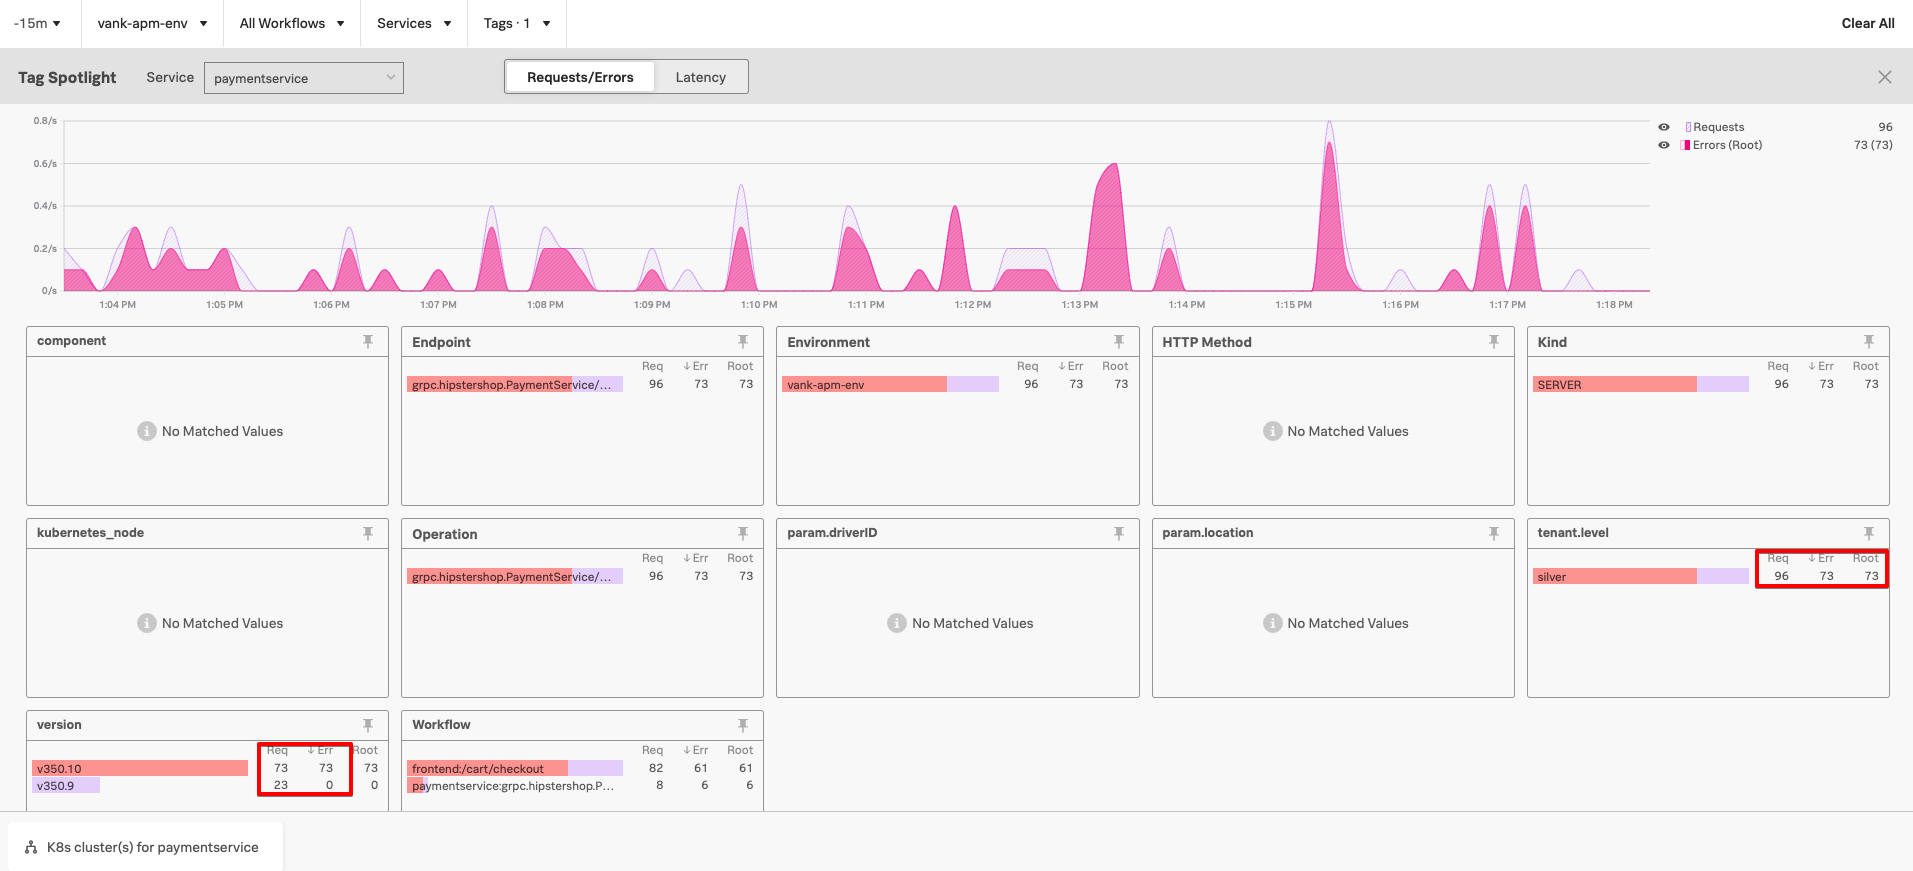
The Tag Spotlight Page will be displayed. From this page you can view the top tags in your application and their corresponding error rates and request rates.
Note that for the version span tag it appears that version 350.10 has a 100% error rate and for our tenant.level span tag it shows that all three tenants (Gold, Silver & Bronze) have errors present.
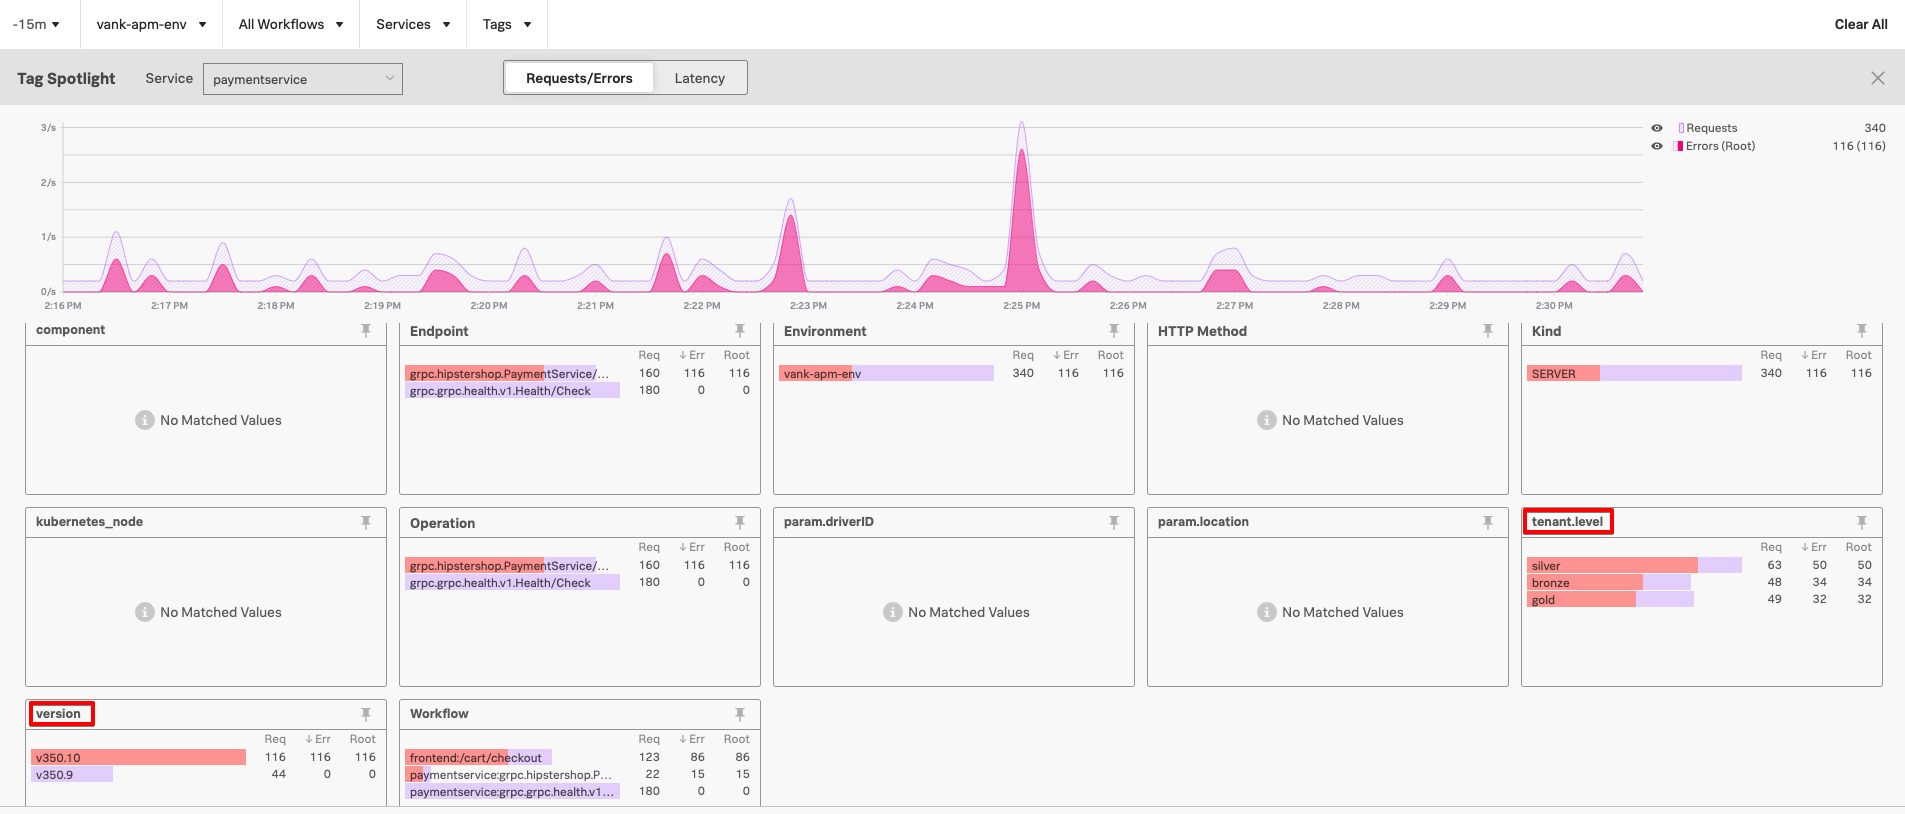
The Tag Spotlight page is interactive and allows you to add a tag as a filter by simply clicking on your desired tag. Click on gold under tenant.level to add it as a filter. Once this is done the page will now only display data with gold as it’s tenant.level.
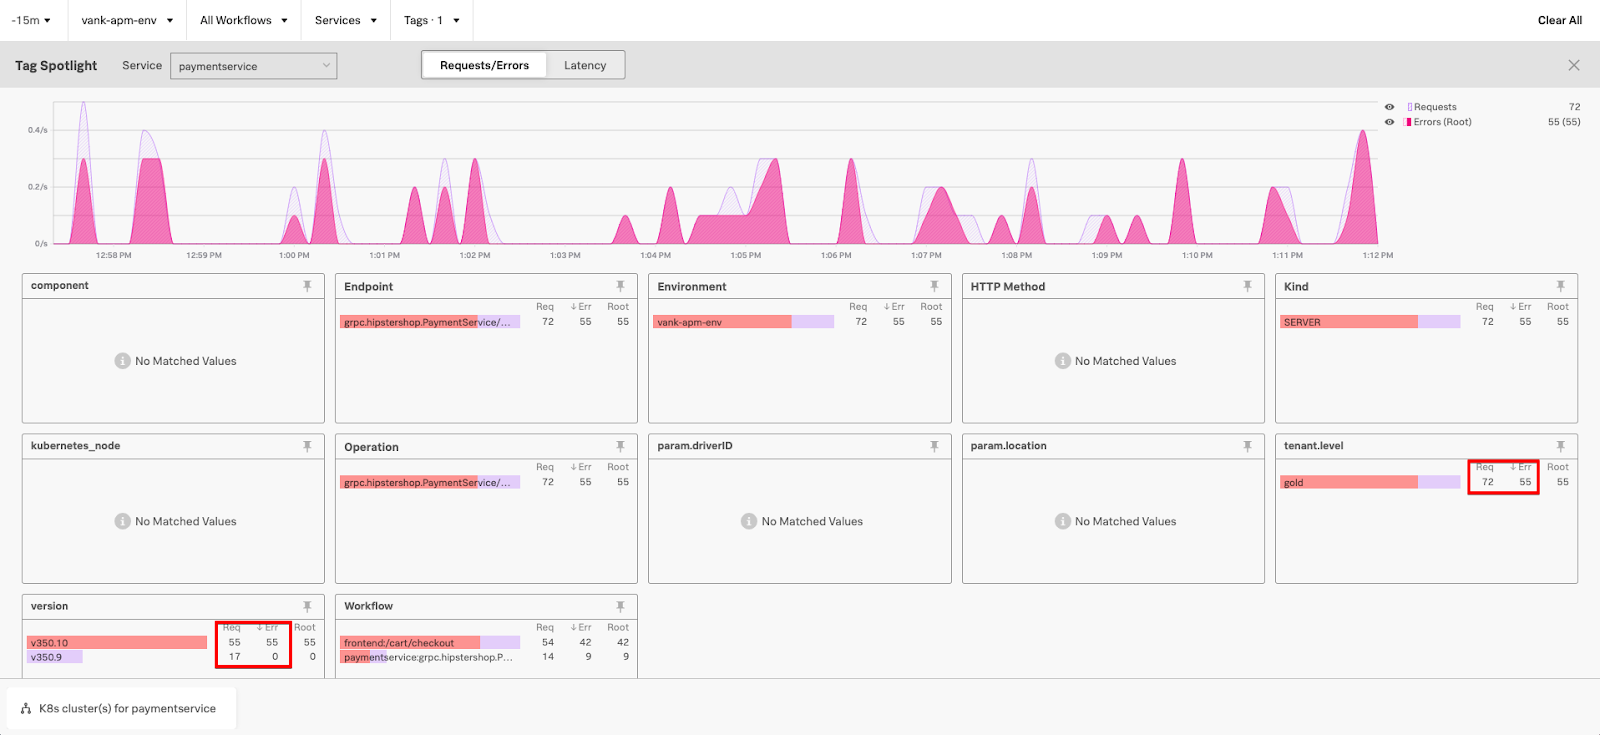
Tag Spotlight is very useful for analysing your data and spotting trends. We can see that for the Gold Tenant that out of the total number of requests, 55 of them are in error (this number will vary in your workshop).
If we correlate this to the version tag, we can see that version 350.10 served 55 requests and version 350.9 served 17 requests. This means that all of the requests that went through version 350.10 ended up in an error state.
In order to test this theory further that all of the requests from paymentservice version 350.10 result in an error, we can change our filter to another tenant by using the tag selector. Change your filter from gold tenant to silver tenant.
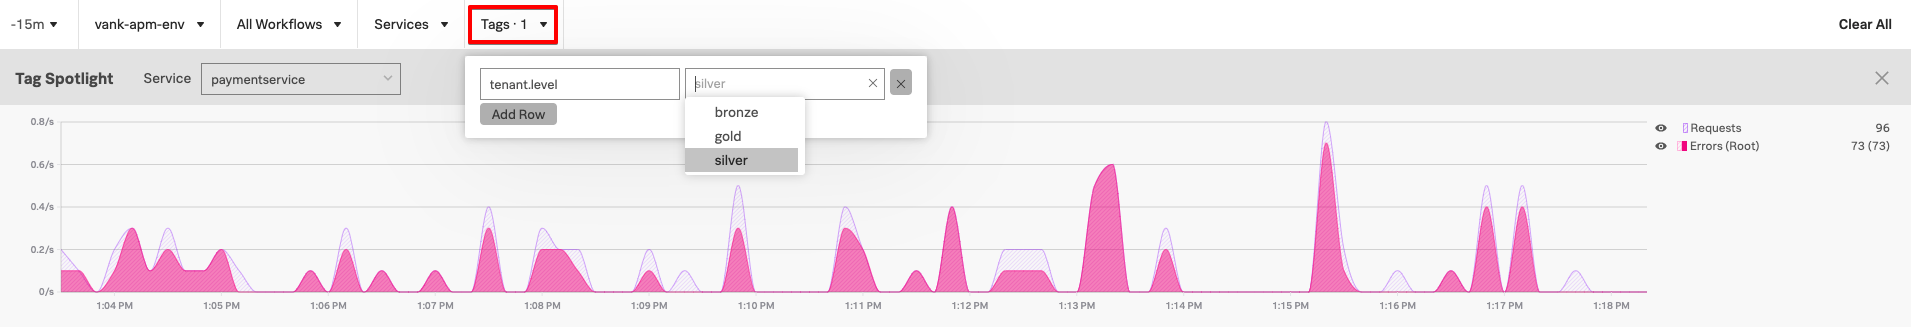
Now we can perform a similar analysis by looking at the number of requests in error for the silver tenant and correlating that with the version number. Note the amount of errors for the silver tenant match the amount of requests for version 350.10.
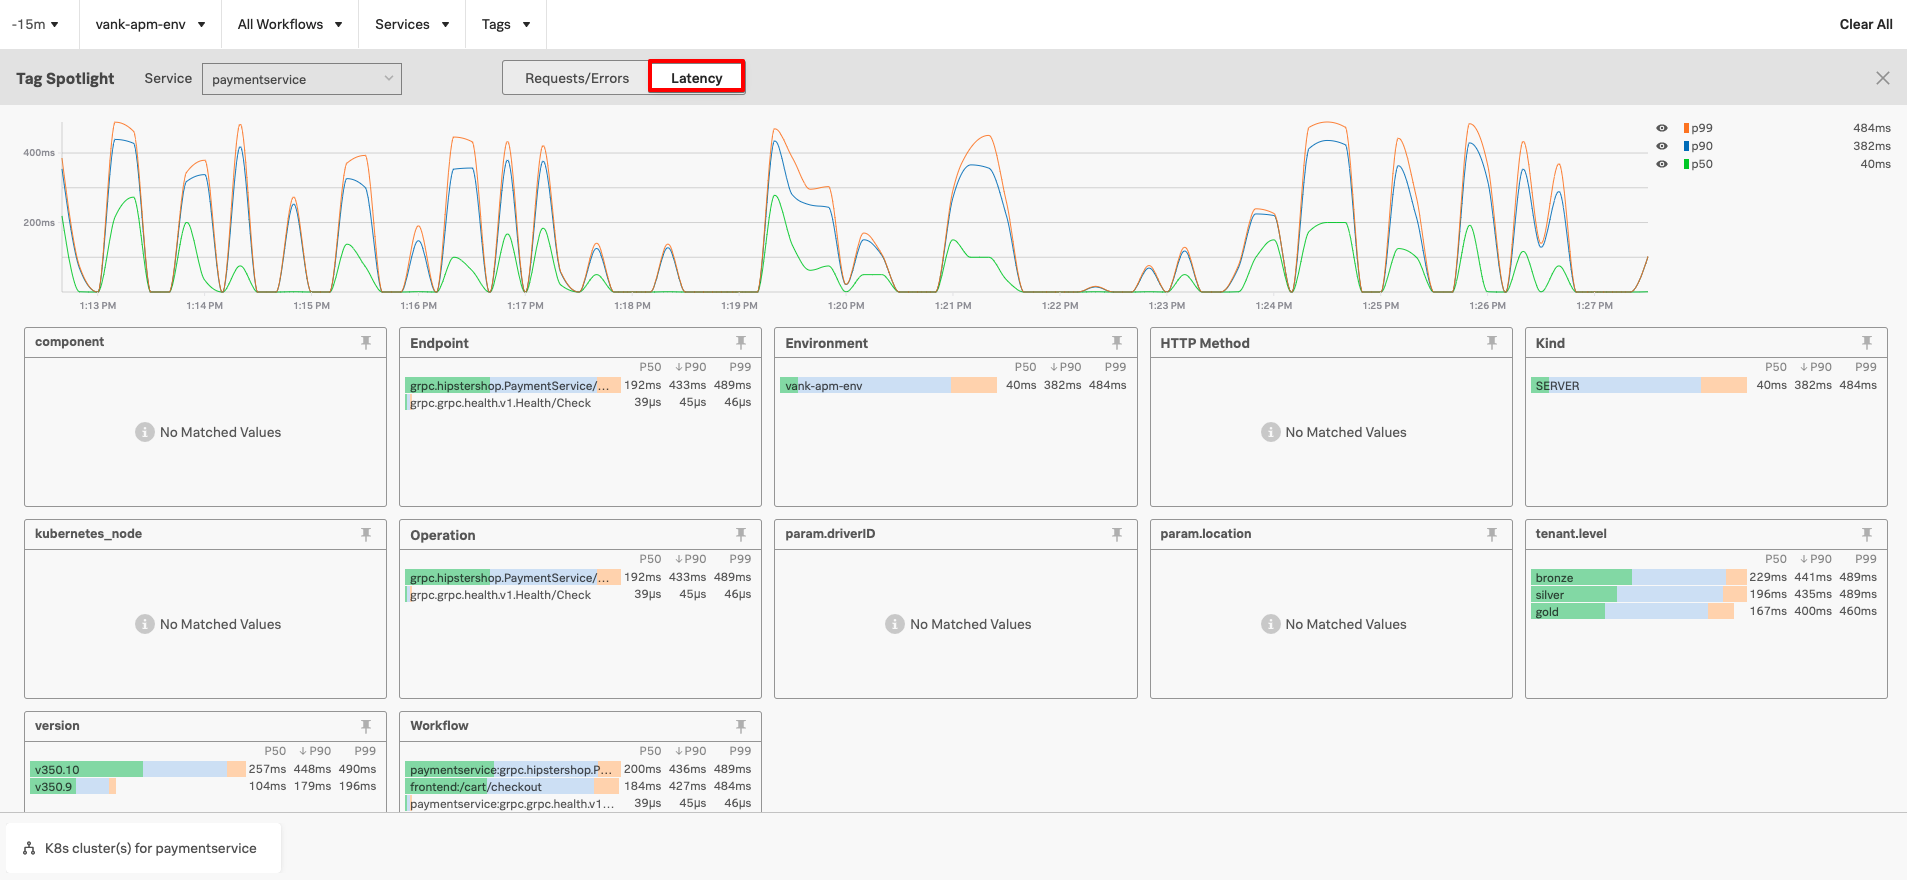
Tag Spotlight not only allows you to look at request and error rates but also at the latency per service. In order to do this just select the latency button and remove your Silver Tenant Tag so that you can see the latency for all of the Payment Service.
Go back to your service map by pressing the X button on the far right underneath Clear All.
Click anywhere on the pink line in the Services by Error Rate graph in the top right hand corner. Once selected you should see a list of example traces. Click on one of the example traces with an initiating operation of frontend: POST /cart/checkout.