Zero Configuration Auto Instrumentation for Java
1. Spring PetClinic Application
The first thing we need to set up APM is… well, an application. For this exercise, we will use the Spring PetClinic application. This is a very popular sample Java application built with the Spring framework (Springboot).
First, clone the PetClinic GitHub repository, and then we will compile, build, package and test the application:
git clone https://github.com/spring-projects/spring-petclinicChange into the spring-petclinic directory (and checkout a specific commit):
cd spring-petclinic && git checkout 276880eStart a MySQL database for PetClinic to use:
docker run -d -e MYSQL_USER=petclinic -e MYSQL_PASSWORD=petclinic -e MYSQL_ROOT_PASSWORD=root -e MYSQL_DATABASE=petclinic -p 3306:3306 docker.io/biarms/mysql:5.7Next, we will start a Docker container running Locust that will generate some simple traffic to the PetClinic application. Locust is a simple load-testing tool that can be used to generate traffic to a web application.
docker run --network="host" -d -p 8090:8090 -v ~/workshop/petclinic:/mnt/locust docker.io/locustio/locust -f /mnt/locust/locustfile.py --headless -u 1 -r 1 -H http://127.0.0.1:8083Next, run the maven command to compile/build/package PetClinic:
./mvnw package -Dmaven.test.skip=trueThis will take a few minutes the first time you run, maven will download a lot of dependencies before it compiles the application. Future builds will be a lot quicker.
Once the build completes, you need to obtain the public IP address of the instance you are running on. You can do this by running the following command:
curl ifconfig.meYou will see an IP address returned, make a note of this as we will need it to validate that the application is running.
We also need to obtain the INSTANCE environment variable value, as this is what is being used as the otel.service.name attribute. You can do this by running the following command:
echo $INSTANCEAlso, make a note of this value as we will need it to filter the data in the UI.
You can now run the application with the following command. Notice that we are passing the mysql profile to the application, this will tell the application to use the MySQL database we started earlier. We are also setting the otel.service.name to a logical service name that will also be used in the UI for filtering:
java \
-Dserver.port=8083 \
-Dotel.service.name=$INSTANCE-petclinic-service \
-jar target/spring-petclinic-*.jar --spring.profiles.active=mysql
You can validate if the application is running by visiting http://<IP_ADDRESS>:8083 (replace <IP_ADDRESS> with the IP address you obtained earlier). You should see the PetClinic application running.
2. AlwaysOn Profiling and Metrics
When we installed the collector we configured it to enable AlwaysOn Profiling and Metrics. This means that the collector will automatically generate CPU and Memory profiles for the application and send them to Splunk Observability Cloud.
When you start the PetClinic application you will see the collector automatically detect the application and instrument it for traces and profiling.
Picked up JAVA_TOOL_OPTIONS: -javaagent:/usr/lib/splunk-instrumentation/splunk-otel-javaagent.jar -Dsplunk.profiler.enabled=true -Dsplunk.profiler.memory.enabled=true
OpenJDK 64-Bit Server VM warning: Sharing is only supported for boot loader classes because bootstrap classpath has been appended
[otel.javaagent 2023-06-26 13:32:04:661 +0100] [main] INFO io.opentelemetry.javaagent.tooling.VersionLogger - opentelemetry-javaagent - version: splunk-1.25.0-otel-1.27.0
[otel.javaagent 2023-06-26 13:32:05:294 +0100] [main] INFO com.splunk.javaagent.shaded.io.micrometer.core.instrument.push.PushMeterRegistry - publishing metrics for SignalFxMeterRegistry every 30s
[otel.javaagent 2023-06-26 13:32:07:043 +0100] [main] INFO com.splunk.opentelemetry.profiler.ConfigurationLogger - -----------------------
[otel.javaagent 2023-06-26 13:32:07:044 +0100] [main] INFO com.splunk.opentelemetry.profiler.ConfigurationLogger - Profiler configuration:
[otel.javaagent 2023-06-26 13:32:07:047 +0100] [main] INFO com.splunk.opentelemetry.profiler.ConfigurationLogger -                  splunk.profiler.enabled : true
[otel.javaagent 2023-06-26 13:32:07:048 +0100] [main] INFO com.splunk.opentelemetry.profiler.ConfigurationLogger -                splunk.profiler.directory : /tmp
[otel.javaagent 2023-06-26 13:32:07:049 +0100] [main] INFO com.splunk.opentelemetry.profiler.ConfigurationLogger -       splunk.profiler.recording.duration : 20s
[otel.javaagent 2023-06-26 13:32:07:050 +0100] [main] INFO com.splunk.opentelemetry.profiler.ConfigurationLogger -               splunk.profiler.keep-files : false
[otel.javaagent 2023-06-26 13:32:07:051 +0100] [main] INFO com.splunk.opentelemetry.profiler.ConfigurationLogger -            splunk.profiler.logs-endpoint : null
[otel.javaagent 2023-06-26 13:32:07:053 +0100] [main] INFO com.splunk.opentelemetry.profiler.ConfigurationLogger -              otel.exporter.otlp.endpoint : null
[otel.javaagent 2023-06-26 13:32:07:054 +0100] [main] INFO com.splunk.opentelemetry.profiler.ConfigurationLogger -           splunk.profiler.memory.enabled : true
[otel.javaagent 2023-06-26 13:32:07:055 +0100] [main] INFO com.splunk.opentelemetry.profiler.ConfigurationLogger -             splunk.profiler.tlab.enabled : true
[otel.javaagent 2023-06-26 13:32:07:056 +0100] [main] INFO com.splunk.opentelemetry.profiler.ConfigurationLogger -        splunk.profiler.memory.event.rate : 150/s
[otel.javaagent 2023-06-26 13:32:07:057 +0100] [main] INFO com.splunk.opentelemetry.profiler.ConfigurationLogger -      splunk.profiler.call.stack.interval : PT10S
[otel.javaagent 2023-06-26 13:32:07:058 +0100] [main] INFO com.splunk.opentelemetry.profiler.ConfigurationLogger -  splunk.profiler.include.internal.stacks : false
[otel.javaagent 2023-06-26 13:32:07:059 +0100] [main] INFO com.splunk.opentelemetry.profiler.ConfigurationLogger -      splunk.profiler.tracing.stacks.only : false
[otel.javaagent 2023-06-26 13:32:07:059 +0100] [main] INFO com.splunk.opentelemetry.profiler.ConfigurationLogger - -----------------------
[otel.javaagent 2023-06-26 13:32:07:060 +0100] [main] INFO com.splunk.opentelemetry.profiler.JfrActivator - Profiler is active.
3. Review Profiling Data Collection
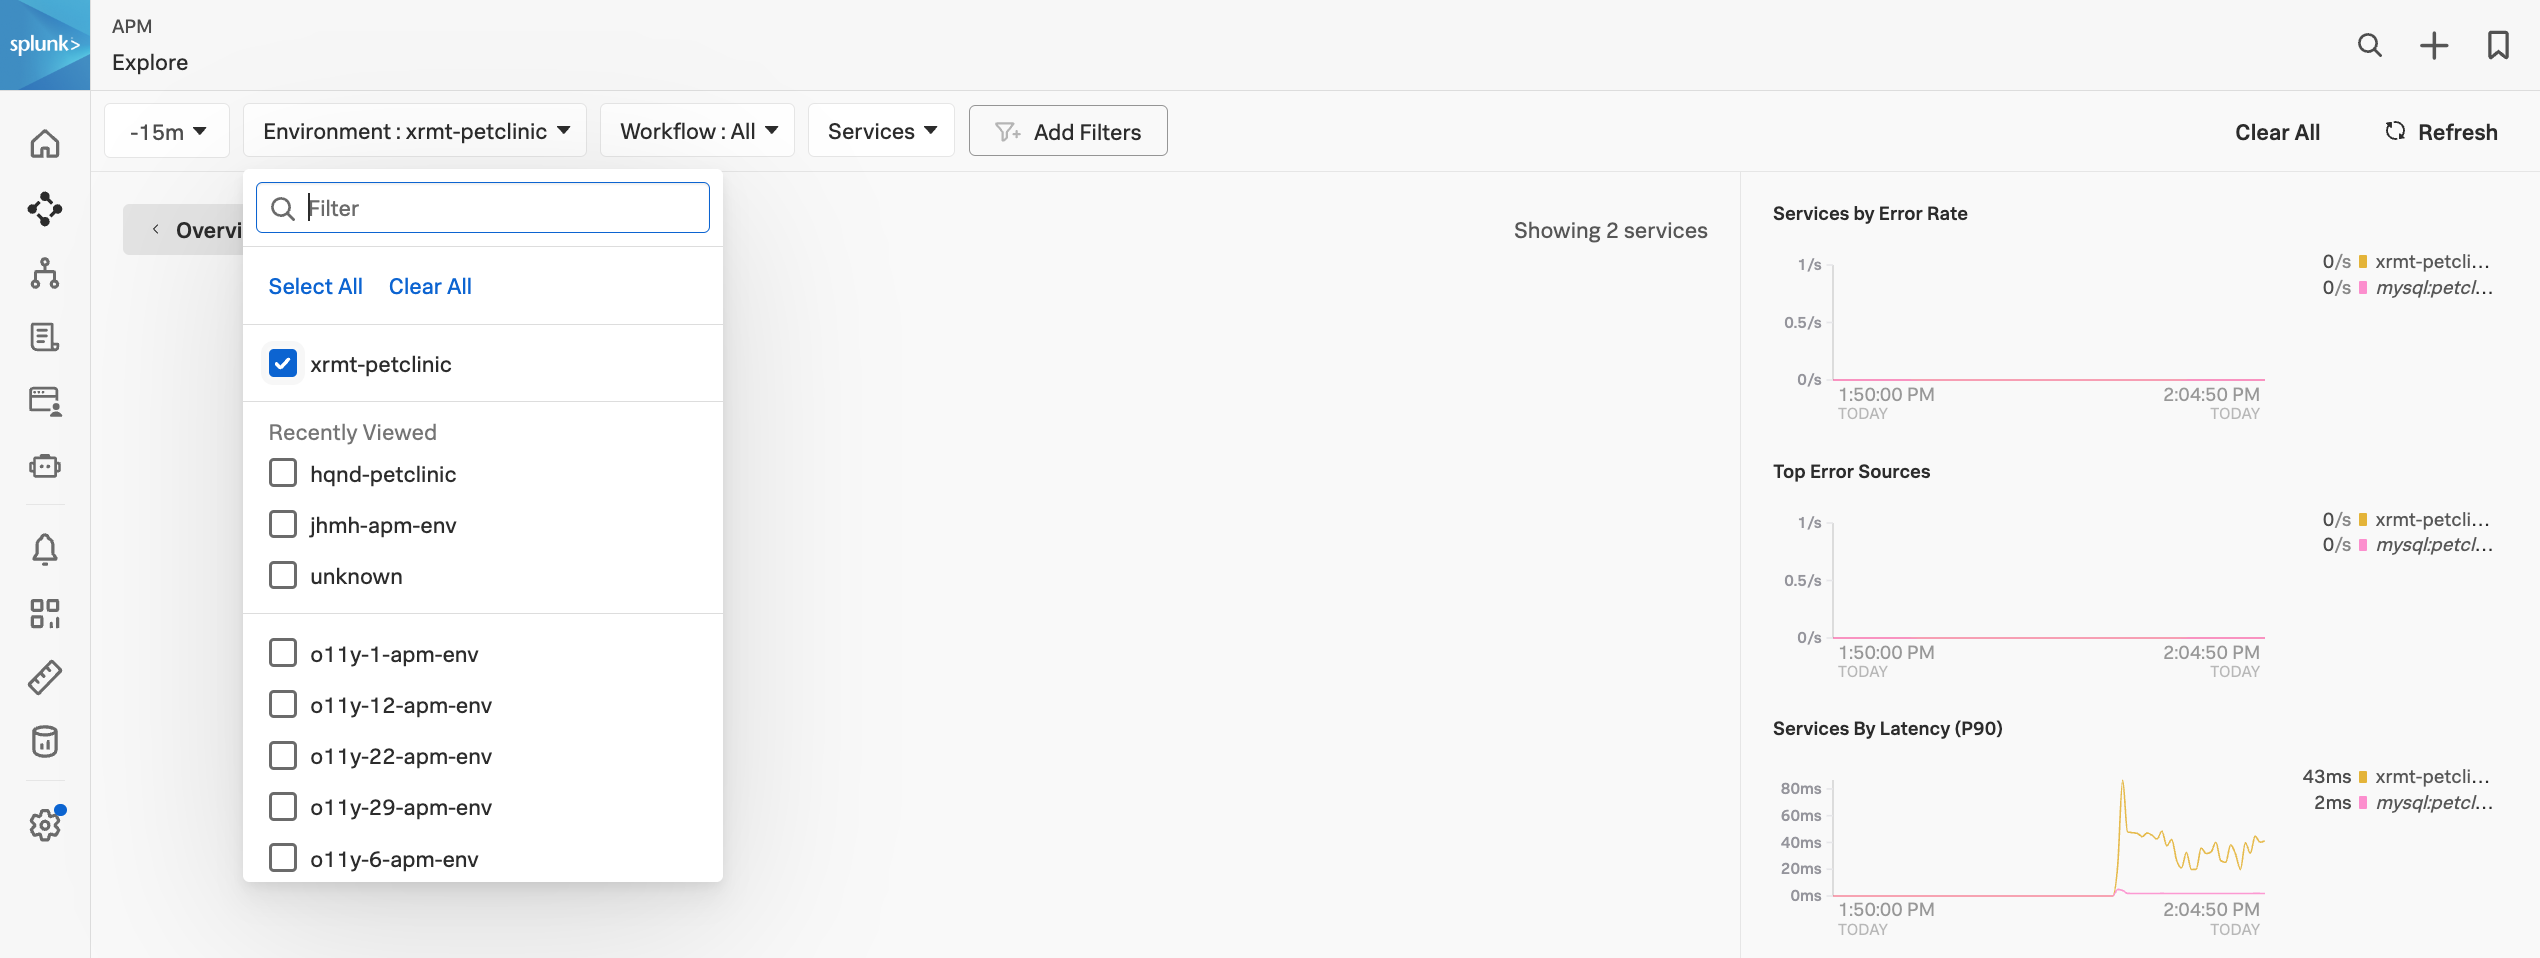
You can now visit the Splunk APM UI and examine the application components, traces, profiling, DB Query performance and metrics. From the left-hand menu APM → Explore, click the environment dropdown and select your environment e.g. <INSTANCE>-petclinic (where<INSTANCE> is replaced with the value you noted down earlier).
Once your validation is complete you can stop the application by pressing Ctrl-c.
4. Adding Resource Attributes to Spans
Resource attributes can be added to every reported span. For example version=0.314. A comma-separated list of resource attributes can also be defined e.g. key1=val1,key2=val2.
Let’s launch the PetClinic again using new resource attributes. Note, that adding resource attributes to the run command will override what was defined when we installed the collector. Let’s add two new resource attributes deployment.environment=$INSTANCE-petclinic-env,version=0.314:
java \
-Dserver.port=8083 \
-Dotel.service.name=$INSTANCE-petclinic-service \
-Dotel.resource.attributes=deployment.environment=$INSTANCE-petclinic-env,version=0.314 \
-jar target/spring-petclinic-*.jar --spring.profiles.active=mysql
Back in the Splunk APM UI we can drill down on a recent trace and see the new version attribute in a span.