4. Log Observer
1. Introduction
For the Splunk Log Observer component, we will configure the Spring PetClinic application to write logs to a file and configure the Splunk OpenTelemetry Collector to read (tail) that log file and send the logs to Splunk Cloud.
2. OpenTelemetry Filelog Configuration
We need to configure the Splunk OpenTelemetry Collector to tail the Spring PetClinic log file and send the log data to Splunk Cloud.
The Splunk OpenTelemetry Collector uses Fluentd by default but we will change the configuration to use the OpenTelemetry Filelog Receiver to consume the logs. We will need to edit the collectors’ configuration file:
sudo vi /etc/otel/collector/agent_config.yamlUnder the receivers: section create the Filelog Receiver (make sure to indent correctly):
receivers:
  filelog:
    include: [/tmp/spring-petclinic.log]
Then under the service: section, find the logs: pipeline, replace fluentforward withfilelog (again, make sure to indent correctly):
    logs:
      receivers: [filelog, otlp]
Save the file and exit the editor. Next, we need to validate that the HEC Token and HEC URL are configured for the collector to use. We will inspect the /etc/otel/collector/splunk-otel-collector.conf file:
sudo cat /etc/otel/collector/splunk-otel-collector.confMake sure SPLUNK_HEC_URL and SPLUNK_HEC_TOKEN have values set. If they are not set, please reach out to your instructor. With the configuration change complete and validated, we can now restart the collector:
sudo systemctl restart splunk-otel-collector3. Logback Settings
The Spring PetClinic application can be configured to use several different Java logging libraries. In this scenario, we are going to use logback. We just need to create a file named logback.xml in the configuration folder:
vi ~/spring-petclinic/src/main/resources/logback.xmlCopy and paste the following XML content:
<?xml version="1.0" encoding="UTF-8"?>
<!DOCTYPE xml>
<configuration scan="true" scanPeriod="30 seconds">
  <contextListener class="ch.qos.logback.classic.jul.LevelChangePropagator">
      <resetJUL>true</resetJUL>
  </contextListener>
  <logger name="org.springframework.samples.petclinic" level="info"/>
  <appender name="file" class="ch.qos.logback.core.rolling.RollingFileAppender">
    <file>/tmp/spring-petclinic.log</file>
    <rollingPolicy class="ch.qos.logback.core.rolling.TimeBasedRollingPolicy">
      <fileNamePattern>springLogFile.%d{yyyy-MM-dd}.log</fileNamePattern>
      <maxHistory>5</maxHistory>
      <totalSizeCap>1GB</totalSizeCap>
    </rollingPolicy>
    <encoder>
      <pattern>
        %d{yyyy-MM-dd HH:mm:ss} - %logger{36} - %msg trace_id=%X{trace_id} span_id=%X{span_id} trace_flags=%X{trace_flags} %n service.name=%property{otel.resource.service.name}, deployment.environment=%property{otel.resource.deployment.environment}: %m%n
      </pattern>
    </encoder>
  </appender>
  <root level="info">
    <appender-ref ref="file" />
  </root>
</configuration>
Now we need to rebuild the application and run it again:
./mvnw package -Dmaven.test.skip=trueOnce the rebuild has been completed we can then run the application again:
java \
-Dserver.port=8083 \
-Dotel.service.name=$INSTANCE-petclinic-service \
-Dotel.resource.attributes=deployment.environment=$INSTANCE-petclinic-env,version=0.314 \
-jar target/spring-petclinic-*.jar --spring.profiles.active=mysql
4. View Logs
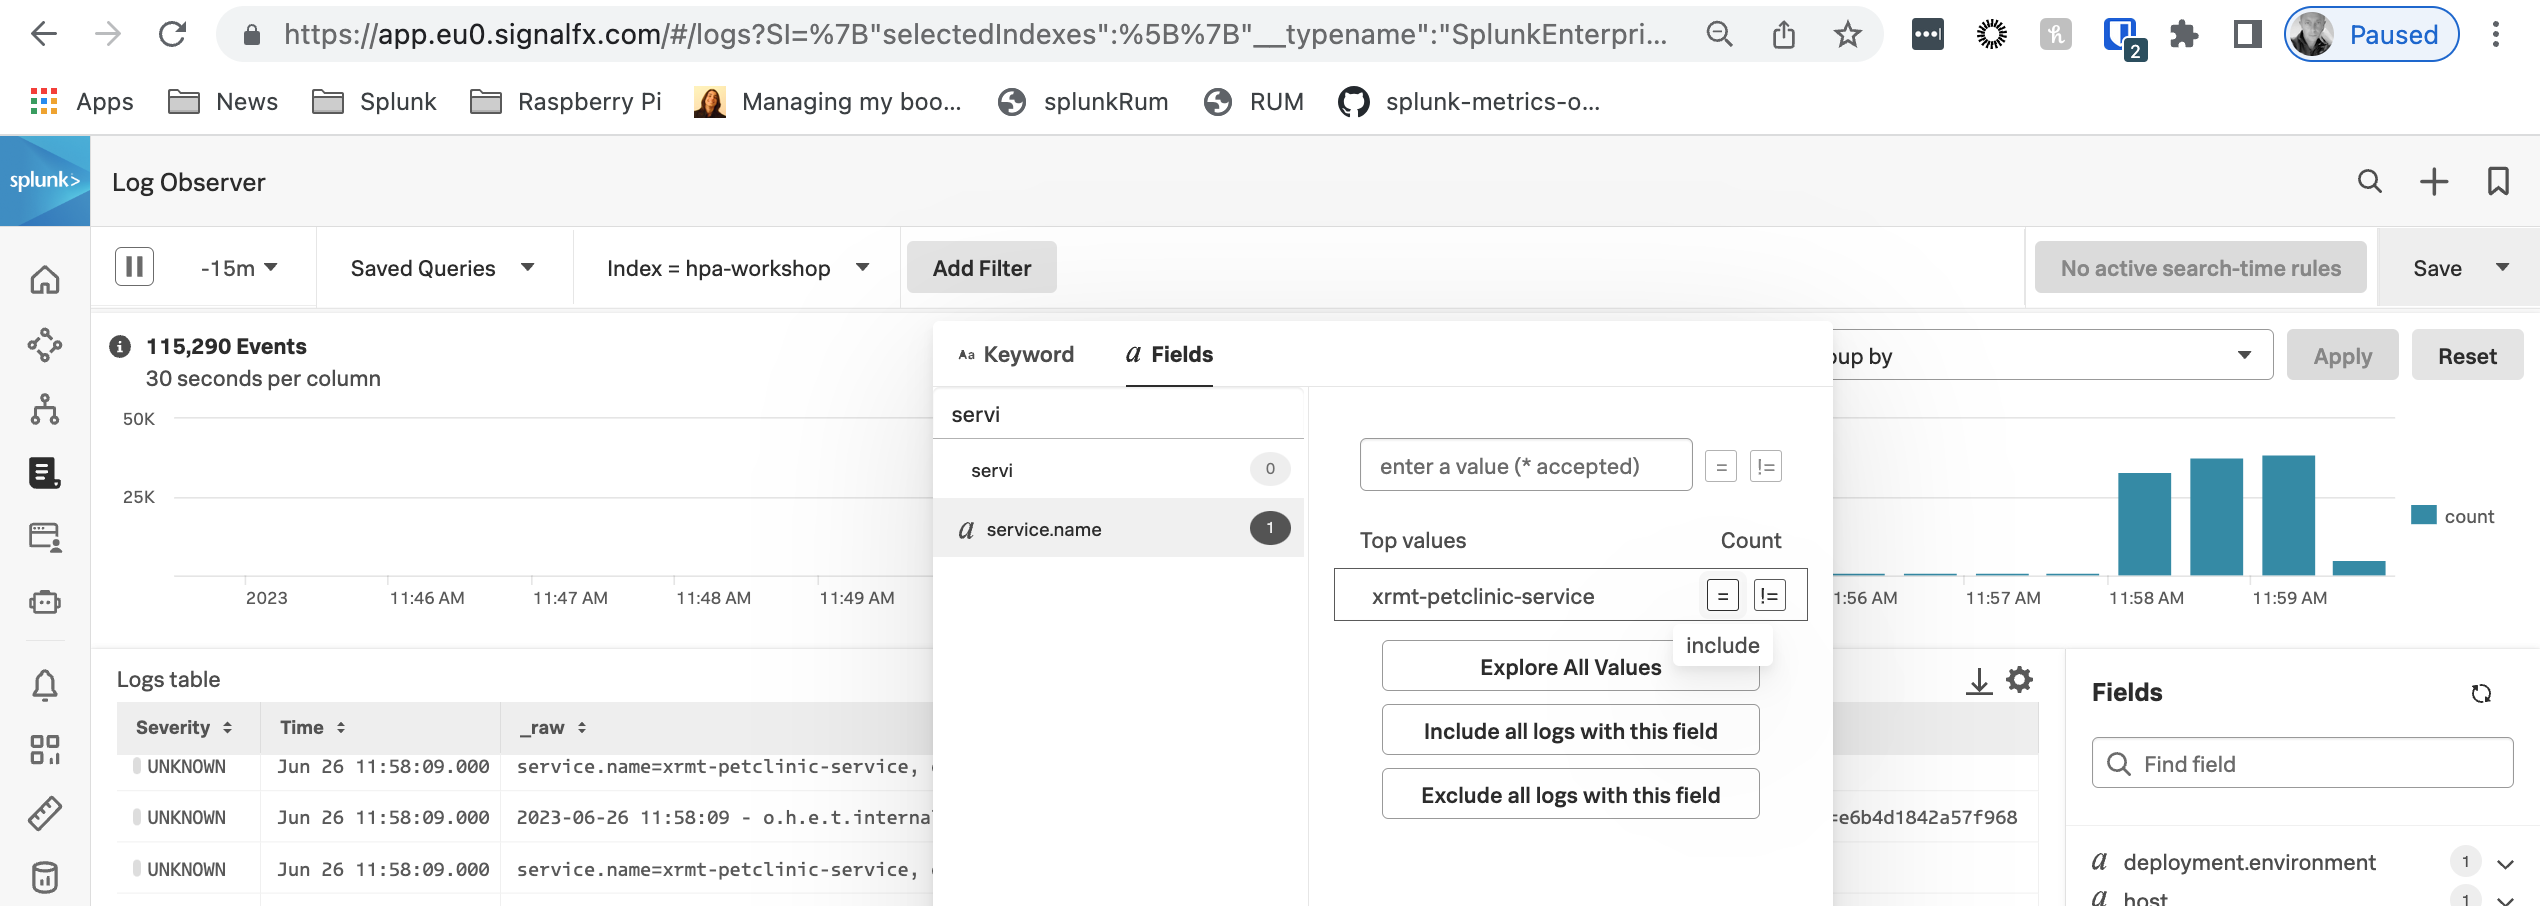
From the left-hand menu click on Log Observer and ensure Index is set to splunk4rookies-workshop.
Next, click Add Filter search for the field service_name select the value <INSTANCE>-petclinic-service and click = (include). You should now see only the log messages from your PetClinic application.
4. Summary
This is the end of the workshop and we have certainly covered a lot of ground. At this point, you should have metrics, traces (APM & RUM), logs, database query performance and code profiling being reported into Splunk Observability Cloud.
Congratulations!