Installing the OpenTelemetry Collector
1. Introduction
If you have completed any other Observability workshops, please ensure you delete the collector running in Kubernetes before continuing. This can be done by running the following command:
helm delete splunk-otel-collector2. Confirm environment variables
To ensure your instance is configured correctly, we need to confirm that the required environment variables for this workshop are set correctly. In your terminal run the following command:
envIn the output check the following environment variables are present and have values set:
ACCESS_TOKEN
REALM
RUM_TOKEN
HEC_TOKEN
HEC_URL
For this workshop, all of the above are required. If any are missing, please contact your instructor.
3. Install the OpenTelemetry Collector
We can then go ahead and install the Collector. Some additional parameters are passed to the helm install command, they are:
--set="operator.enabled=true"- Enabled the Splunk OpenTelemetry Collector Operator for Kubernetes.--set="certmanager.enabled=true"- The cert-manager adds certificates and certificate issuers as resource types in Kubernetes clusters and simplifies the process of obtaining, renewing and using those certificates.--set="splunkObservability.profilingEnabled=true"- Enables CPU/Memory profiling for supported languages.
helm repo add splunk-otel-collector-chart https://signalfx.github.io/splunk-otel-collector-chart && helm repo updatehelm install splunk-otel-collector \
--set="operator.enabled=true", \
--set="certmanager.enabled=true", \
--set="splunkObservability.realm=$REALM" \
--set="splunkObservability.accessToken=$ACCESS_TOKEN" \
--set="clusterName=$INSTANCE-k3s-cluster" \
--set="splunkObservability.logsEnabled=false" \
--set="logsEngine=otel" \
--set="splunkObservability.profilingEnabled=true" \
--set="splunkObservability.infrastructureMonitoringEventsEnabled=true" \
--set="environment=$INSTANCE-workshop" \
--set="splunkPlatform.endpoint=$HEC_URL" \
--set="splunkPlatform.token=$HEC_TOKEN" \
--set="splunkPlatform.index=splunk4rookies-workshop" \
splunk-otel-collector-chart/splunk-otel-collector \
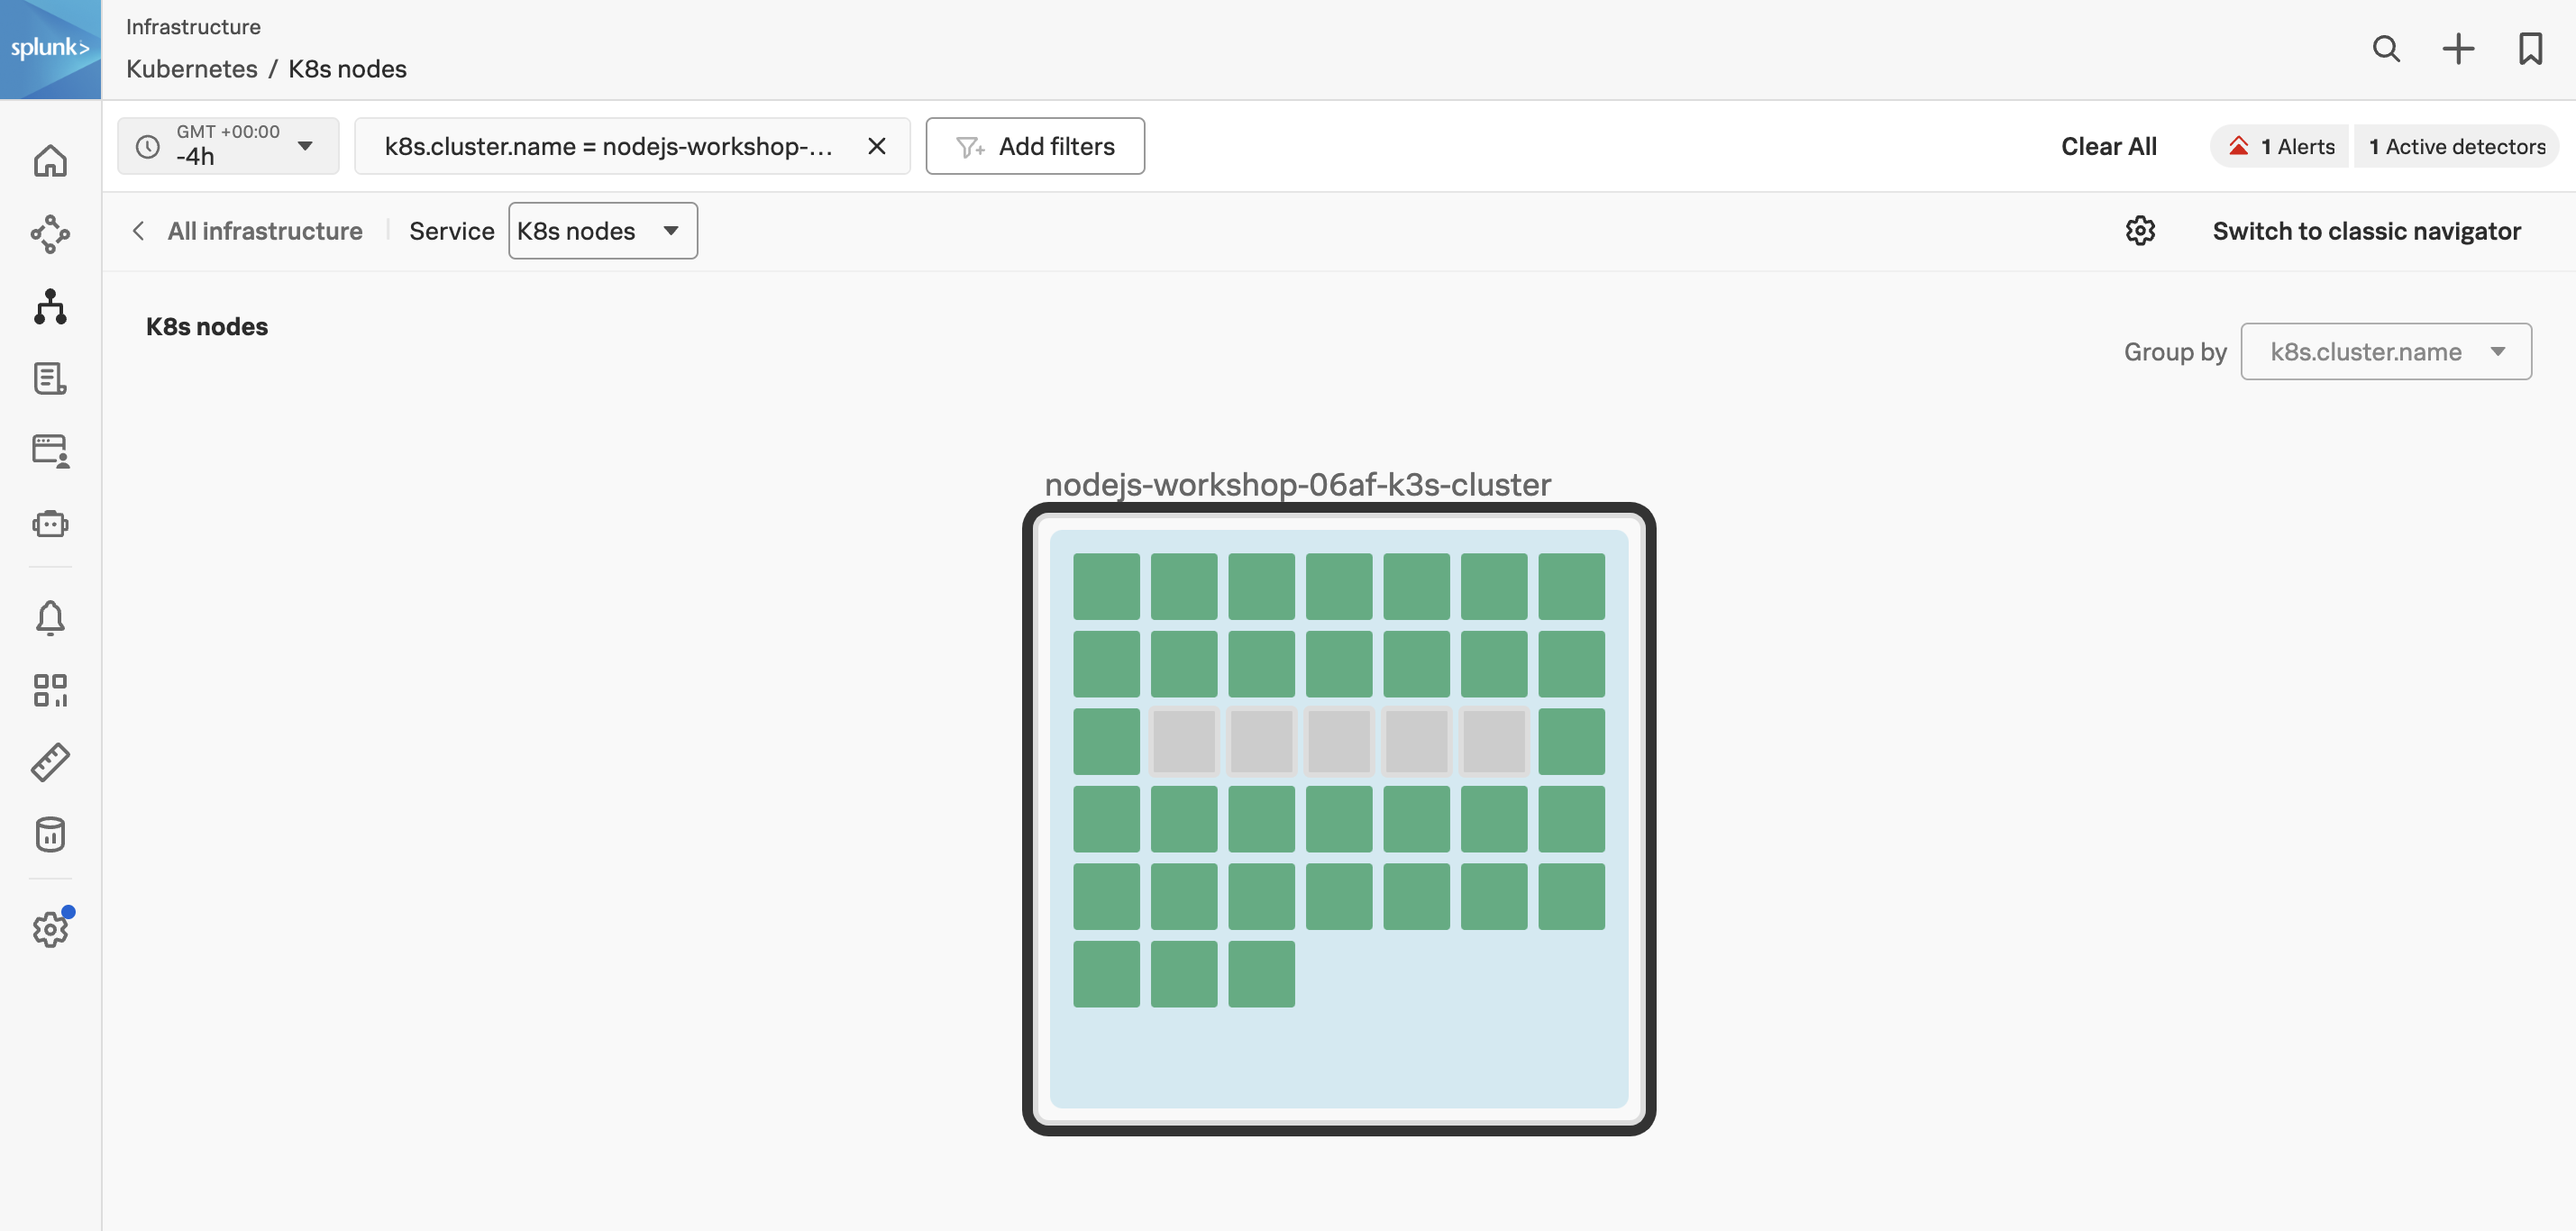
-f ~/workshop/k3s/otel-collector.yamlOnce the installation is completed, you can navigate to the Kubernetes Navigator to see the data from your host.
Click on Add filters select k8s.cluster.name and select the cluster of your workshop instance.
You can determine your instance name from the command prompt in your terminal session:
echo $INSTANCEOnce you see data flowing for your host, we are then ready to get started with the APM component.