Zero Configuration - Frontend Service
1. Patching the Frontend service
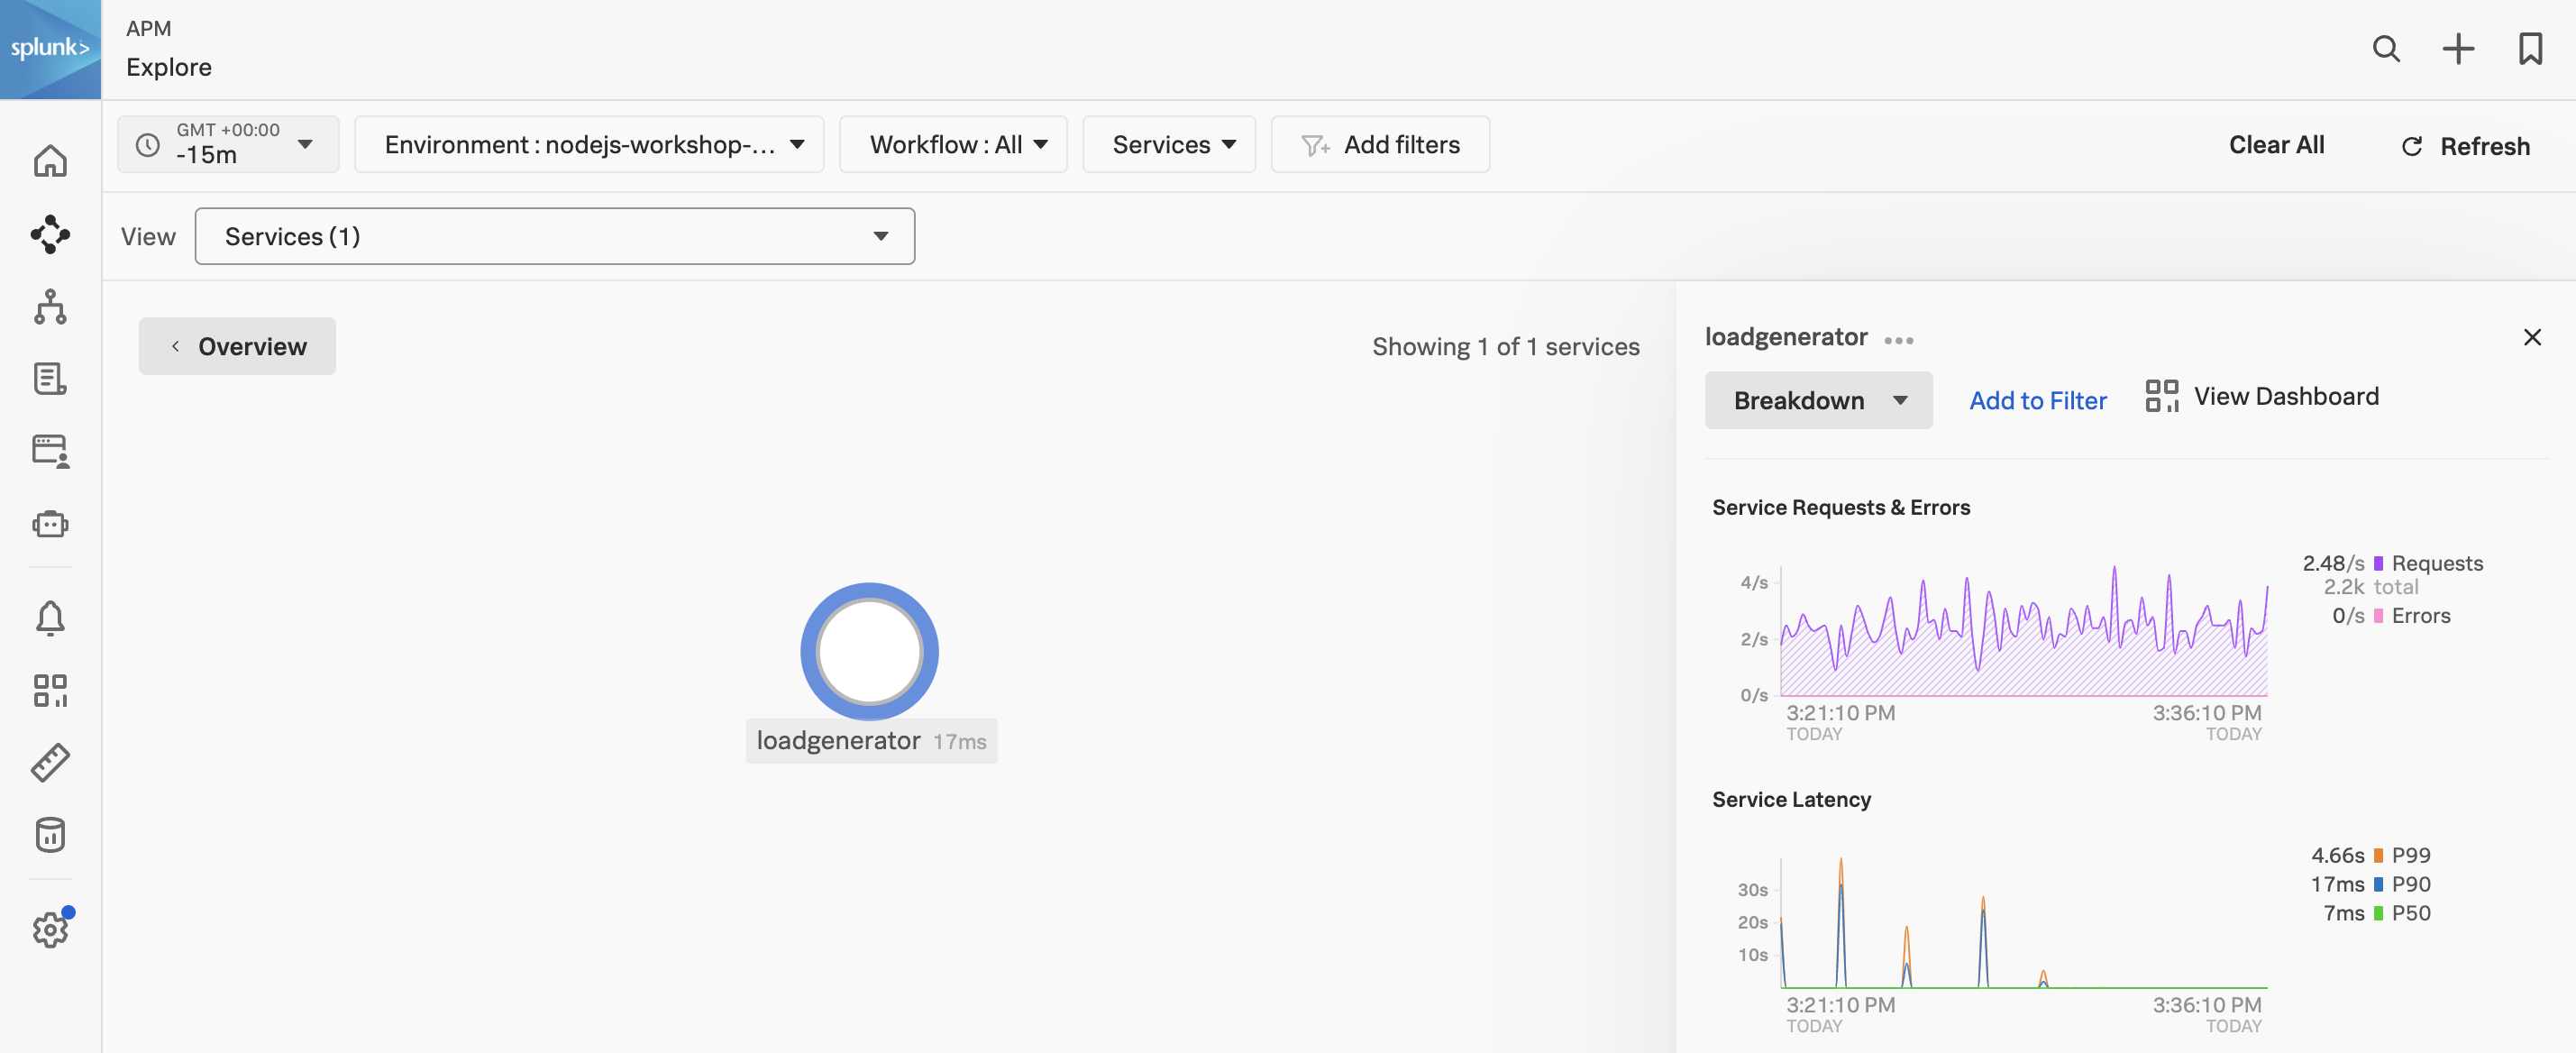
First, confirm that you can see your environment in APM. There should be a service called loadgenerator displayed in the Service map.
Next, we will patch the frontend deployment with an annotation to inject the NodeJS auto instrumentation. This will allow us to see the frontend service in APM. Note, that at this point we have not edited any code.
kubectl patch deployment opentelemetry-demo-frontend -n otel-demo -p '{"spec": {"template":{"metadata":{"annotations":{"instrumentation.opentelemetry.io/inject-nodejs":"default/splunk-otel-collector"}}}} }'- This will cause the
opentelemetry-demo-frontendpod to restart. - The annotation value
default/splunk-otel-collectorrefers to the instrumentation configuration namedsplunk-otel-collectorin thedefaultnamespace. - If the chart is not installed in the
defaultnamespace, modify the annotation value to be{chart_namespace}/splunk-otel-collector.
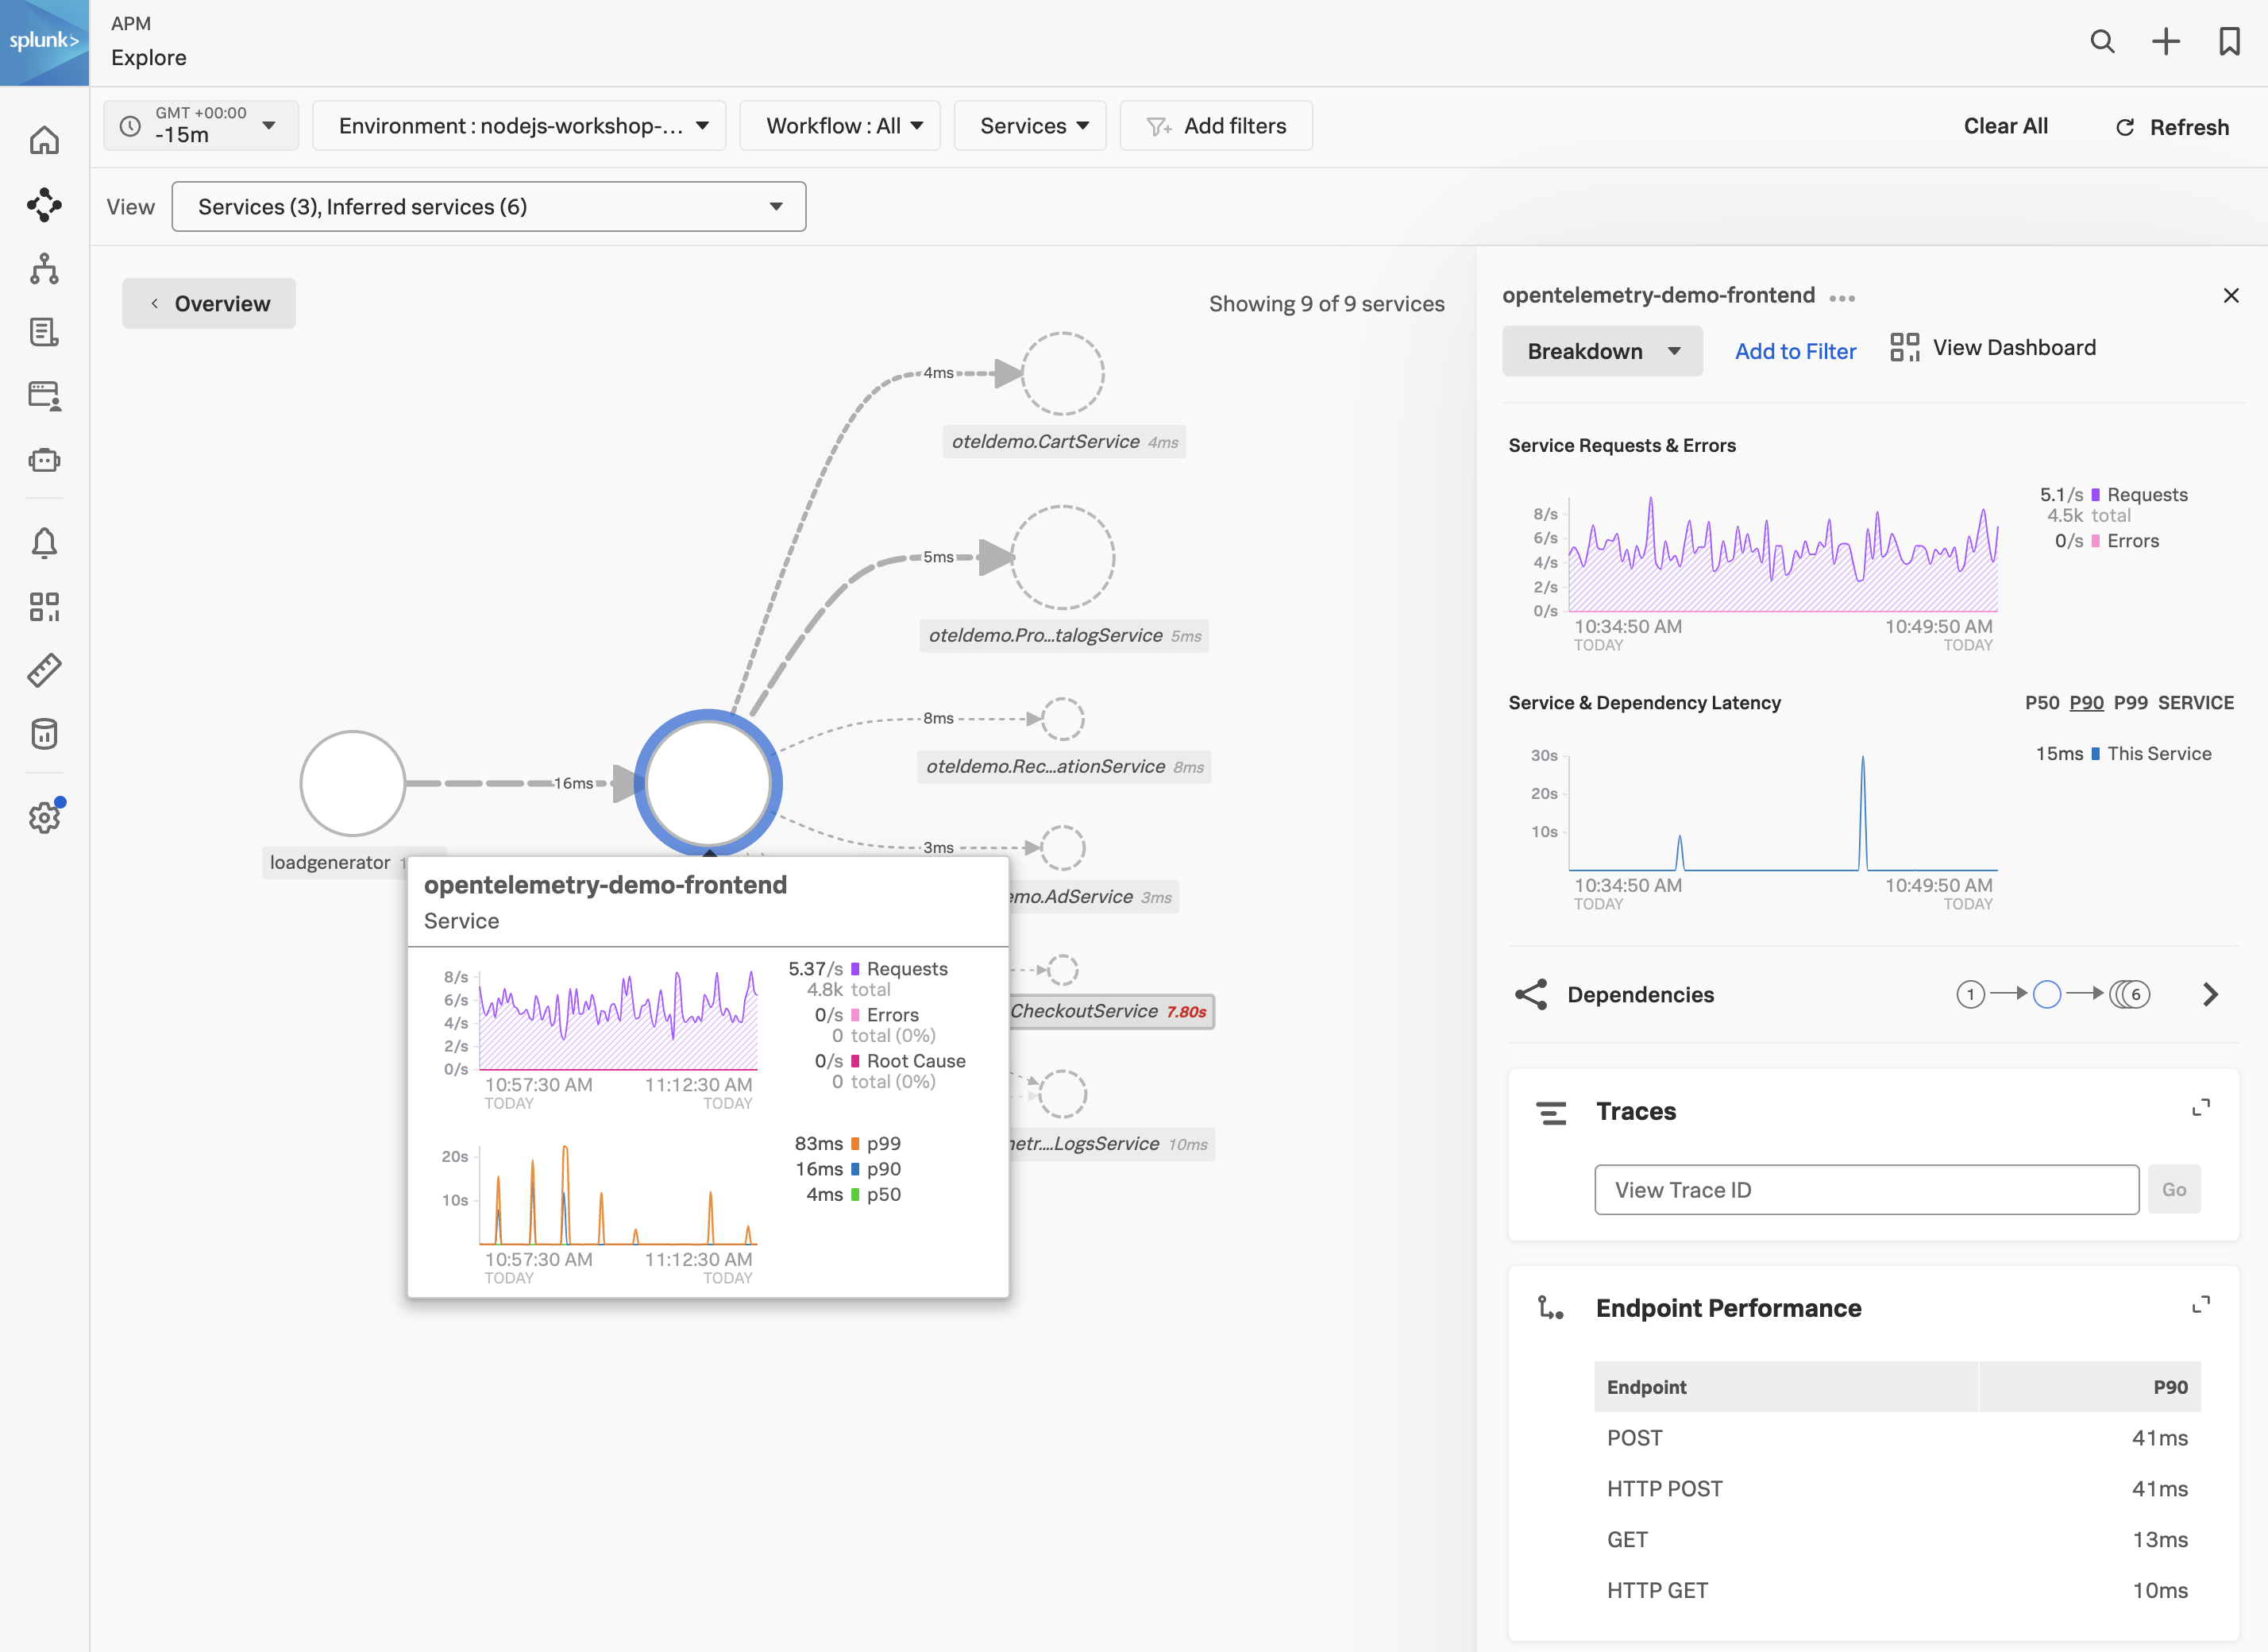
After a few minutes, you should see the frontend service in APM.
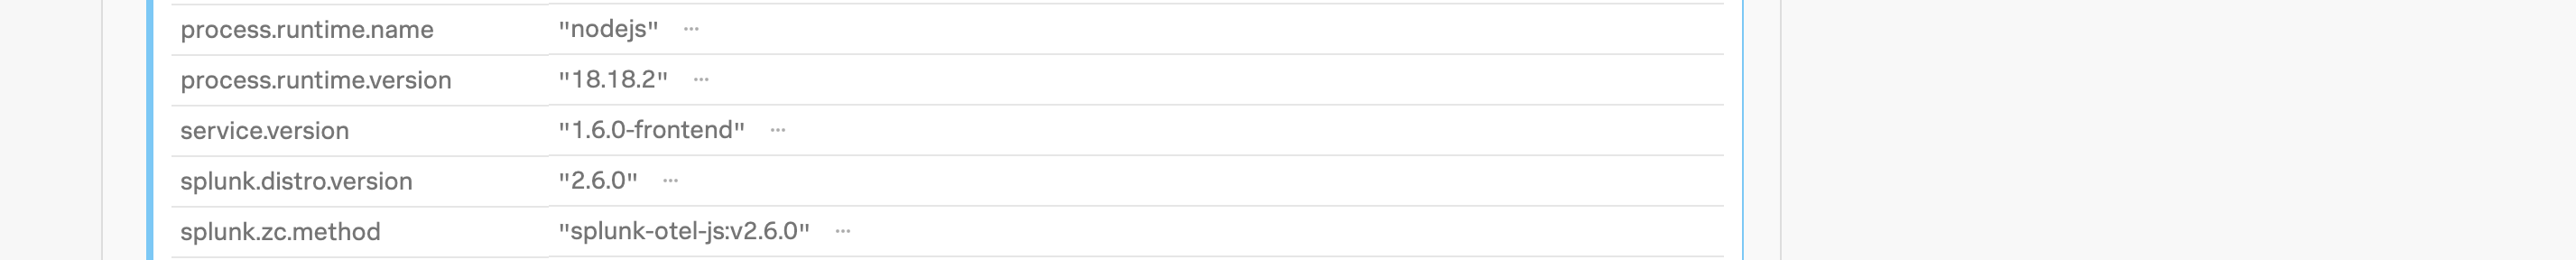
With the frontend service highlighted, click on the Traces tab to see the traces for the service. Select one of the traces and confirm that the trace contains metadata confirming that the Splunk Zero-Configuration Auto-Instrumentation for NodeJS is being used.