Code Profiling - Payment Service
1. AlwaysOn Profiling for the Payment Service
AlwaysOn Profiling is a feature of the Splunk Distribution of OpenTelemetry Collector that allows you to collect CPU and Memory profiling data for your services without having to modify your code. This is useful for troubleshooting performance issues in your services. Here are some of the benefits of AlwaysOn Profiling:
- Perform continuous profiling of your applications. The profiler is always on once you activate it.
- Collect code performance context and link it to trace data.
- Explore memory usage and garbage collection of your application.
- Analyze code bottlenecks that impact service performance.
- Identify inefficiencies that increase the need for scaling up cloud resources.
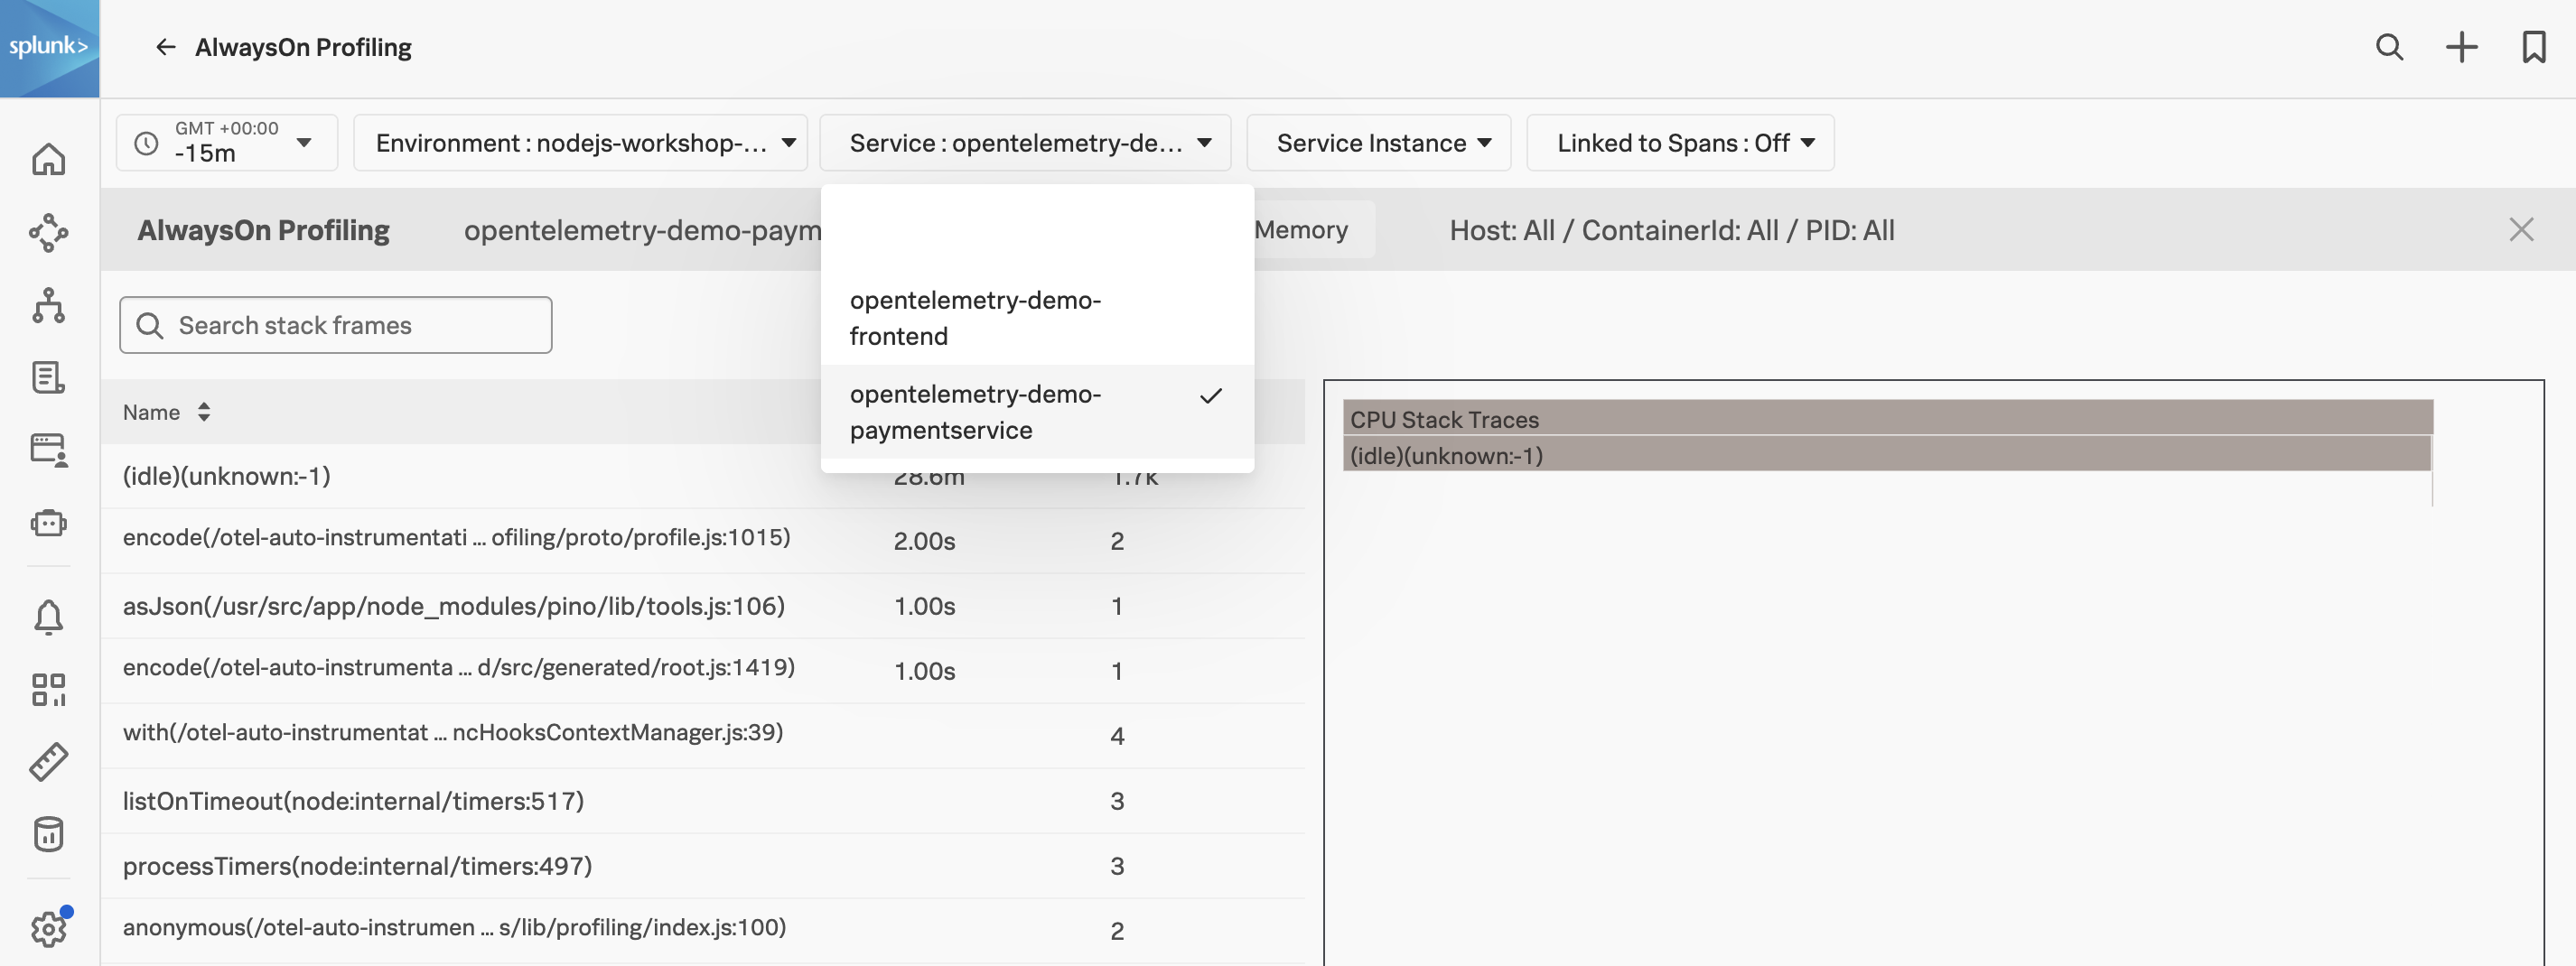
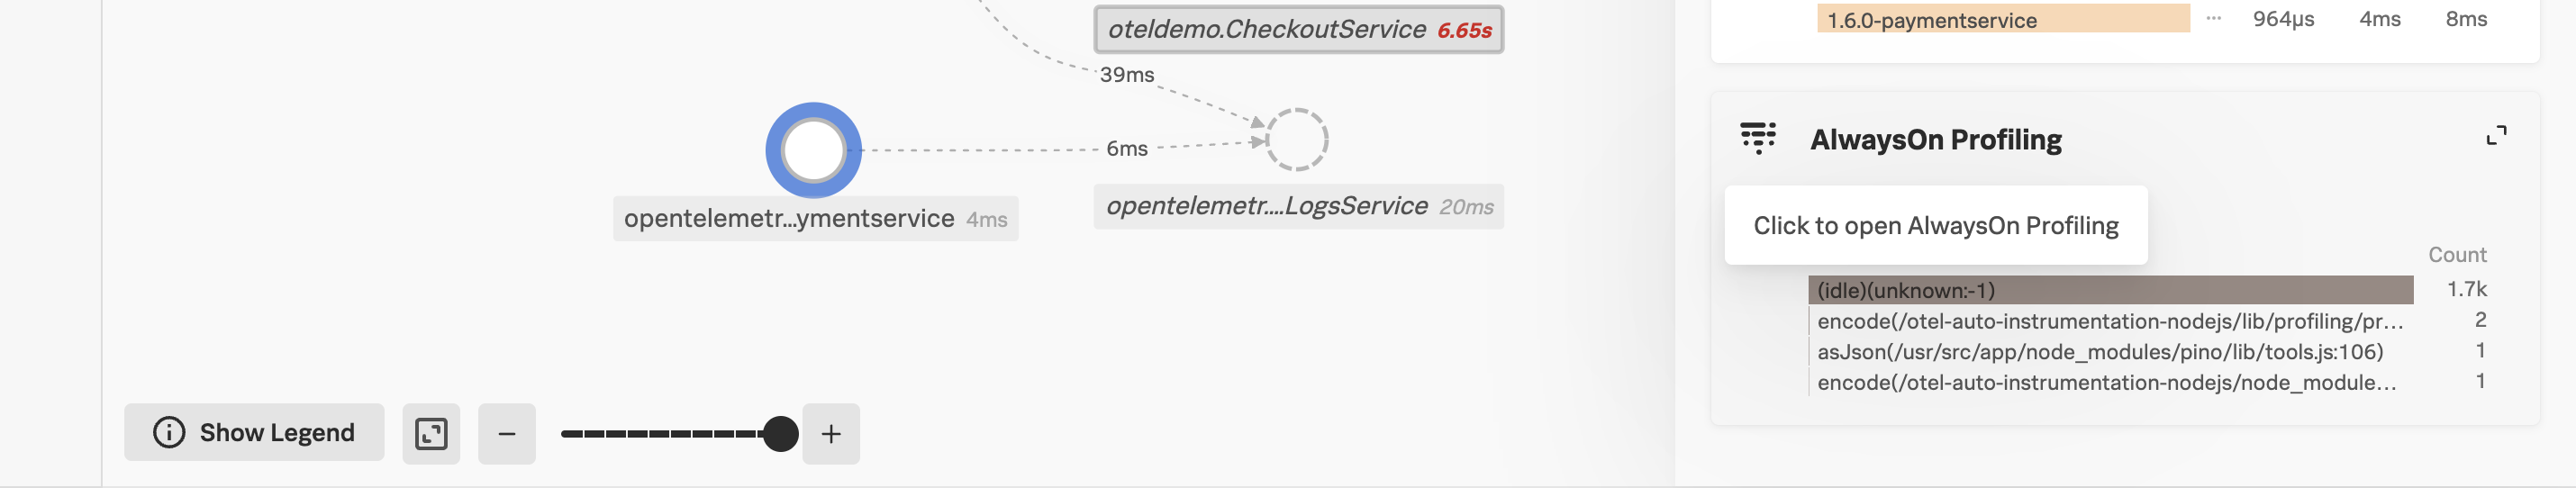
With the opentelemetry-demo-paymentservice selected, click on AlwaysOn Profiling to view the code profiling data for the service.
Here you can see the CPU and Memory profiling data for the paymentservice service. You can also see the CPU and Memory profiling data for the frontend service by selecting the opentelemetry-demofrontend service from the Service dropdown.