Setting up Zero configuration Auto instrumentation for APM
1. Introduction
In the previous chapter, we enabled the OpenTelemetry Collector for Kubernetes on our cluster and configured it to send metrics both Kubernetes and Mysql metrics to the Splunk Observability Cloud. The next section will enable auto-instrumentation for our Java apps running in the pods in our cluster.
It is important to understand that Zero Config Auto instrumentation is designed to get Trace/Span & Profiling data out of your existing application, without requiring you to change your code or requiring to rebuild.
For this workshop, we will be using the Zero config option of the Opentelemetry Collector in Kubernetes. This means that the Collector monitors your pods running in Kubernetes, and if they match certain criteria, they will enable auto-instrumentation on the pod.
For Java, it is looking for the Kubernetes TAG instrumentation.opentelemetry.io/inject-java\ set to true or to the location of the Otel collector, like default/splunk-otel-collector. The last one will work across namespaces, so this is what we will use in our examples.
If you want your pods to send traces automatically, you can add the annotation to the deployment.yaml as shown below. This will add the instrumentation library during the initial deployment. To speed things up we have done that for the management pods: Admin-server, Config-server & Discovery server.
apiVersion: apps/v1
kind: Deployment
metadata:
  name: admin-server
  labels:
    app.kubernetes.io/part-of: spring-petclinic
spec:
  selector:
    matchLabels:
      app: admin-server
  template:
    metadata:
      labels:
        app: admin-server
      annotations:
        instrumentation.opentelemetry.io/inject-java: "default/splunk-otel-collector"
2. Setting up Java auto instrumentation on the api-gateway pod
Let’s look at how zero-config works with a single pod, the api-gateway. If you enable Zero configuration for a pod, the Collector will attach an init-Container to your existing pod, and restart the pod to activate it.
To show what happens when you enable Auto instrumentation, let’s do a For & After of the content of a pod, the api-gateway in this case:
kubectl describe pods api-gateway |grep Image:The resulting output should say:
Image: quay.io/phagen/spring-petclinic-api-gateway:0.0.2quay.io and was not built to send traces to the Splunk Observability Cloud.
Let’s enable the Java auto instrumentation on the api-gateway service first by adding the inject-java tag to Kubernetes with the kubectl patch deployment command.kubectl patch deployment api-gateway -p '{"spec": {"template":{"metadata":{"annotations":{"instrumentation.opentelemetry.io/inject-java":"default/splunk-otel-collector"}}}} }'deployment.apps/api-gateway patchedkubectl describe pods api-gateway |grep Image:Next to the original pod from before, you should see an initContainer named opentelemetry-auto-instrumentation. (If you get two api-gateway containers, the original one is still terminating, so give it a few seconds):
Image:         ghcr.io/signalfx/splunk-otel-java/splunk-otel-java:v1.30.0
Image:         quay.io/phagen/spring-petclinic-api-gateway:0.0.2
3. Enable Java auto instrumentation on all pods
Now let’s patch all other services so we can see the full interaction between all services with app.kubernetes.io/part-of=spring-petclinic as the inject annotation.
remember: This automatically causes pods to restart.
Note, there will be no change for the config-server, discovery-server, admin-server & api-gateway as we patched these earlier.
kubectl get deployments -l app.kubernetes.io/part-of=spring-petclinic -o name | xargs -I % kubectl patch % -p "{\"spec\": {\"template\":{\"metadata\":{\"annotations\":{\"instrumentation.opentelemetry.io/inject-java\":\"default/splunk-otel-collector\"}}}}}"deployment.apps/config-server patched (no change)
deployment.apps/admin-server patched
deployment.apps/customers-service patched
deployment.apps/visits-service patched
deployment.apps/discovery-server patched (no change)
deployment.apps/vets-service patched
deployment.apps/api-gateway patched (no change)3. Check the result in Splunk APM
Once the containers are patched they will be restarted, let’s go back to the Splunk Observability Cloud with the URL provided by the Instructor to check our cluster in the Kubernetes Navigator.
After a couple of minutes or so you should see that the Pods are being restarted by the operator and the Zero config container will be added. This will look similar to the screenshot below:
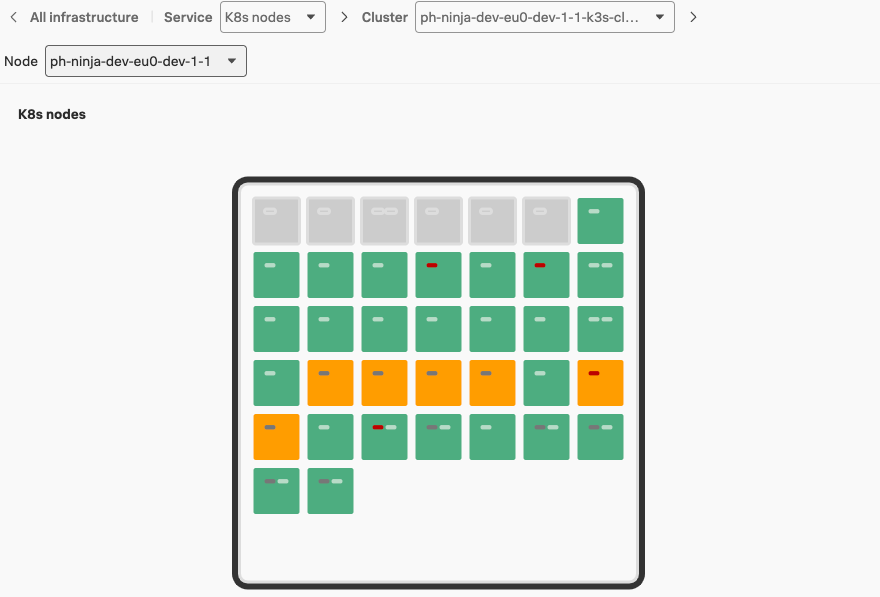
Wait for the pods to turn green again (you may want to refresh the screen), then navigate to the APM ![]()
![]() section to look at the information provided by the traces generated from your service in the Explore Pane. Use the filter option to change the environment filter (1) and search for the name of your workshop instance in the dropdown box, it should be the [INSTANCE]-workshop. (where
section to look at the information provided by the traces generated from your service in the Explore Pane. Use the filter option to change the environment filter (1) and search for the name of your workshop instance in the dropdown box, it should be the [INSTANCE]-workshop. (where INSTANCE is the value from the shell script you run earlier). Make sure it is the only one selected.
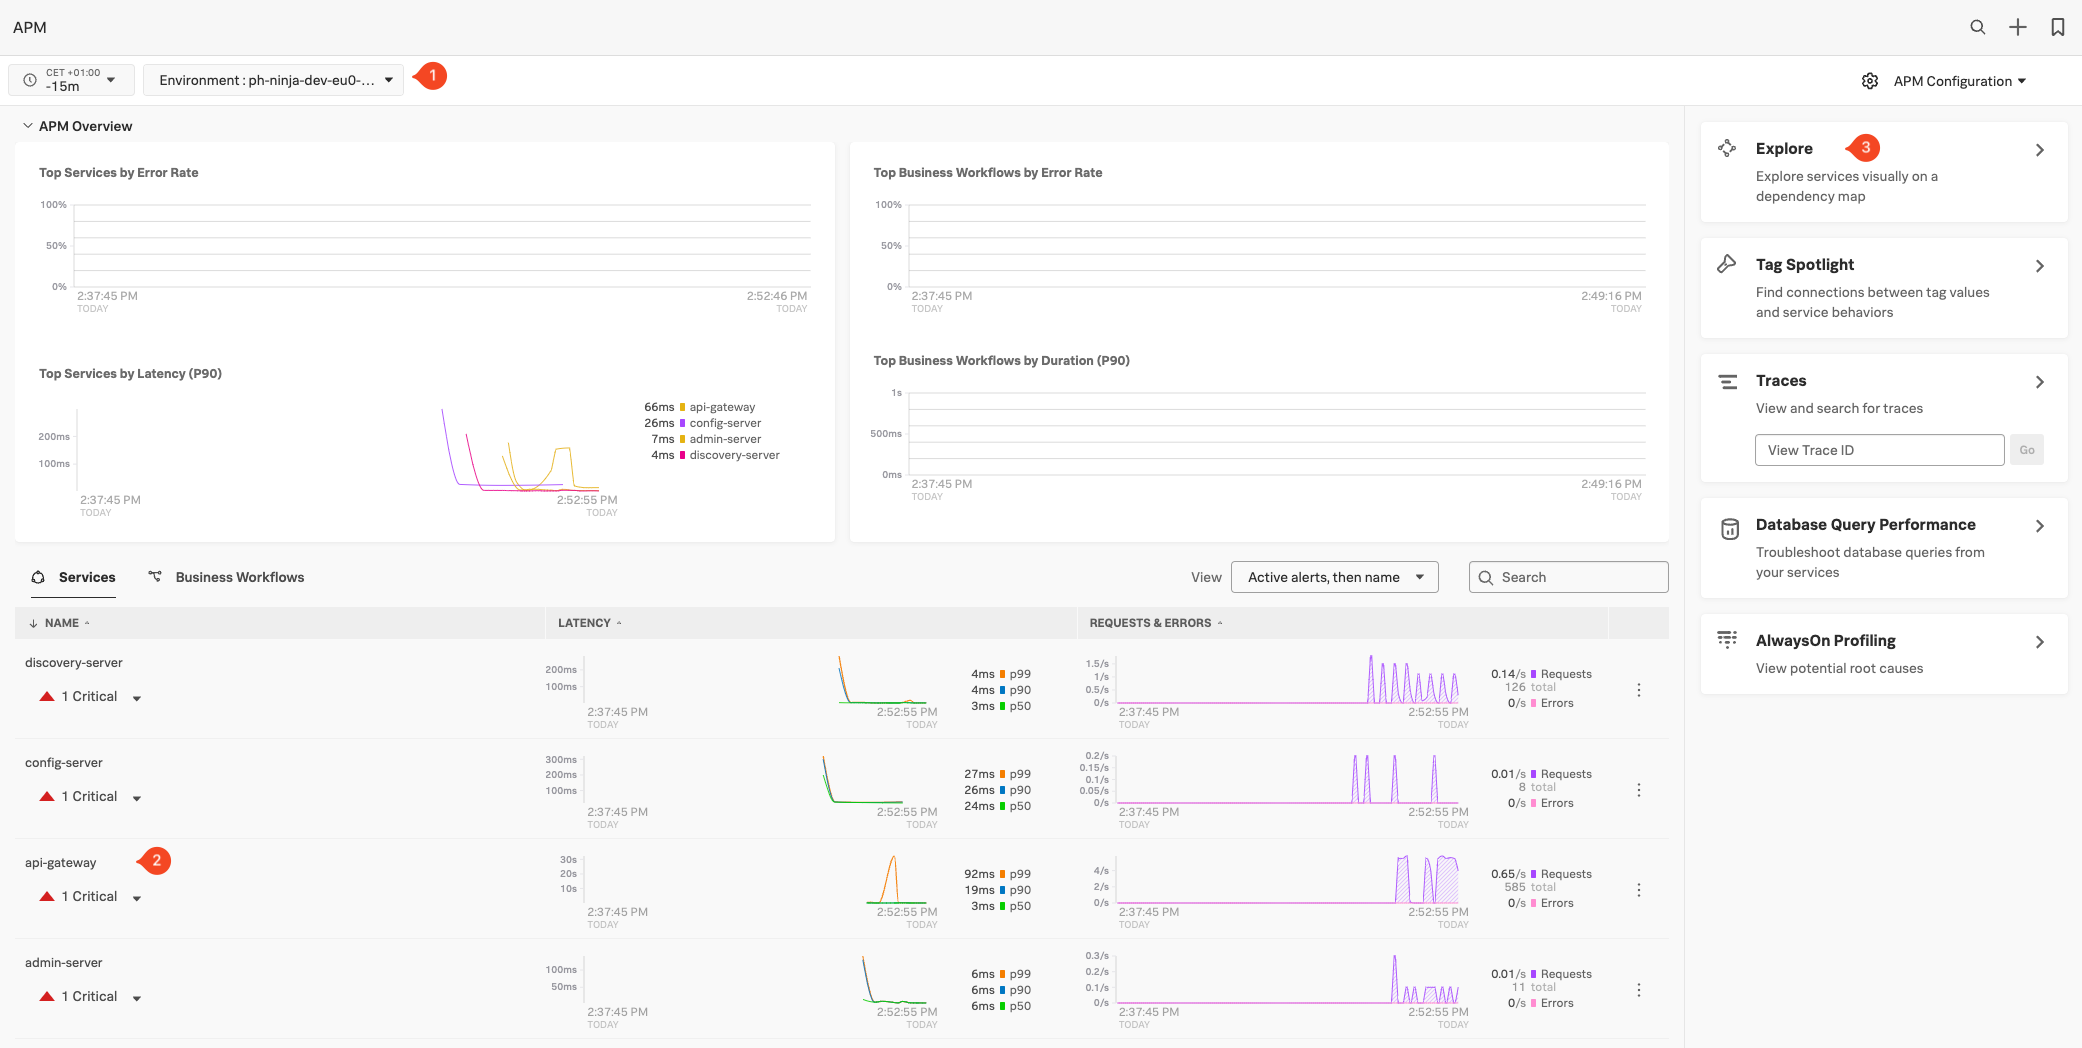
You should see the name (2) of the api-gateway service and metrics in the Latency and Request & Errors charts. (You can ignore the Critical Alert, as it was caused by the sudden request increase generated by the load generator, It will become the norm in a bit and go away). You should also see the rest of the service appear.
Next, click on Explore (3) to see the services in the automatically generated dependency map and select the api-gateway service.
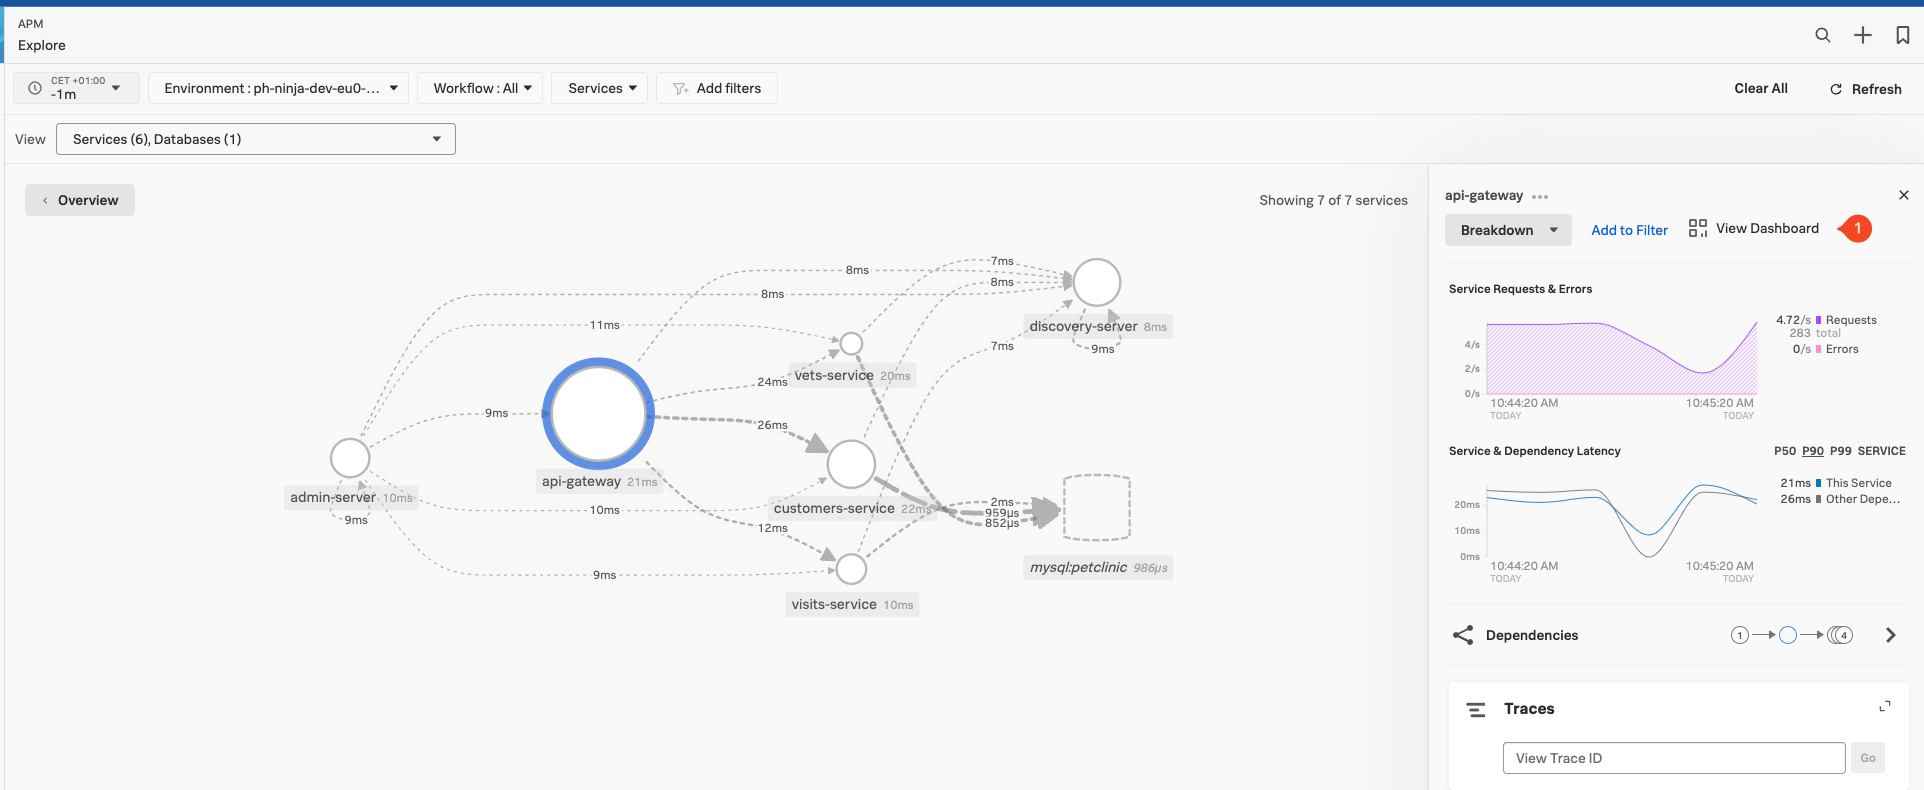
The example above shows all the interactions between all our services. You may still be showing the map in the interim state as it will take the Petclinic Microservice application a few minutes to start up and fully synchronize to make your map to look like the one above. Reducing the time will help, if you pick a custom time of 2 minutes, the initial startup-related errors (Red Dots) will disappear from the view.
In the meantime let’s examine the metrics that are available for each service that is instrumented and visit the request, error, and duration (RED) metrics Dashboard
5. Examine default R.E.D. Metrics
Splunk APM provides a set of built-in dashboards that present charts and visualized metrics to help you see problems occurring in real time and quickly determine whether the problem is associated with a service, a specific endpoint, or the underlying infrastructure. To look at this dashboard for the selected api-gateway, make sure you have the api-gateway service selected in the Dependency map as show above, then click on the *View Dashboard Link (1) at the top of the right-hand pane.
This will bring you to the services dashboard:
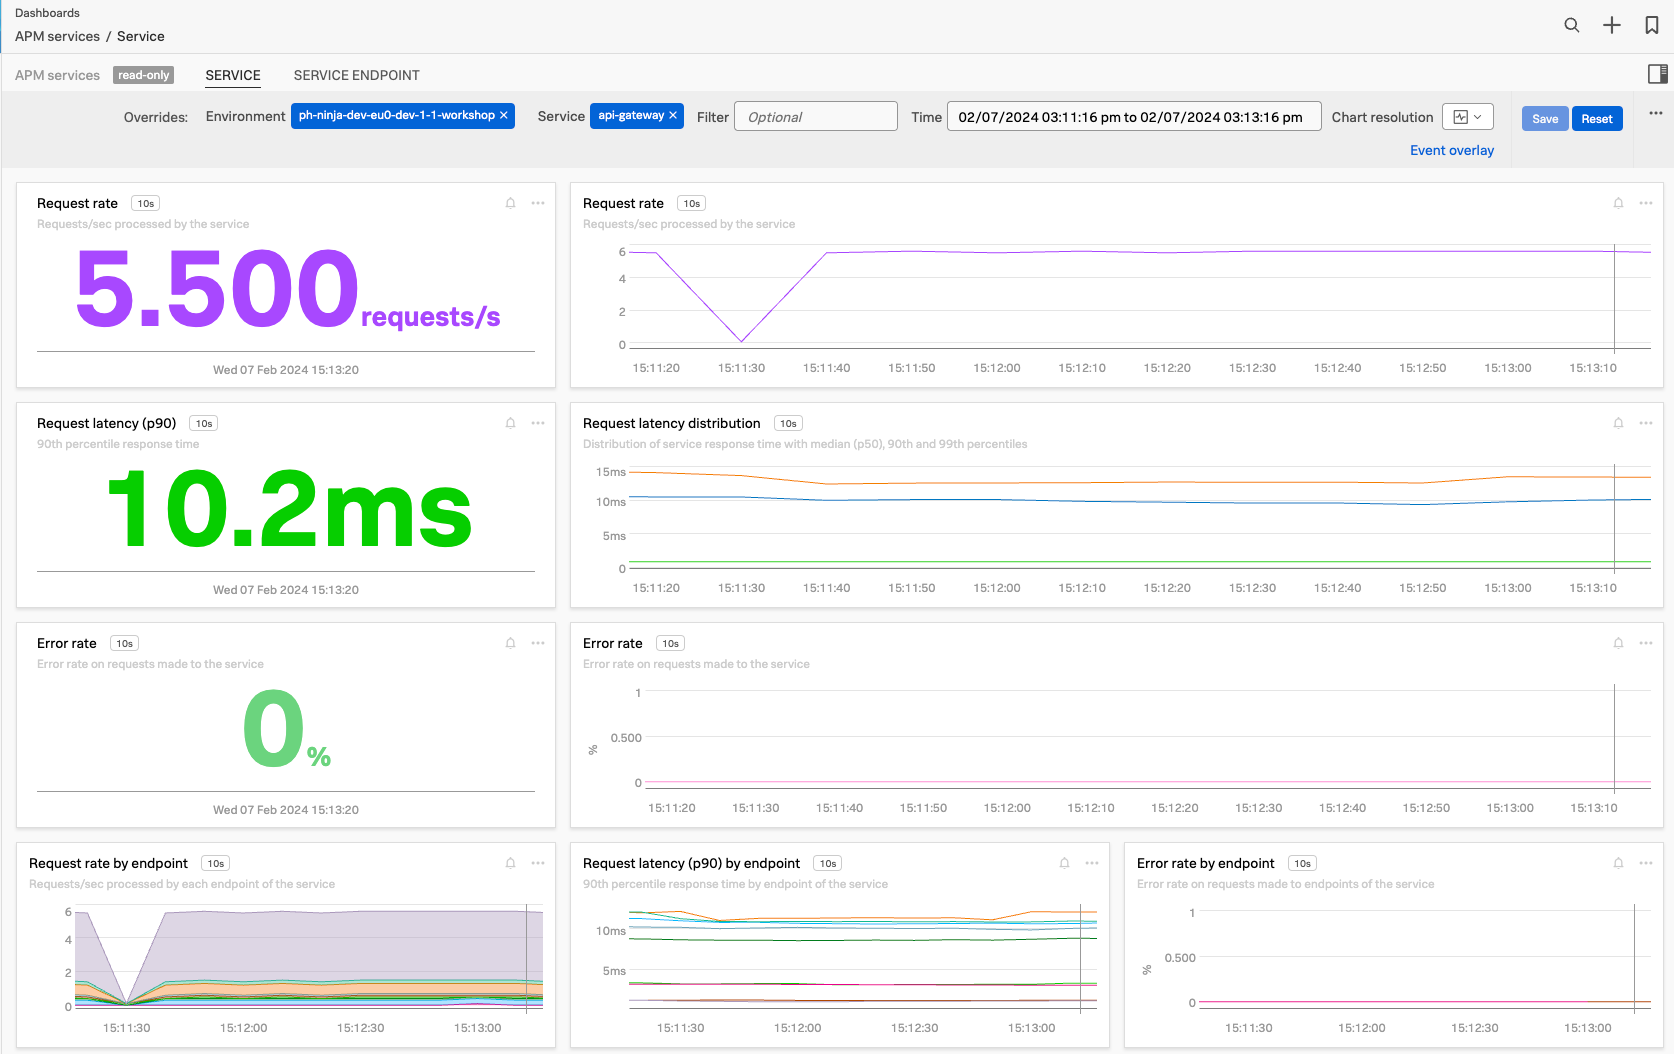
This dashboard, which is available for each of your instrumented services, offers an overview of the key request, error, and duration (RED) metrics based on Monitoring MetricSets created from endpoint spans for your services, endpoints, and Business Workflows. They also present related host and Kubernetes metrics to help you determine whether problems are related to the underlying infrastructure, as in the above image.
As the dashboards allow you to go back in time with the Time picker window (1), it’s the perfect spot to identify the behavior you wish to be alerted on, and with a click on one of the bell icons (2) available in each chart, you can set up an alert to do just that.
If you scroll down the page, you get host and Kubernetes metrics related to your service as well. Let’s move on to look at some of the traces generated by the Zero Config Auto instrumentation.