Splunk APM features available with Zero Config Auto-Instrumentation
1. Introduction
As we have seen in the previous chapter, once you have enabled Zero Config Auto Instrumentation and started to run invocations though your application, traces will be send to Splunk Observability Cloud Suite With these Traces we Splunk will automatically generate Dependency maps and RED Metrics. In this next section we are going to examine the traces itself and what information they provide to help you understand the behaviour of your services all without touching your code.
Make sure you are in the APM Explore page either by going back in the browser or navigate to the APM ![]()
![]() section in the Menu bar, then click on the Explore tile.
section in the Menu bar, then click on the Explore tile.
2. Examine a Trace from the APM Dependency map
For this exercise we are going to use a common scenario you would use if the service operation was showing high latency, or errors for example.
Select the Customer Service in the Dependency map (1), then make sure the customers-service is selected in the Services dropdown box (2). Next, select GET /Owners from the Operations Drop down (3).
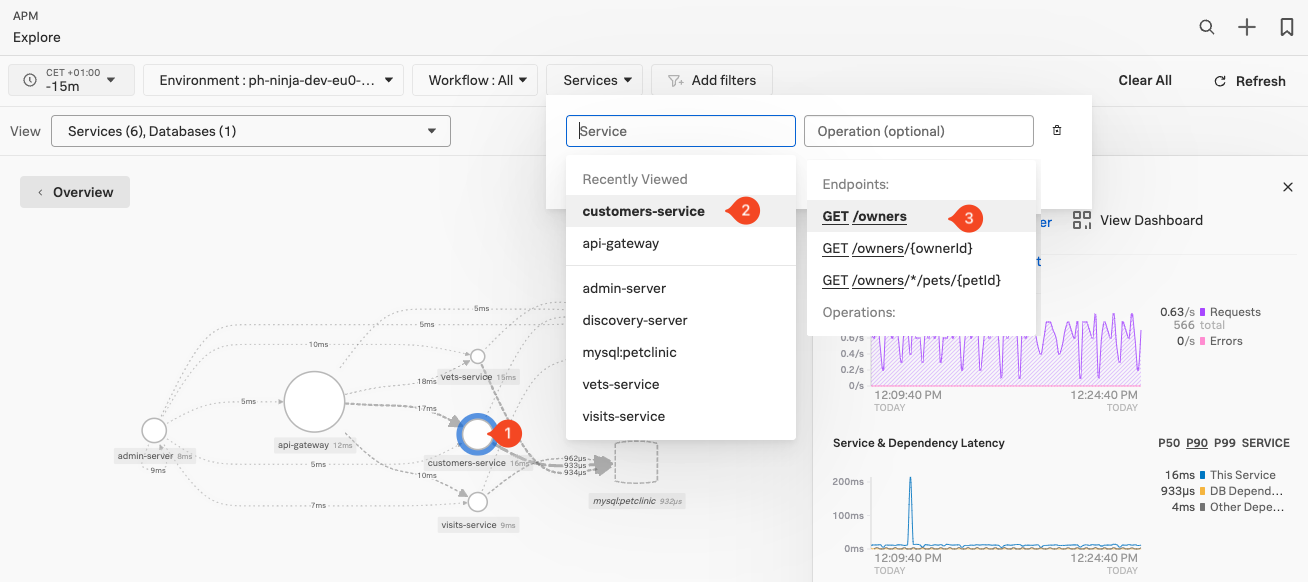
This should give you the workflow wit A filter on GET /owners (1) as shown below. To pick a trace, select a line in the Service Requests & Errors chart (2), when the dot appear click to get a list of sample traces:
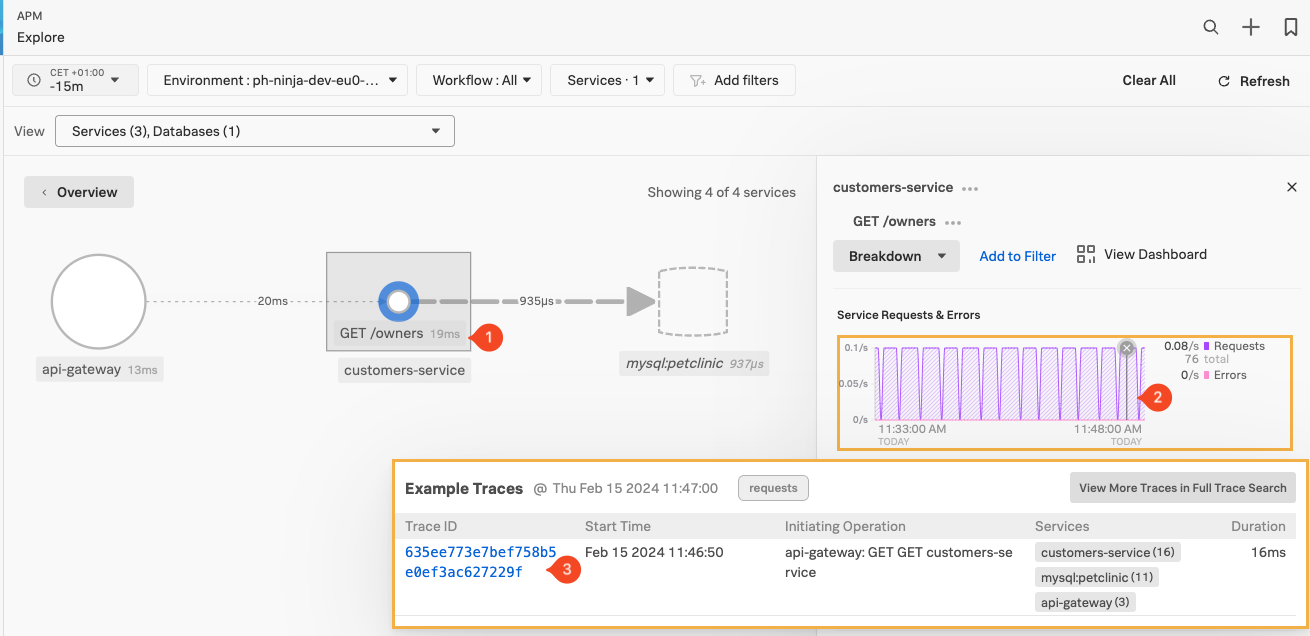
Once you have the list of sample traces, Clicking on the blue (3) Trace ID Link. (Make sure it has at thesame three services mentioned in the Service Column.)
This bring us the the Trace selected in the Waterfall view:
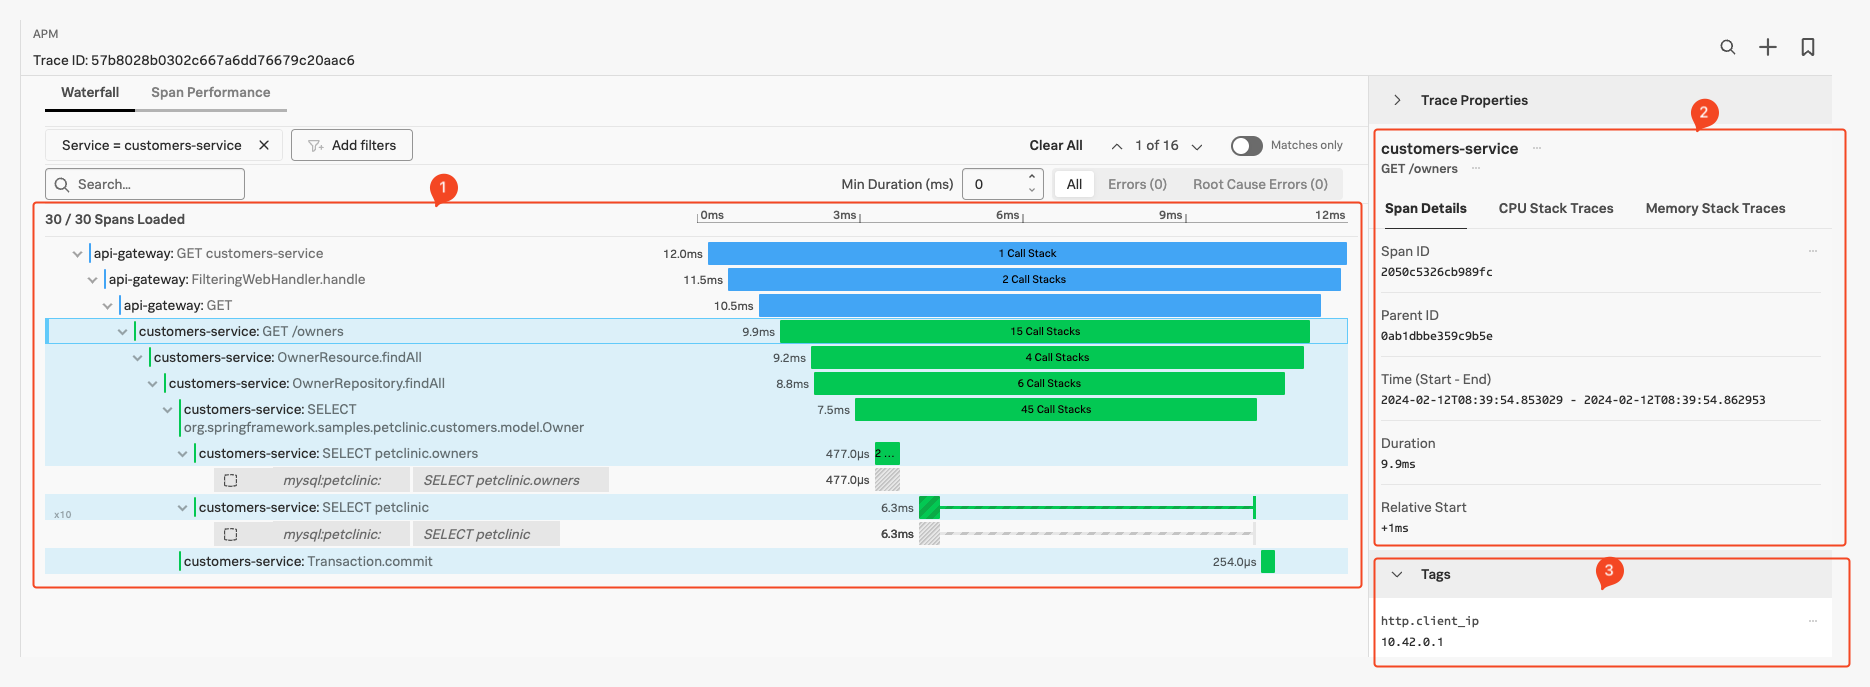
Here we find several sections:
- The actual Waterfall Pane (1), where you see the trace and all the instrumented functions visible as spans, with their duration representation and order/relationship showing.
- The Trace Info Pane (2), by default it is showing the selected Span information. (Highlighted with a box around the Span in the Waterfall Pane.)
- The Span Pane (3), here you can find all the Tags that have been send in the selected Span, You can scroll down to see all of them.
- The process Pane, with tags related to the process that created the Span (Scroll down to see as it is not in the screenshot.)
- The Trace Properties at the top of the right hand pane, default it is collapsed as shown.
First lets examine a Span:
3. Spans and Zero Config Auto-Instrumentation features
While we examine our spans, lets look at a number features that you get out of the box without code modifications when using Zero config Auto-Instrumentation on top of tracing:
Due to tha fact there are several different routes
First, in the Waterfall Pane, make sure the customers-service:SELECT petclinic.owners or similar span is selected as shown in the screenshot below:
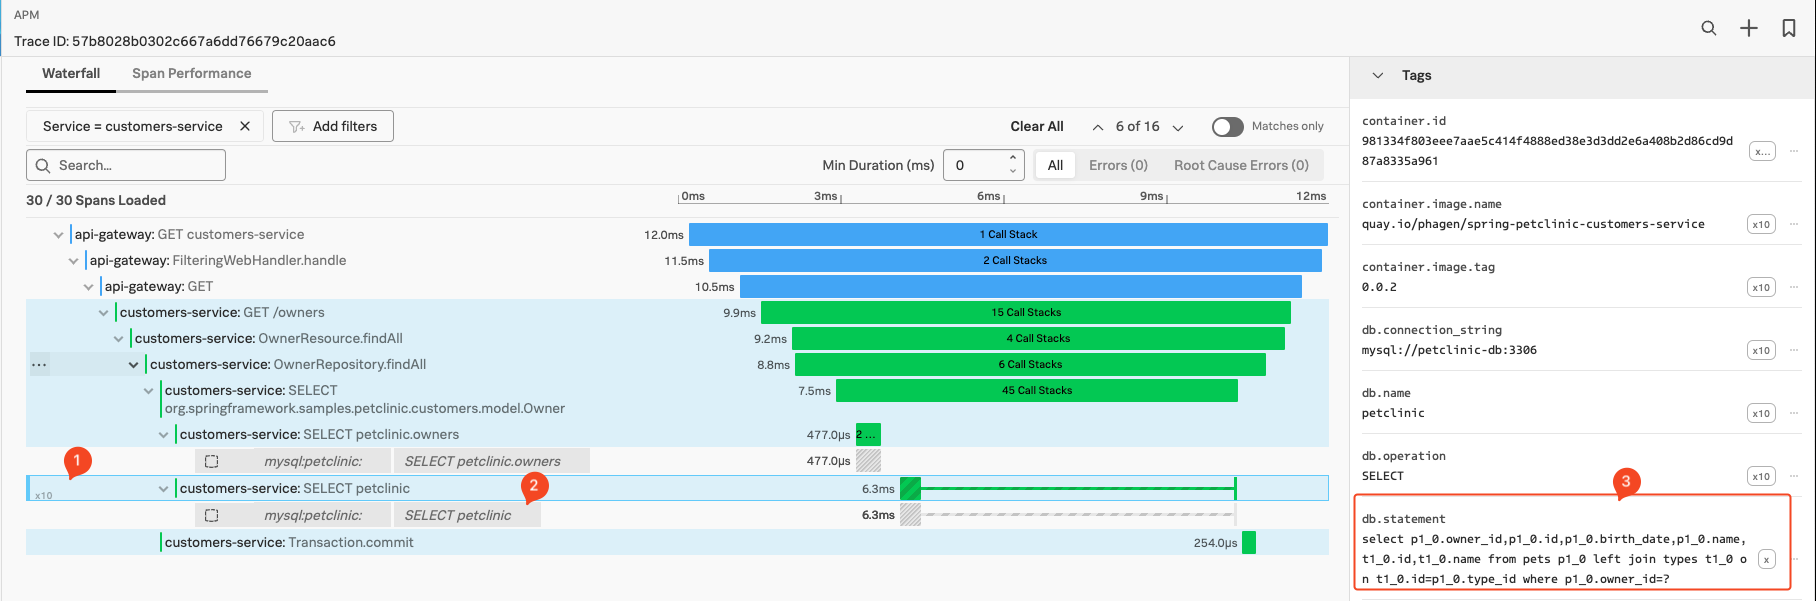
- The basic latency information showing as a bar for the instrumented function or call, in our example, it took 6.3 Milliseconds.
- Number of similar Spans (1), only visible if a the span is repeated multiple time. In this case there are 10 repeats in our example. (You can show/hide them all by clicking on the
10xand all span will show in order) - Inferred Services, Calls done to external systems that are not instrumented, show up as a gray ‘inferred’ span. The Inferred Service or span in our case here is a call to the Mysql Database
mysql:petclinic SELECT petclinic(2) as shown below our selected span. - Span Tags in the Tag Pane, Standard tags produced by the auto instrumentation agent. In this case the span is calling a Database, so it includes the
db.statementtag (3). This tag will hold the DB query statement and is used by the Database call performed during this span. This will be used by the DB-Query Performance feature. We look at DB-Query Performance in the next section. - Always-on Profiling, IF the system is configured to, and has captured Profiling data during a Spans life cycle, it will show the number of Call Stacks captured in the Spans time line. (15 Call Stacks for the
customers-service:SELECT petclinic.ownersSpan show above). We will look at Profiling in the next section.