Splunk APM Always-on Profiling & Database Query Performance
1. Introduction
As we have seen in the previous chapter, you can trace your interactions between the various services using APM without touching your code, which will allow you to identify issues faster. However as seen, besides tracing, Splunk Zero Config for Auto-Instrumentations offers additional features out of the box that can help you finding issues faster. In this section we are going to look at 2 of them:
- Always-on Profiling and Java Metrics
- Database Query Performance
If you want to dive deeper into Always-on Profiling or DB-Query performance, we have a separate Ninja Workshop called Debug Problems that you can follow for more detailed info.
2. AlwaysOn Profiling and Metrics
When we installed the Splunk Distribution of the OpenTelemetry Collector using the Helm chart earlier, we configured it to enable AlwaysOn Profiling and Metrics. This means that the collector will automatically generate CPU and Memory profiles for the application and send them to Splunk Observability Cloud.
When you deploy the PetClinic application and set the annotation, the collector automatically detects the application and instruments it for traces and profiling. We can verify this by examining the startup logs of one of the Java containers we are instrumenting by running the following script:
. ~/workshop/petclinic/scripts/get_logs.shThe logs should show what flags were picked up by the Java Auto instrumentation agent:
2024/02/15 09:42:00 Problem with dial: dial tcp 10.43.104.25:8761: connect: connection refused. Sleeping 1s
2024/02/15 09:42:01 Problem with dial: dial tcp 10.43.104.25:8761: connect: connection refused. Sleeping 1s
2024/02/15 09:42:02 Connected to tcp://discovery-server:8761
Picked up JAVA_TOOL_OPTIONS:  -javaagent:/otel-auto-instrumentation-java/javaagent.jar
Picked up _JAVA_OPTIONS: -Dspring.profiles.active=docker,mysql -Dsplunk.profiler.call.stack.interval=150
OpenJDK 64-Bit Server VM warning: Sharing is only supported for boot loader classes because bootstrap classpath has been appended
[otel.javaagent 2024-02-15 09:42:03:056 +0000] [main] INFO io.opentelemetry.javaagent.tooling.VersionLogger - opentelemetry-javaagent - version: splunk-1.30.1-otel-1.32.1
[otel.javaagent 2024-02-15 09:42:03:768 +0000] [main] INFO com.splunk.javaagent.shaded.io.micrometer.core.instrument.push.PushMeterRegistry - publishing metrics for SignalFxMeterRegistry every 30s
[otel.javaagent 2024-02-15 09:42:07:478 +0000] [main] INFO com.splunk.opentelemetry.profiler.ConfigurationLogger - -----------------------
[otel.javaagent 2024-02-15 09:42:07:478 +0000] [main] INFO com.splunk.opentelemetry.profiler.ConfigurationLogger - Profiler configuration:
[otel.javaagent 2024-02-15 09:42:07:480 +0000] [main] INFO com.splunk.opentelemetry.profiler.ConfigurationLogger -                  splunk.profiler.enabled : true
[otel.javaagent 2024-02-15 09:42:07:505 +0000] [main] INFO com.splunk.opentelemetry.profiler.ConfigurationLogger -                splunk.profiler.directory : /tmp
[otel.javaagent 2024-02-15 09:42:07:505 +0000] [main] INFO com.splunk.opentelemetry.profiler.ConfigurationLogger -       splunk.profiler.recording.duration : 20s
[otel.javaagent 2024-02-15 09:42:07:506 +0000] [main] INFO com.splunk.opentelemetry.profiler.ConfigurationLogger -               splunk.profiler.keep-files : false
[otel.javaagent 2024-02-15 09:42:07:510 +0000] [main] INFO com.splunk.opentelemetry.profiler.ConfigurationLogger -            splunk.profiler.logs-endpoint : http://10.13.2.38:4317
[otel.javaagent 2024-02-15 09:42:07:513 +0000] [main] INFO com.splunk.opentelemetry.profiler.ConfigurationLogger -              otel.exporter.otlp.endpoint : http://10.13.2.38:4317
[otel.javaagent 2024-02-15 09:42:07:513 +0000] [main] INFO com.splunk.opentelemetry.profiler.ConfigurationLogger -           splunk.profiler.memory.enabled : true
[otel.javaagent 2024-02-15 09:42:07:515 +0000] [main] INFO com.splunk.opentelemetry.profiler.ConfigurationLogger -             splunk.profiler.tlab.enabled : true
[otel.javaagent 2024-02-15 09:42:07:516 +0000] [main] INFO com.splunk.opentelemetry.profiler.ConfigurationLogger -        splunk.profiler.memory.event.rate : 150/s
[otel.javaagent 2024-02-15 09:42:07:516 +0000] [main] INFO com.splunk.opentelemetry.profiler.ConfigurationLogger -      splunk.profiler.call.stack.interval : PT0.15S
[otel.javaagent 2024-02-15 09:42:07:517 +0000] [main] INFO com.splunk.opentelemetry.profiler.ConfigurationLogger -  splunk.profiler.include.internal.stacks : false
[otel.javaagent 2024-02-15 09:42:07:517 +0000] [main] INFO com.splunk.opentelemetry.profiler.ConfigurationLogger -      splunk.profiler.tracing.stacks.only : false
[otel.javaagent 2024-02-15 09:42:07:517 +0000] [main] INFO com.splunk.opentelemetry.profiler.ConfigurationLogger - -----------------------
[otel.javaagent 2024-02-15 09:42:07:518 +0000] [main] INFO com.splunk.opentelemetry.profiler.JfrActivator - Profiler is active.
We are interested in the section written by the com.splunk.opentelemetry.profiler.ConfigurationLogger or the Profiling Configuration
We can see the various settings you can control, some that are useful depending on your use case like the splunk.profiler.directory - The location where the agent writes the call stacks before sending them to Splunk. This may be different depending how you configure your containers.
Another parameter you may want to change is splunk.profiler.call.stack.interval This is how often the system takes a CPU Stack trace. You may want to reduce this if you have short spans like we have in our application. (we kept the default as the spans in this demo application are extremely short, so Span may not always have a CPU Call Stack related to it.)
You can find how to set these parameters here. Below, is how you set a higher collection rate for call stack in your deployment.yaml, exactly how to pass any JAVA option to the the Java application running in your container:
 env:
    - name: JAVA_OPTIONS
      value: "-Dsplunk.profiler.call.stack.interval=150"
If you don’t see those lines as a result from the script, the startup may have taken to long and generated to many connection errors, try looking at the logs directly with kubectl or the k9s utility that is installed.
2. Looking at Profiling Data in the Trace Waterfall
Make sure you have your original (or similar) Trace & Span (1) selected in the APM Waterfall view and select Memory Stack Traces (2) from the right hand pane:
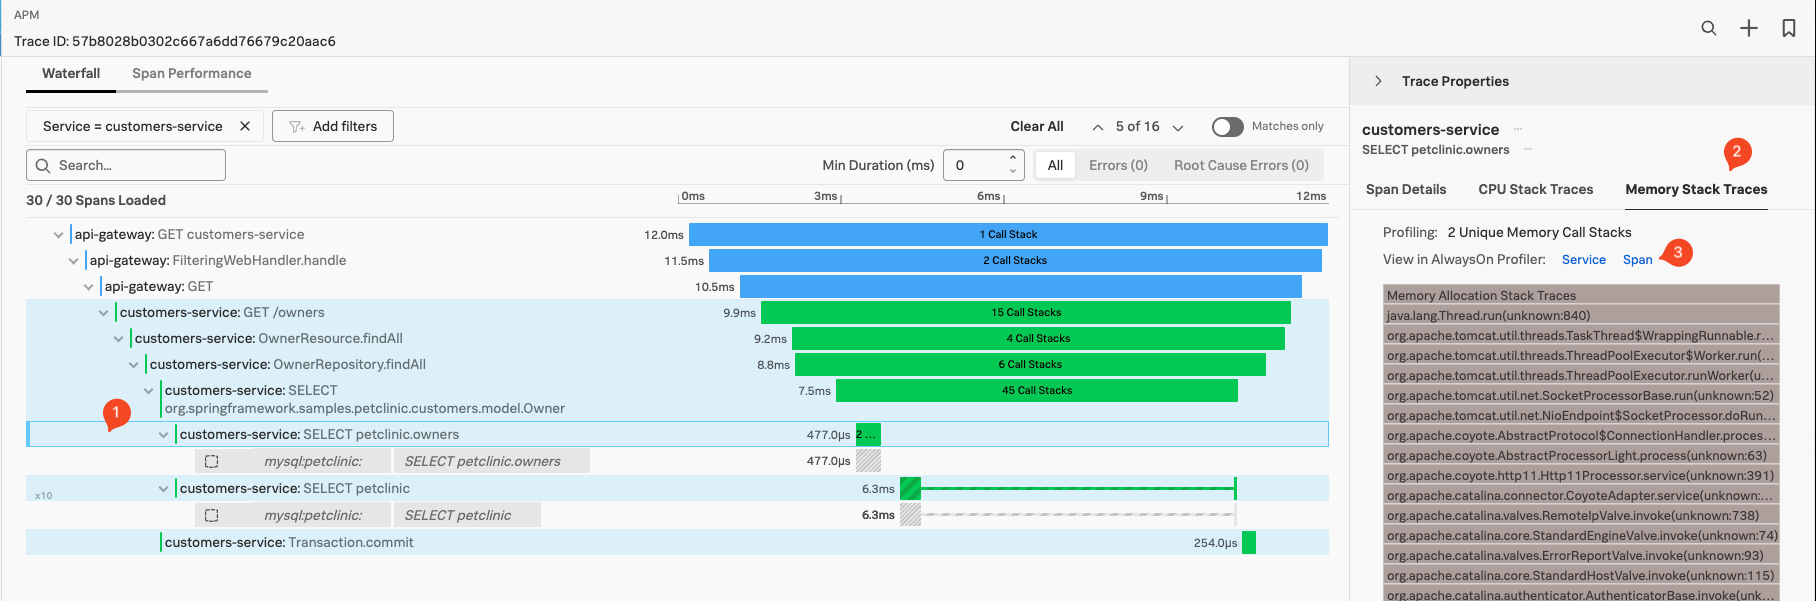
The pane should show you the Memory Stack Trace Flame Graph (3), you can scroll down and/or make the pane for a better view wider by dragging the right side of the pane.
As AlwaysOn Profiling is constantly taking snapshots, or stack traces, of your application’s code and reading through thousands of stack traces is not practical, AlwaysOn Profiling aggregates and summarizes profiling data, providing a convenient way to explore Call Stacks in a view called the Flame Graph. It represents a summary of all stack traces captured from your application. You can use the Flame Graph to discover which lines of code might be causing performance issues and to confirm whether the changes you make to the code have the intended effect.
To dive deeper in the Always-on Profiling, select Span (3) in the Profiling Pane under Memory Stack Traces This will bring you to the Always-on Profiling main screen, with the Memory view pre selected:
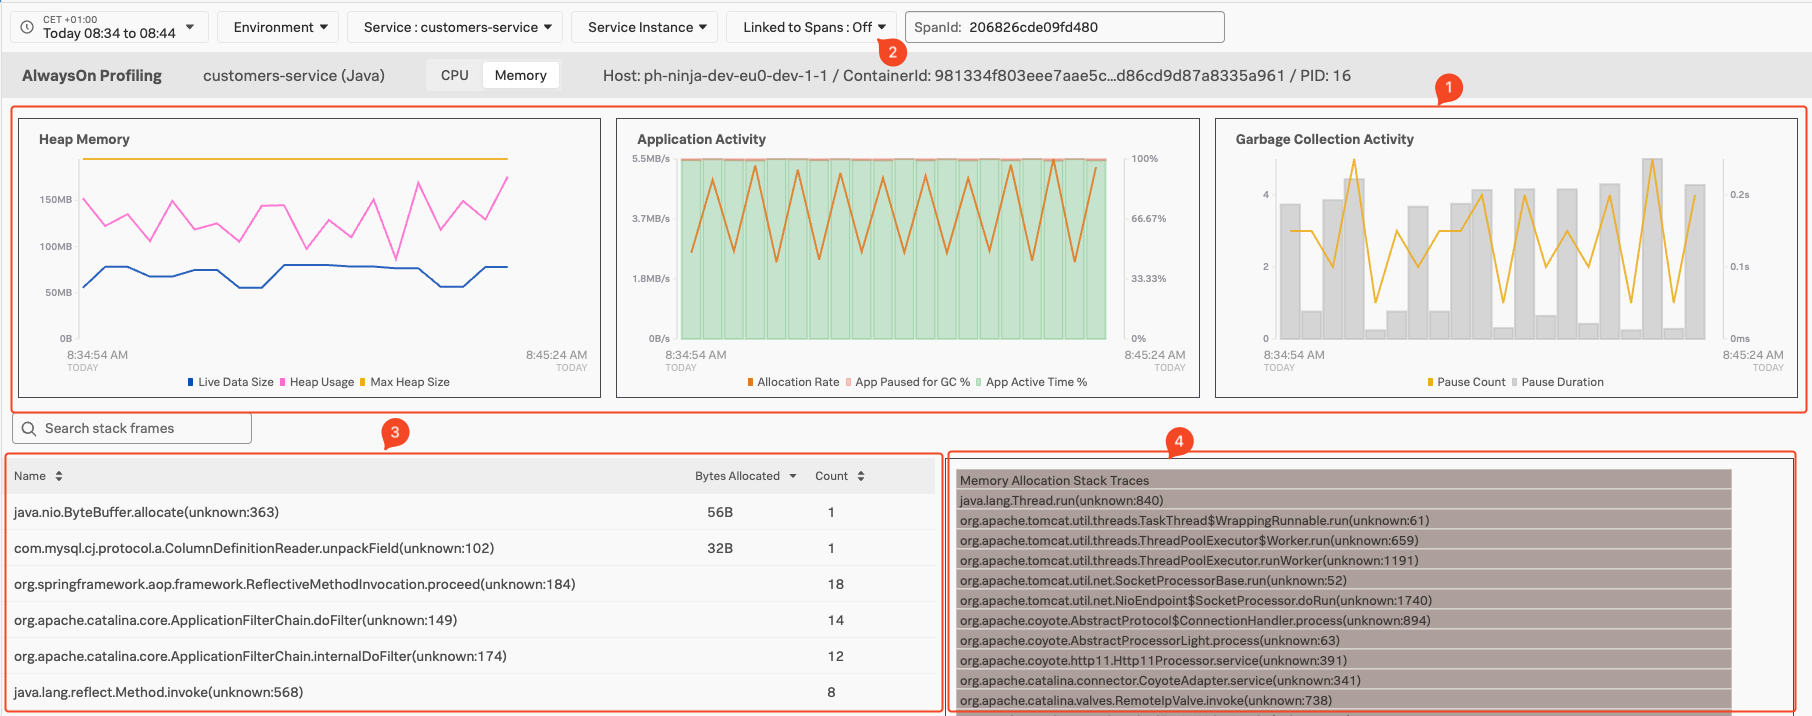
- Java Memory Metric Charts (1), Allow you to
Monitor Heap Memory, Application ActivitylikeMemory Allocation RateandGarbage CollectingMetrics. - Ability to focus/see metrics and Stack Traces only related to the Span (2), This will filter out background activities running in the Java application if required.
- Java Function calls identified.(3), allowing you to drill down into the Methods called from that function.
- The Flame Graph (4), with the visualization of hierarchical based on the stack traces of the profiled service.
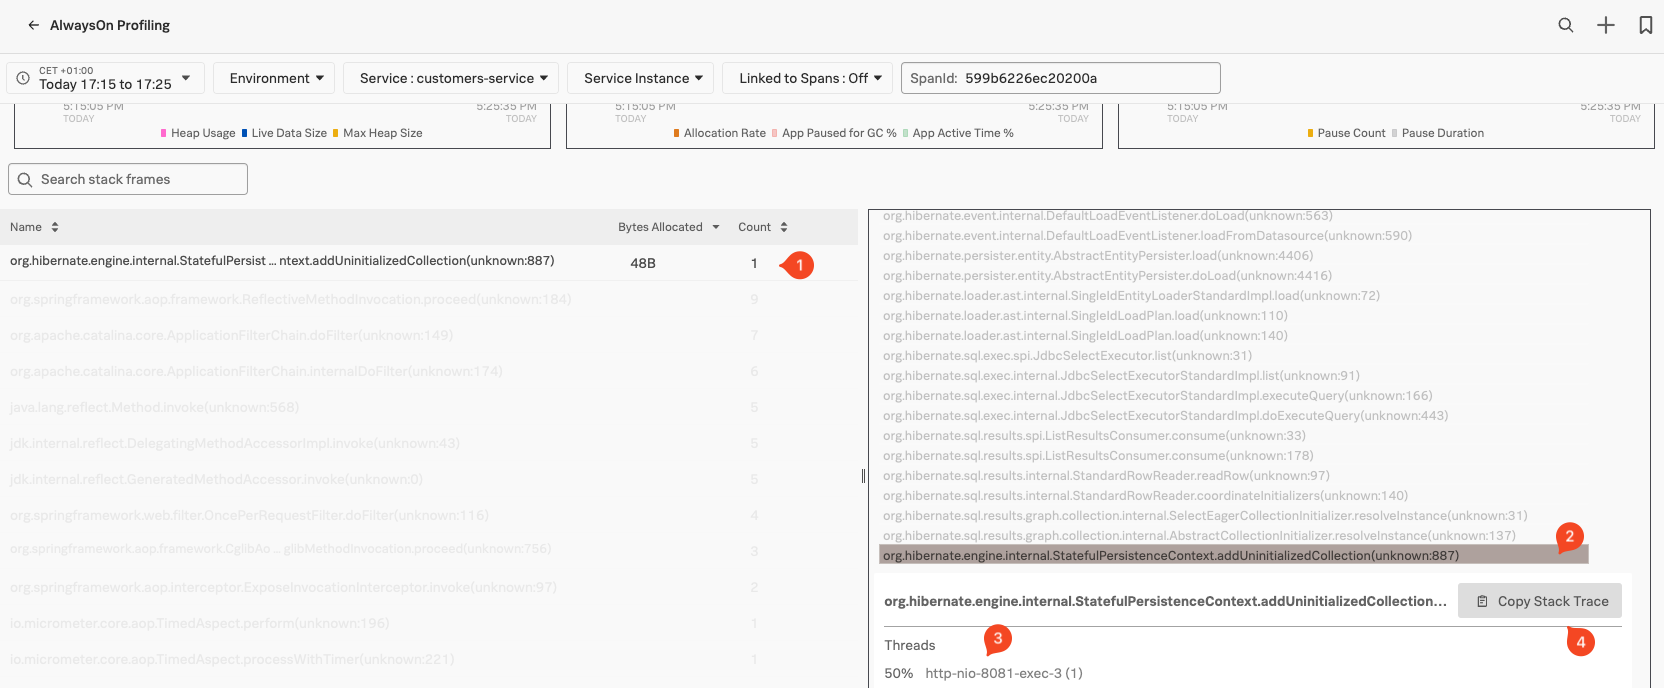
Once you have identified the relevant Function or Method you are interested in, com.mysql.cj.protocol.a.NativePacketPayload.readBytes in our example but yor may differ, so pick the top one (1) and find it at the e bottom of the Flame Graph (2). Click on it in the Flame Graph, it will show a pane as shown in the image below, where you can see the Thread information (3) by clicking on the blue Show Thread Info link. If you click on the Copy Stack Trace (4) button, you grab the actual stack trace that you can use in your coding platform to go to the actual lines of code use at this point (depending of course on your preferred Coding platform)
For more detail on Profiling, check the the Debug Problems workshop, or check the documents here
3. Database Query Performance
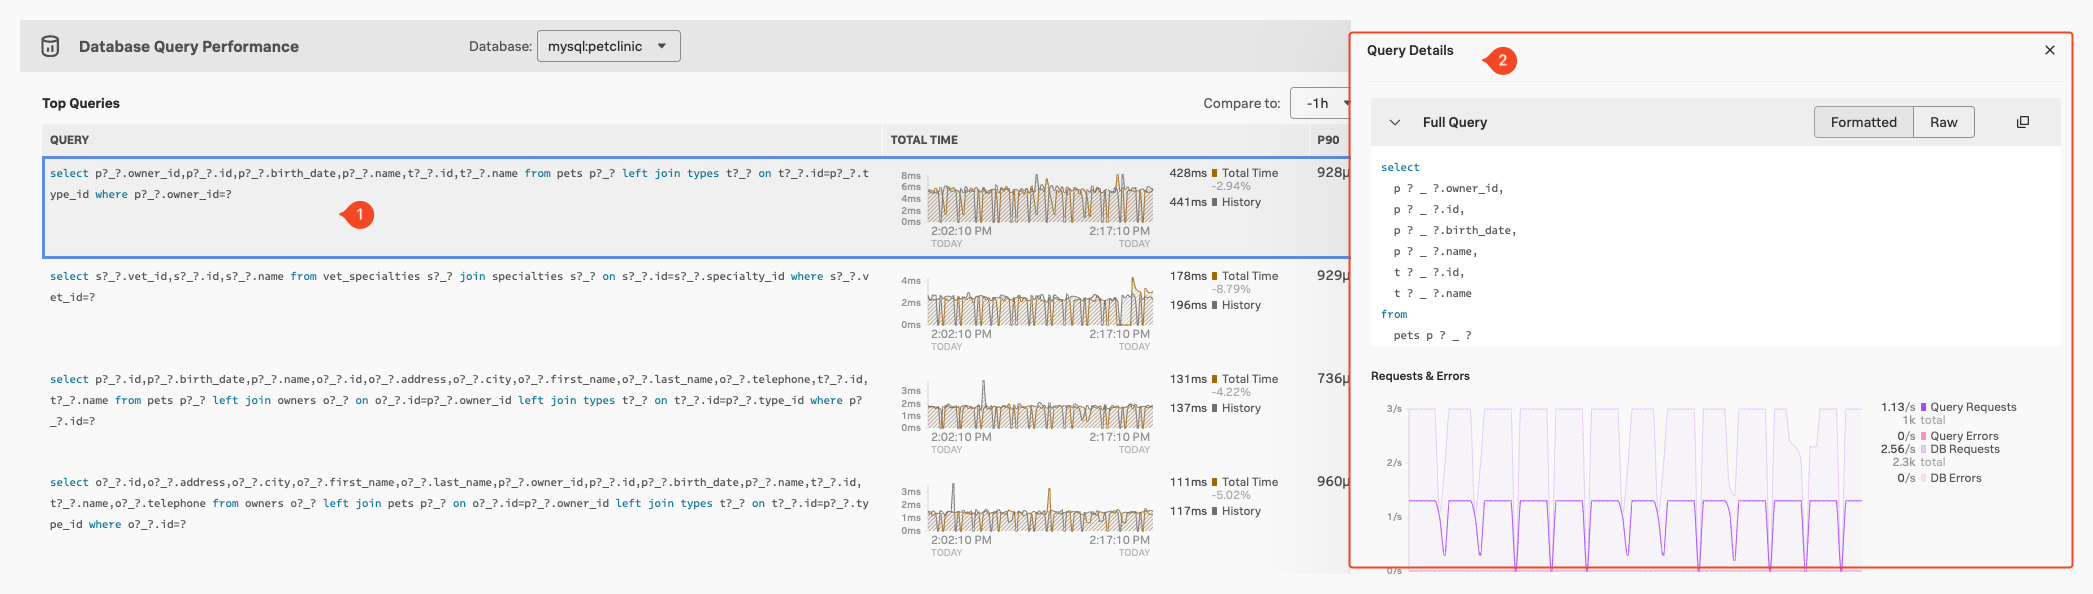
With Database Query Performance, you can monitor the impact of your database queries on service availability directly in Splunk APM. This way, you can quickly identify long-running, unoptimized, or heavy queries and mitigate issues they might be causing, without having to instrument your databases.
To look at the performance of your database queries, make sure you are in the APM Explore page either by going back in the browser or navigate to the APM APM section in the Menu bar, then click on the Explore tile.
Select the inferred database service mysql:petclinic Inferred Database server in the Dependency map (1), then scroll the right hand pane to find the Database Query Performance Pane (2).
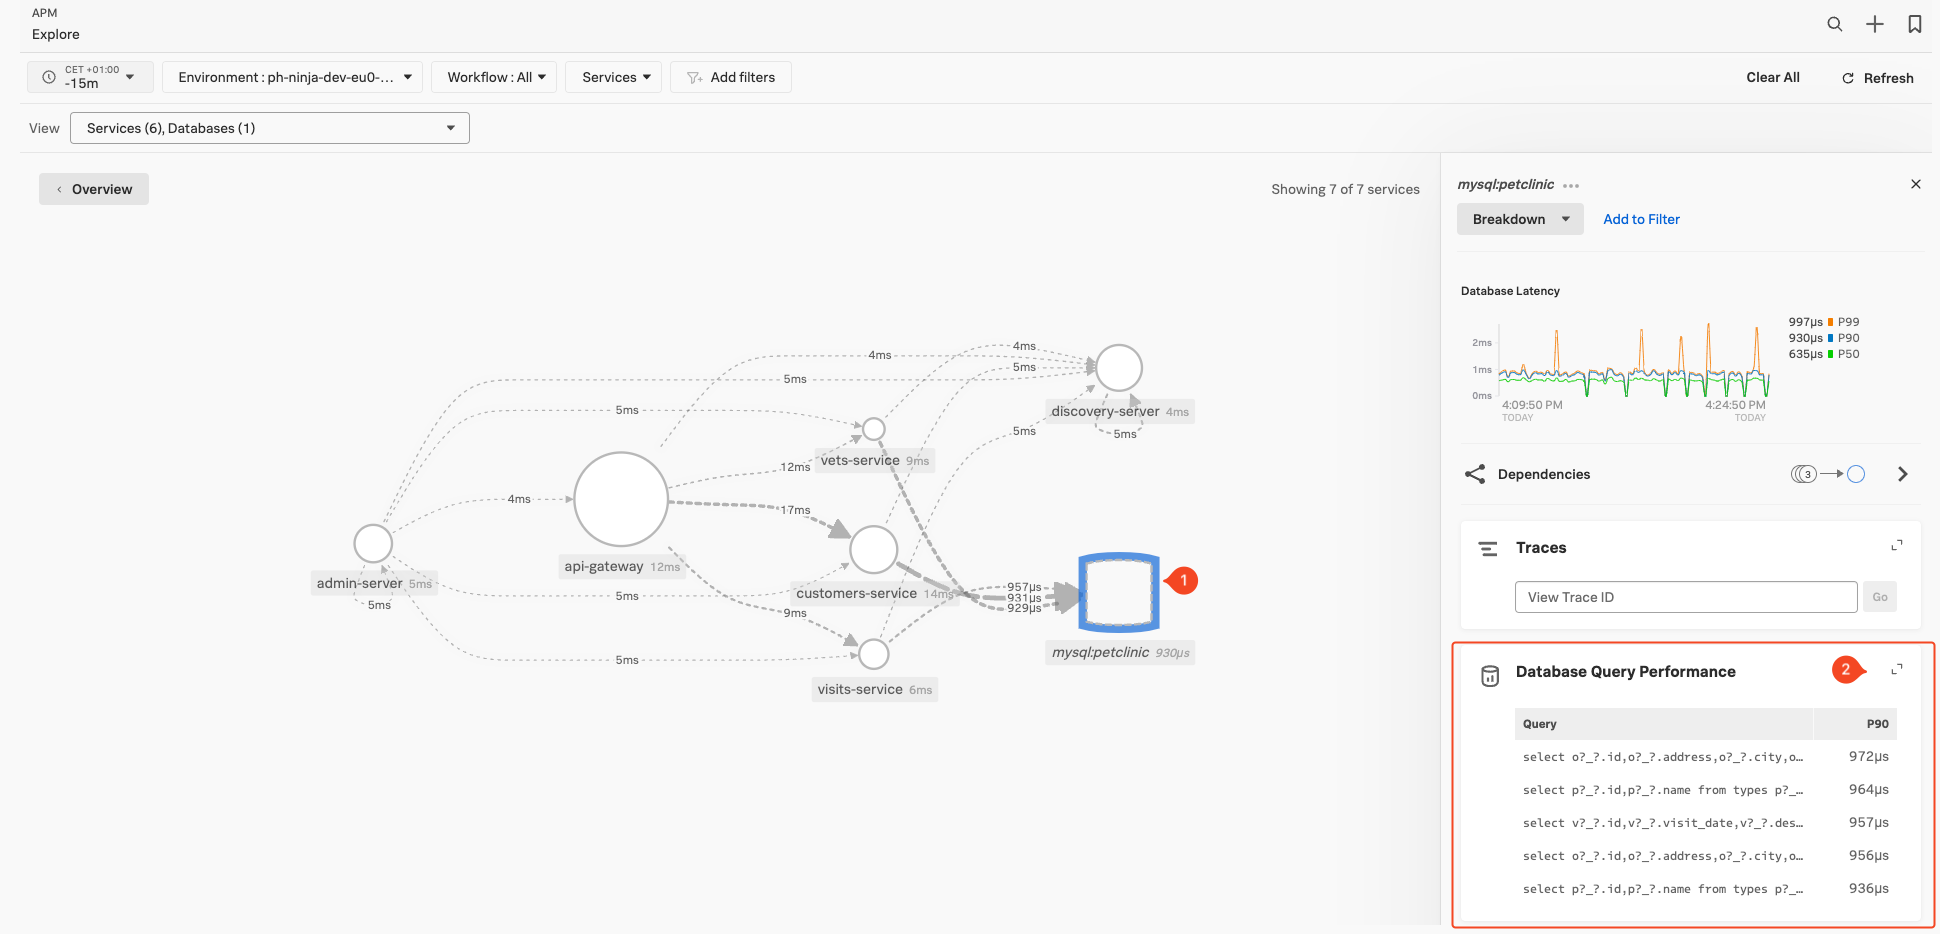
If the service you have selected in the map is indeed an (inferred) database server, this pane will populate with the top 90% (P90) database calls based on duration. To dive deeper into the db-query performance function click somewhere on the word Database Query Performance at the top of the pane.
This will bring us to the DB-query Performance overview screen:
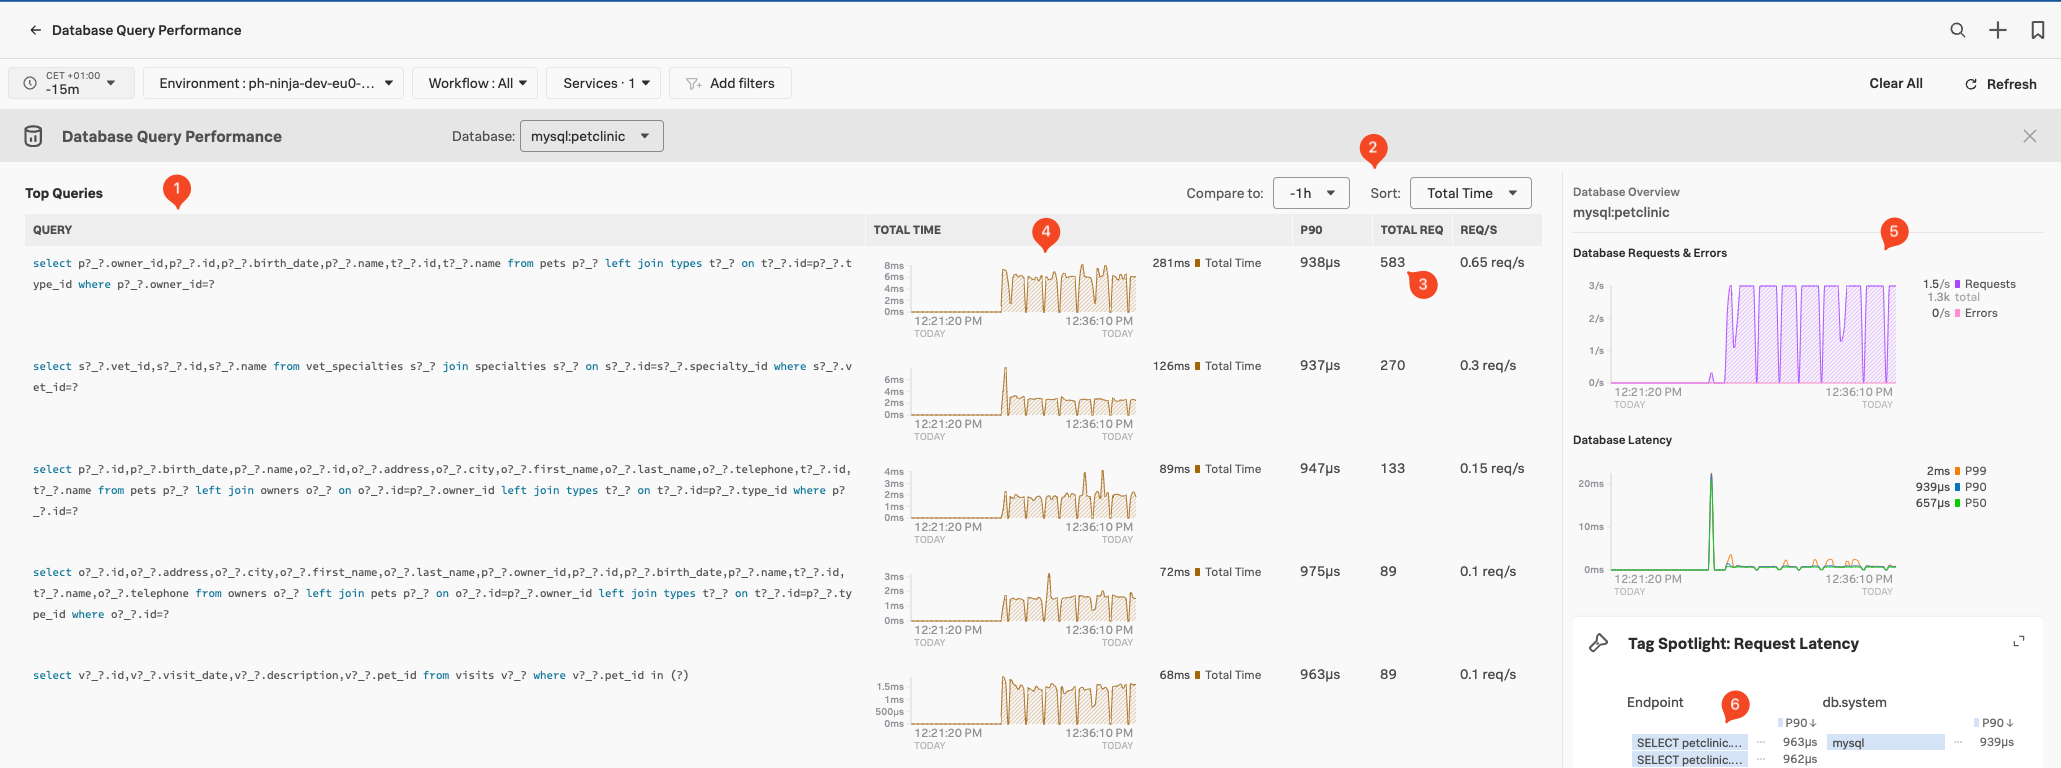
By default, Splunk APM instrumentation sanitizes database queries to remove or mask sensible data, such as secrets or personal identifiable information (PII) from the db.statements. You can find how to turn off database query normalization here.
This screen will show us all the Database queries (1) done towards our database from you application, based on the Traces & Spans send to the Splunk Observability Cloud. Note that you can compare them across a time block or sort them on Total Time, P90 Latency & Requests (2).
For each Database query in the list, we see the hightest latency, the total number of calls during the time window, and the number of request per second (3). This allows you to identify places where you might optimise your queries.
You can select traces containing Database Calls via the two charts in the right hand pane (5). Use the Tag Spotlight pane (6) to drill down what tag are related to the database calls, based on endpoints or tags.
If you click on a specific Query (1) you get a detailed query Details pane appear (2), you can use for more detailed investigations: