Log Observer
1. Introduction
Until this point, we have not touched or changed our code, yet we did receive Trace & Profiling/DB Query performance information. If we want to get more out of our Java application, we can introduce a small change to our application log setup.
This change will configure the Spring PetClinic application to use an Otel-based format to write logs, This will allow the (Auto)-instrumentation to add Otel relevant information into the logs.
The Splunk Log Observer component is used to view the logs and with this information can automatically relate log information with APM Services and Traces. This feature called Related Content will also work with Infrastructure.
Lets grab the actual code for the application now.
2. Downloading the Spring Microservices PetClinic Application
For this exercise, we will use the Spring microservices PetClinic application. This is a very popular sample Java application built with the Spring framework (Springboot) and we are using a version witch actual microservices.
First, clone the PetClinic GitHub repository, as we will need this later in the workshop to compile, build, package and containerize the application:
cd ~;git clone https://github.com/hagen-p/spring-petclinic-microservices.gitThen change into the spring-petclinic directory:
cd ~/spring-petclinic-microservices3. Update Logback config for the services
The Spring PetClinic application can be configured to use several different Java logging libraries. In this scenario, the application is using logback. To make sure we get the OTel information in the logs we need to update a file named logback.xml with the log structure, and add an Otel dependency to the pom.xml of each of the services in the petclinic microservices folders.
First, let’s set the Log Structure/Format:
Spring boot will allow you to set a global template, but for ease of use, we will replace the existing content of the logback-spring.xml files of each service with the following XML content using a prepared script:
Note the following entries that will be added:
- trace_id
- span_id
- trace_flags
- service.name
- deployment.environment These fields allow the Splunk Observability Cloud Suite** to display Related Content when used in a pattern shown below:
  <pattern>
    logback: %d{HH:mm:ss.SSS} [%thread] severity=%-5level %logger{36} - trace_id=%X{trace_id} span_id=%X{span_id} service.name=%property{otel.resource.service.name} trace_flags=%X{trace_flags} - %msg %kvp{DOUBLE}%n
  </pattern>
So let’s run the script that will update the files with the log structure with the format above:
. ~/workshop/petclinic/scripts/update_logback.shOverwritten /home/splunk/spring-petclinic-microservices/spring-petclinic-admin-server/src/main/resources/logback-spring.xml with new XML content.
Overwritten /home/splunk/spring-petclinic-microservices/spring-petclinic-api-gateway/src/main/resources/logback-spring.xml with new XML content.
Overwritten /home/splunk/spring-petclinic-microservices/spring-petclinic-config-server/src/main/resources/logback-spring.xml with new XML content.
Overwritten /home/splunk/spring-petclinic-microservices/spring-petclinic-customers-service/src/main/resources/logback-spring.xml with new XML content.
Overwritten /home/splunk/spring-petclinic-microservices/spring-petclinic-discovery-server/src/main/resources/logback-spring.xml with new XML content.
Overwritten /home/splunk/spring-petclinic-microservices/spring-petclinic-vets-service/src/main/resources/logback-spring.xml with new XML content.
Overwritten /home/splunk/spring-petclinic-microservices/spring-petclinic-visits-service/src/main/resources/logback-spring.xml with new XML content.
Script execution completed.We can verify if the replacement has been successful by examining the spring-logback.xml file from one of the services
cat /home/splunk/spring-petclinic-microservices/spring-petclinic-customers-service/src/main/resources/logback-spring.xml4. Reconfigure and build the services locally
Before we can build the new services with the updated log format we need to add the Opentelemetry dependency tht handles field injection to the Pom.xml of our services:
. ~/workshop/petclinic/scripts/add_otel.shThe Services are now ready to be built, so run the script that will use the maven command to compile/build/package the PetClinic microservices (Note the -P buildDocker, this will build the new containers):
./mvnw clean install -D skipTests -P buildDockerSuccessfully tagged quay.io/phagen/spring-petclinic-api-gateway:latest
[INFO] Built quay.io/phagen/spring-petclinic-api-gateway
[INFO] ------------------------------------------------------------------------
[INFO] Reactor Summary:
[INFO]
[INFO] spring-petclinic-microservices 0.0.1 ............... SUCCESS [ 0.770 s]
[INFO] spring-petclinic-admin-server ...................... SUCCESS [01:03 min]
[INFO] spring-petclinic-customers-service ................. SUCCESS [ 29.031 s]
[INFO] spring-petclinic-vets-service ...................... SUCCESS [ 22.145 s]
[INFO] spring-petclinic-visits-service .................... SUCCESS [ 20.451 s]
[INFO] spring-petclinic-config-server ..................... SUCCESS [ 12.260 s]
[INFO] spring-petclinic-discovery-server .................. SUCCESS [ 14.174 s]
[INFO] spring-petclinic-api-gateway 0.0.1 ................. SUCCESS [ 29.832 s]
[INFO] ------------------------------------------------------------------------
[INFO] BUILD SUCCESS
[INFO] ------------------------------------------------------------------------
[INFO] Total time: 03:14 min
[INFO] Finished at: 2024-01-02T12:43:20Z
[INFO] ------------------------------------------------------------------------Given that Kubernetes needs to pull these freshly built images from somewhere, we are going to store them in the repository we tested earlier. To do this, run the script that will push the newly built containers into our local repository:
. ~/workshop/petclinic/scripts/push_docker.sh The push refers to repository [localhost:5000/spring-petclinic-vets-service]
0391386bcb2a: Preparing
bbb67f51a186: Preparing
105351d0ada3: Preparing
49cfeae6cb9f: Preparing
b4da5101fcde: Preparing
49cfeae6cb9f: Pushed
e742c14be110: Mounted from spring-petclinic-visits-service
540aa741fede: Mounted from spring-petclinic-visits-service
a1dfe59d4939: Mounted from spring-petclinic-visits-service
1e99e92c46bf: Mounted from spring-petclinic-visits-service
f5aa38537736: Mounted from spring-petclinic-visits-service
d2210512edb4: Mounted from spring-petclinic-visits-service
8e87ff28f1b5: Mounted from spring-petclinic-visits-service
local: digest: sha256:42337b2a4ff7d0ac9b7c2cf3c70aa20b7b52d092f1e05d351e031dd7fad956fc size: 3040
The push refers to repository [localhost:5000/spring-petclinic-customers-service]
15d54d9adca8: Preparing
886f6def5b35: Preparing
1575ae90e858: Preparing
ccc884d92d18: Preparing
b4da5101fcde: Preparing
ccc884d92d18: Pushed
e742c14be110: Mounted from spring-petclinic-vets-service
540aa741fede: Mounted from spring-petclinic-vets-service
a1dfe59d4939: Mounted from spring-petclinic-vets-service
1e99e92c46bf: Mounted from spring-petclinic-vets-service
f5aa38537736: Mounted from spring-petclinic-vets-service
d2210512edb4: Mounted from spring-petclinic-vets-service
8e87ff28f1b5: Mounted from spring-petclinic-vets-service
local: digest: sha256:3601c6e7f58224001946058fb0400483fbb8f1b0ea8a6dbaf403c62b4c1908be size: 3042The containers should now be stored in the local repository, lets confirm by checking the catalog,
curl -X GET http://localhost:9999/v2/_catalog The result should be :
{"repositories":["spring-petclinic-admin-server","spring-petclinic-api-gateway","spring-petclinic-config-server","spring-petclinic-customers-service","spring-petclinic-discovery-server","spring-petclinic-vets-service","spring-petclinic-visits-service"]}5. Deploy new services to Kubernetes
To see the changes in effect, we need to redeploy the services, First, let’s change the location of the images from the external repo to the local one by running the following script:
. ~/workshop/petclinic/scripts/set_local.shThe result is a new file on disk called petclinic-local.yaml. Let’s switch to the local versions by using the new version of the deployment yaml. First delete the old containers from the original deployment with:
kubectl delete -f ~/workshop/petclinic/petclinic-local.yamlfollowed by:
kubectl apply -f ~/workshop/petclinic/petclinic-local.yamlThis will cause the containers to be replaced with the local version, you can verify this by checking the containers:
kubectl describe pods api-gateway |grep Image:The resulting output should say localhost:9999 :
Image: localhost:9999/spring-petclinic-api-gateway:localHowever, as we only patched the deployment before, the new deployment does not have the right annotations for zero config auto-instrumentation, so lets fix that now by running the patch command again:
Note, there will be no change for the config-server & discovery-server as they do hav e the annotation included in the deployment.
kubectl get deployments -l app.kubernetes.io/part-of=spring-petclinic -o name | xargs -I % kubectl patch % -p "{\"spec\": {\"template\":{\"metadata\":{\"annotations\":{\"instrumentation.opentelemetry.io/inject-java\":\"default/splunk-otel-collector\"}}}}}"deployment.apps/config-server patched (no change)
deployment.apps/admin-server patched
deployment.apps/customers-service patched
deployment.apps/visits-service patched
deployment.apps/discovery-server patched (no change)
deployment.apps/vets-service patched
deployment.apps/api-gateway patchedLets check the api-gateway container again
kubectl describe pods api-gateway |grep Image:The resulting output should say (again if you see double, its the old container being terminated, give it a few seconds):
  Image:         ghcr.io/signalfx/splunk-otel-java/splunk-otel-java:v1.30.0
  Image:         localhost:9999/spring-petclinic-api-gateway:local
6. View Logs
Once the containers are patched they will be restarted, let’s go back to the Splunk Observability Cloud with the URL provided by the Instructor to check our cluster in the Kubernetes Navigator.
After a couple of minutes or so you should see that the Pods are being restarted by the operator and the Zero config container will be added. This will look similar to the screenshot below:
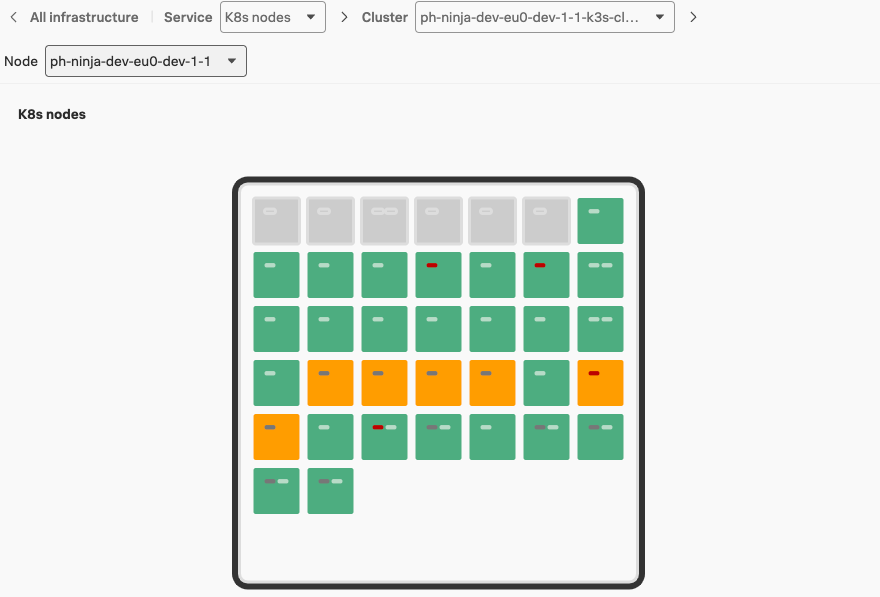
Wait for the pods to turn green again.(You may want to refresh the screen), then from the left-hand menu click on Log Observer ![]()
![]() and ensure Index is set to splunk4rookies-workshop.
and ensure Index is set to splunk4rookies-workshop.
Next, click Add Filter search for the field deployment.environment and select the value of rou Workshop (Remember the INSTANCE value ?) and click = (include). You should now see only the log messages from your PetClinic application.
Next search for the field service_name select the value customers-service and click = (include). Now the log files should be reduce to just the lines from your customers-service.
Wait for Log Lines to show up with an injected trace-id like trace_id=08b5ce63e46ddd0ce07cf8cfd2d6161a as show below (1):
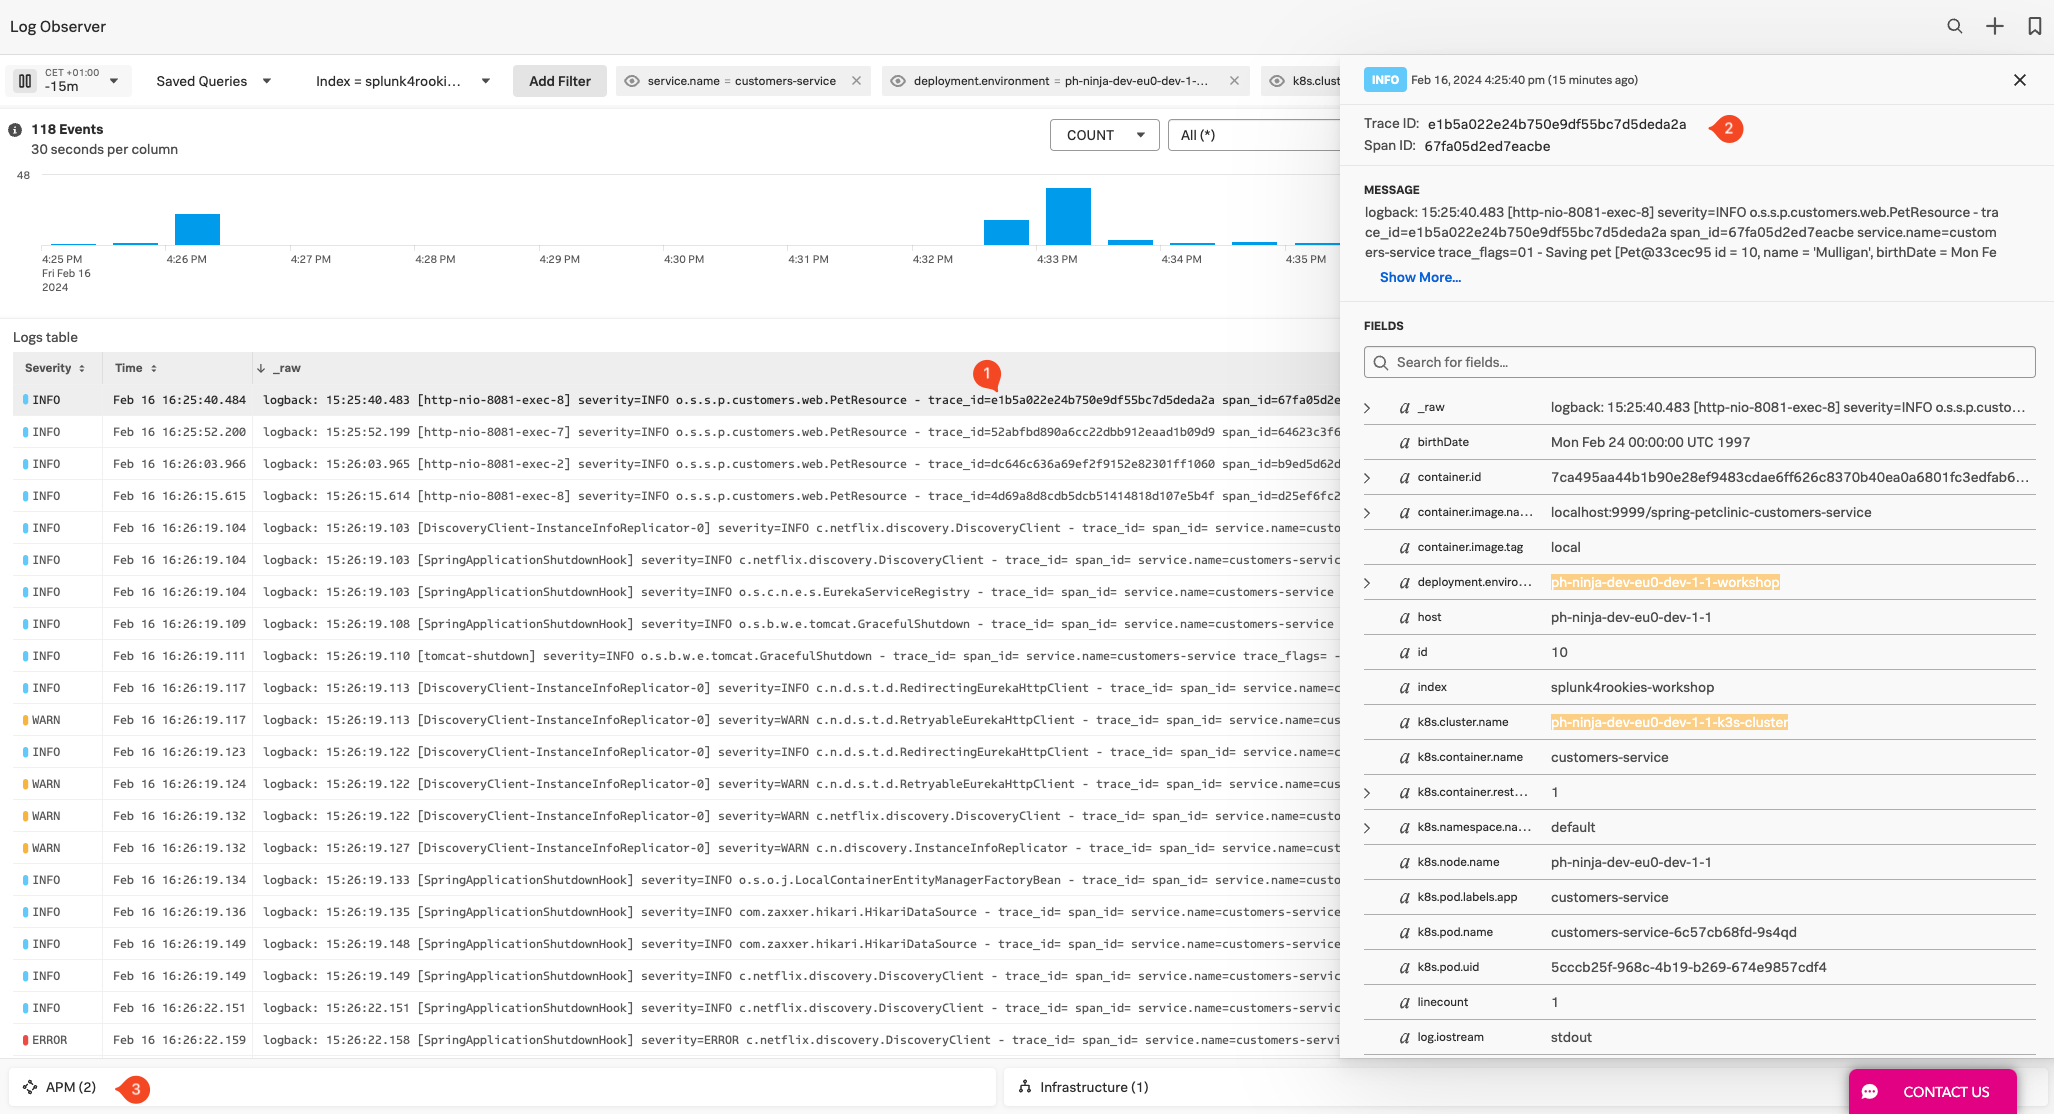
Click on a line with an injected trace_id, this should be all log lines created by your services that are part of a trace (1). A Side pane opens where you can see the related information about your logs. including the relevant Trace and Span Id’s (2).
Also, at the bottom next to APM, there should be a number, this is the number of related AP Content items for this log line. click on the APM pane (1) as show below:
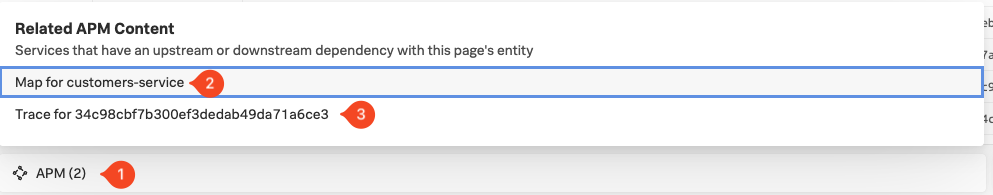
- The Map for customers-service (2) brings us to the APM dependency map with the workflow focused on Customer Services, allowing you to quick understand how this log line is related to the overall flow of service interaction.
- The Trace for 34c98cbf7b300ef3dedab49da71a6ce3 (3) will bring us to the waterfall in APM for this specific trace that this log line was generated in.
As a last exercise, click on the Trace for Link, this will bering you to the waterfall for this specific trace:
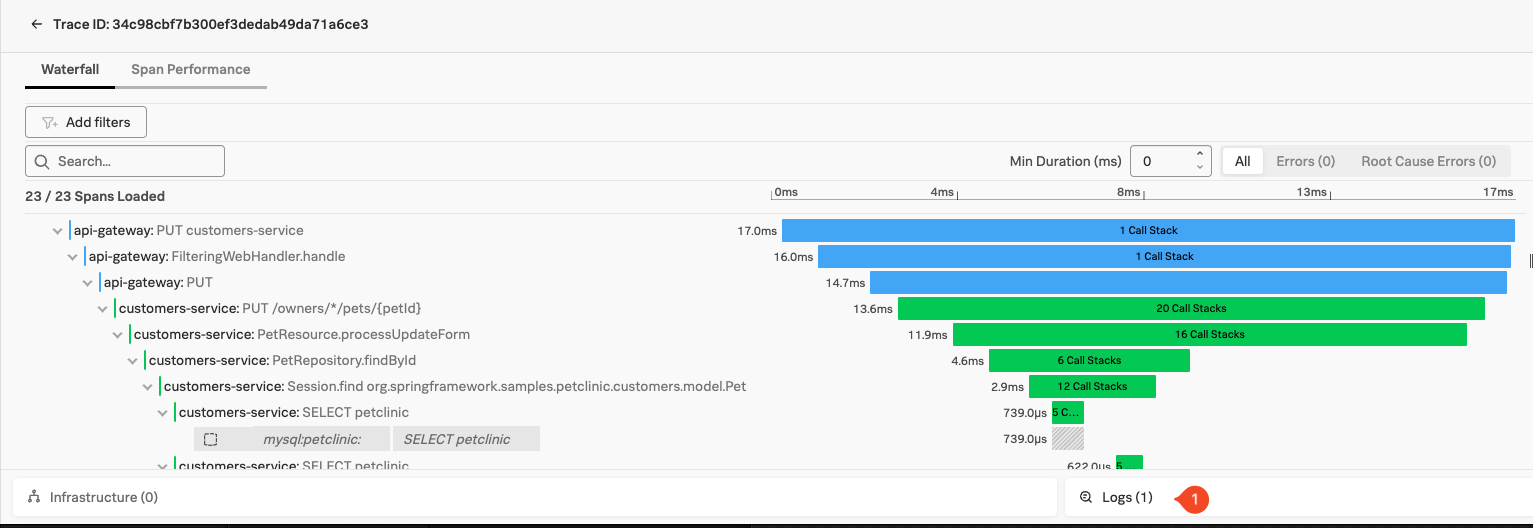
Note that you now have Logs Related Content Pane (1) appear, clicking on this will bring you back to log observer with all the logs line that are part of this Trace. This will help you to quickly find relevant log lines for an interaction or a problem.
7. Summary
This is the end of the workshop and we have certainly covered a lot of ground. At this point, you should have metrics, traces, logs, database query performance and code profiling being reported into Splunk Observability Cloud.
Congratulations!