Deploying the OpenTelemetry Collector in Kubernetes using a NameSpace
1. Kubernetes Navigator 2.0 UI
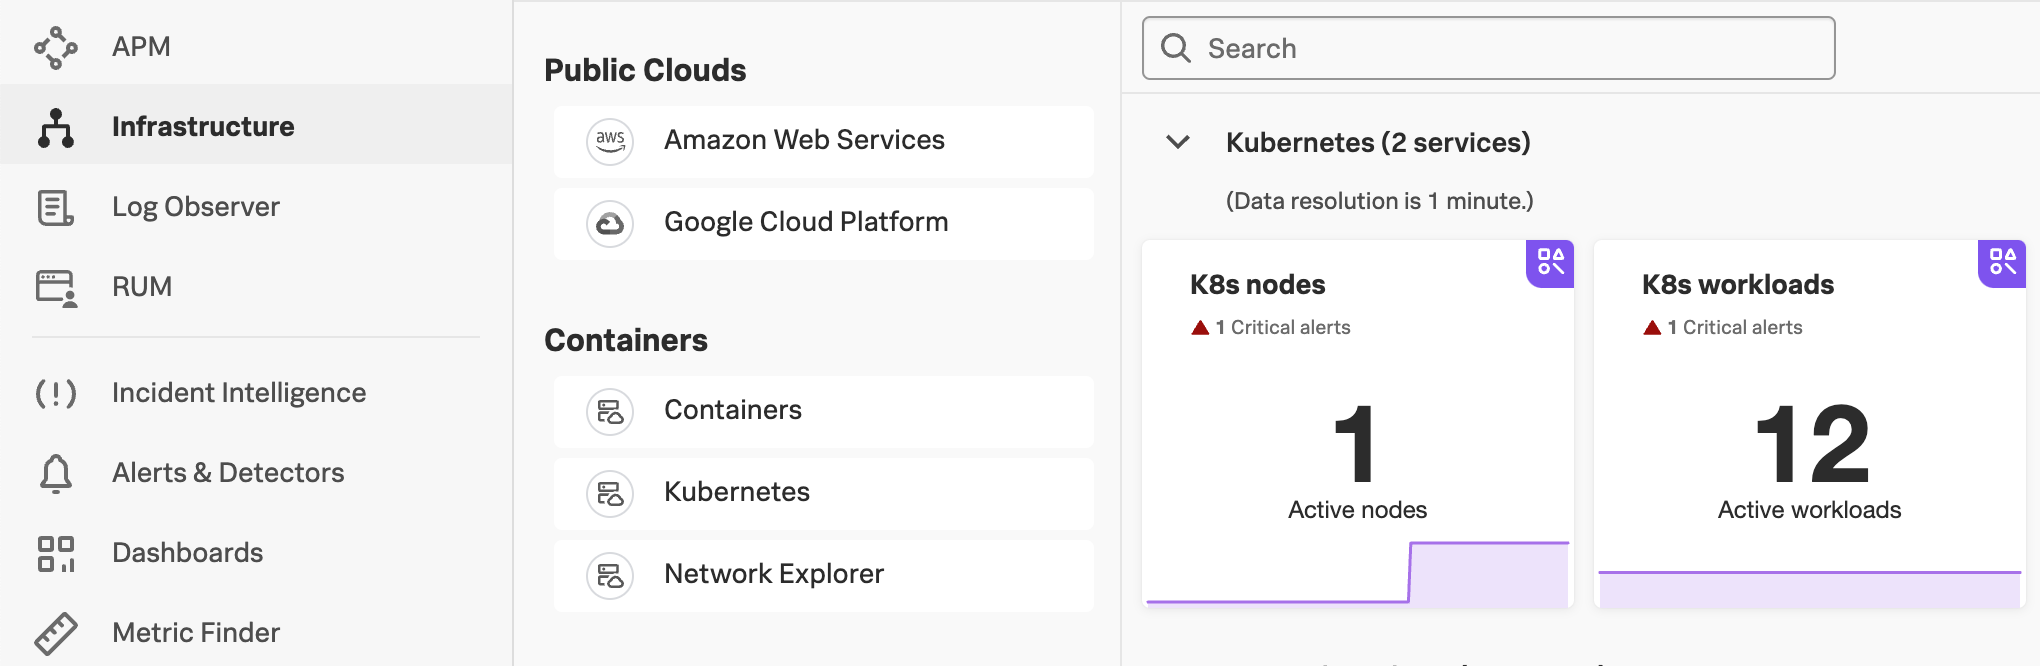
We will be starting this workshop using the new Kubernetes Navigator so please check that you are already using the new Navigator.
When you select Infrastructure from the main menu on the left, followed by selecting Kubernetes, you should see two service panes (K8s nodes and K8s workloads) for Kubernetes, similar to the ones below:
2. Connect to EC2 instance
You will be able to connect to the workshop instance by using SSH from your Mac, Linux or Windows device. Open the link to the sheet provided by your instructor. This sheet contains the IP addresses and the password for the workshop instances.
Your workshop instance has been pre-configured with the correct Access Token and Realm for this workshop. There is no need for you to configure these.
3. Install Splunk OTel using Helm
Install the OpenTelemetry Collector using the Splunk Helm chart. First, add the Splunk Helm chart repository and update.
helm repo add splunk-otel-collector-chart https://signalfx.github.io/splunk-otel-collector-chart && helm repo updateUsing ACCESS_TOKEN=<REDACTED>
Using REALM=eu0
"splunk-otel-collector-chart" has been added to your repositories
Using ACCESS_TOKEN=<REDACTED>
Using REALM=eu0
Hang tight while we grab the latest from your chart repositories...
...Successfully got an update from the "splunk-otel-collector-chart" chart repository
Update Complete. ⎈Happy Helming!⎈Install the OpenTelemetry Collector Helm with the following commands, do NOT edit this:
helm install splunk-otel-collector \
--set="splunkObservability.realm=$REALM" \
--set="splunkObservability.accessToken=$ACCESS_TOKEN" \
--set="clusterName=$INSTANCE-k3s-cluster" \
--set="splunkObservability.logsEnabled=false" \
--set="logsEngine=otel" \
--set="splunkObservability.infrastructureMonitoringEventsEnabled=true" \
--set="splunkPlatform.endpoint=$HEC_URL" \
--set="splunkPlatform.token=$HEC_TOKEN" \
--set="splunkPlatform.index=splunk4rookies-workshop" \
splunk-otel-collector-chart/splunk-otel-collector \
-f ~/workshop/k3s/otel-collector.yaml
5. Verify Deployment
You can monitor the progress of the deployment by running kubectl get pods which should typically report that the new pods are up and running after about 30 seconds.
Ensure the status is reported as Running before continuing.
kubectl get podsNAME READY STATUS RESTARTS AGE
splunk-otel-collector-agent-pvstb 2/2 Running 0 19s
splunk-otel-collector-k8s-cluster-receiver-6c454894f8-mqs8n 1/1 Running 0 19sUse the label set by the helm install to tail logs (You will need to press ctrl + c to exit).
kubectl logs -l app=splunk-otel-collector -f --container otel-collectorOr use the installed k9s terminal UI.
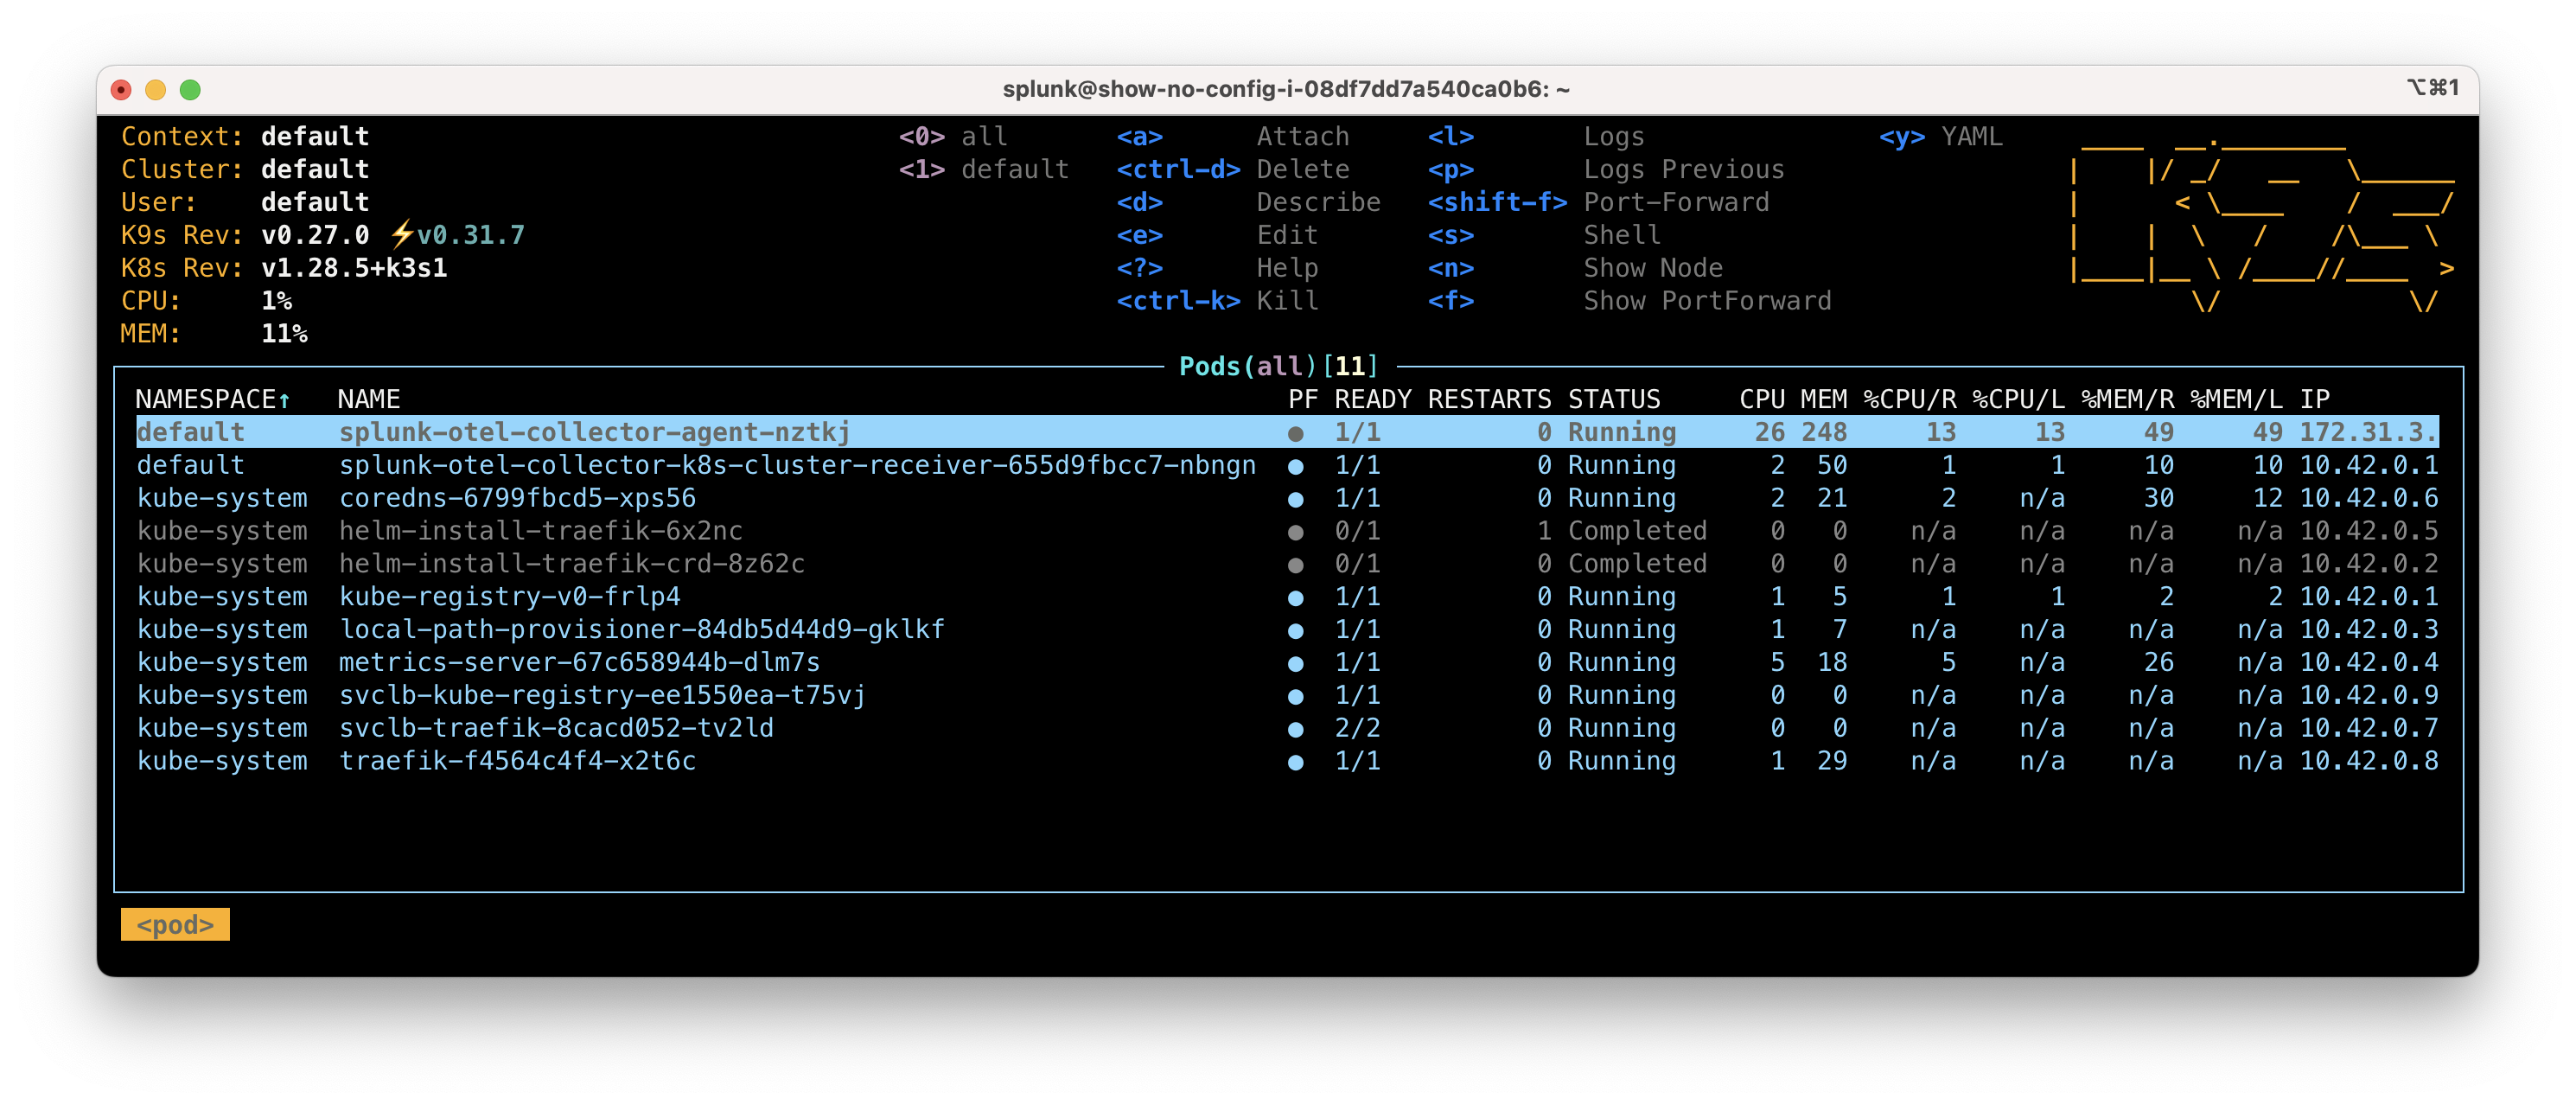
If you make an error installing the Splunk OpenTelemetry Collector you can start over by deleting the installation using:
helm delete splunk-otel-collector