Tour of the Kubernetes Navigator
1. Cluster vs Workload View
The Kubernetes Navigator offers you two separate use cases to view your Kubernetes data.
- The K8s workloads are focusing on providing information in regards to workloads a.k.a. your deployments.
- The K8s nodes are focusing on providing insight into the performance of clusters, nodes, pods and containers.
You will initially select either view depending on your need (you can switch between the view on the fly if required). The most common one we will use in this workshop is the workload view and we will focus on that specifically.
1.1 Finding your K8s Cluster Name
Your first task is to identify and find your cluster. The cluster will be named as determined by the preconfigured environment variable INSTANCE. To confirm the cluster name enter the following command in your terminal:
echo $INSTANCE-k3s-clusterPlease make a note of your cluster name as you will need this later in the workshop for filtering.
2. Workloads & Workload Details Pane
Go to the Infrastructure page in the Observability UI and select Kubernetes, this will offer you a set of Kubernetes services, one of them being the K8s workloads pane.
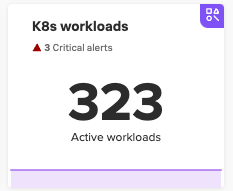
The pane will show a tiny graph giving you a bird’s eye view of the load being handled across those Workloads. Also, if there are any alerts for one of the workloads, you will see a small alert indicator as shown in the image below.
Click on the K8s workloads pane and you will be taken to the workload view.
Initially, you will see all the workloads for all clusters that are reported into your Observability Cloud Org. If an alert has fired for any of the workloads, it will be highlighted on the top right (as marked with a red stripe) in the image below. You can go directly to the alert by clicking it to expand it.
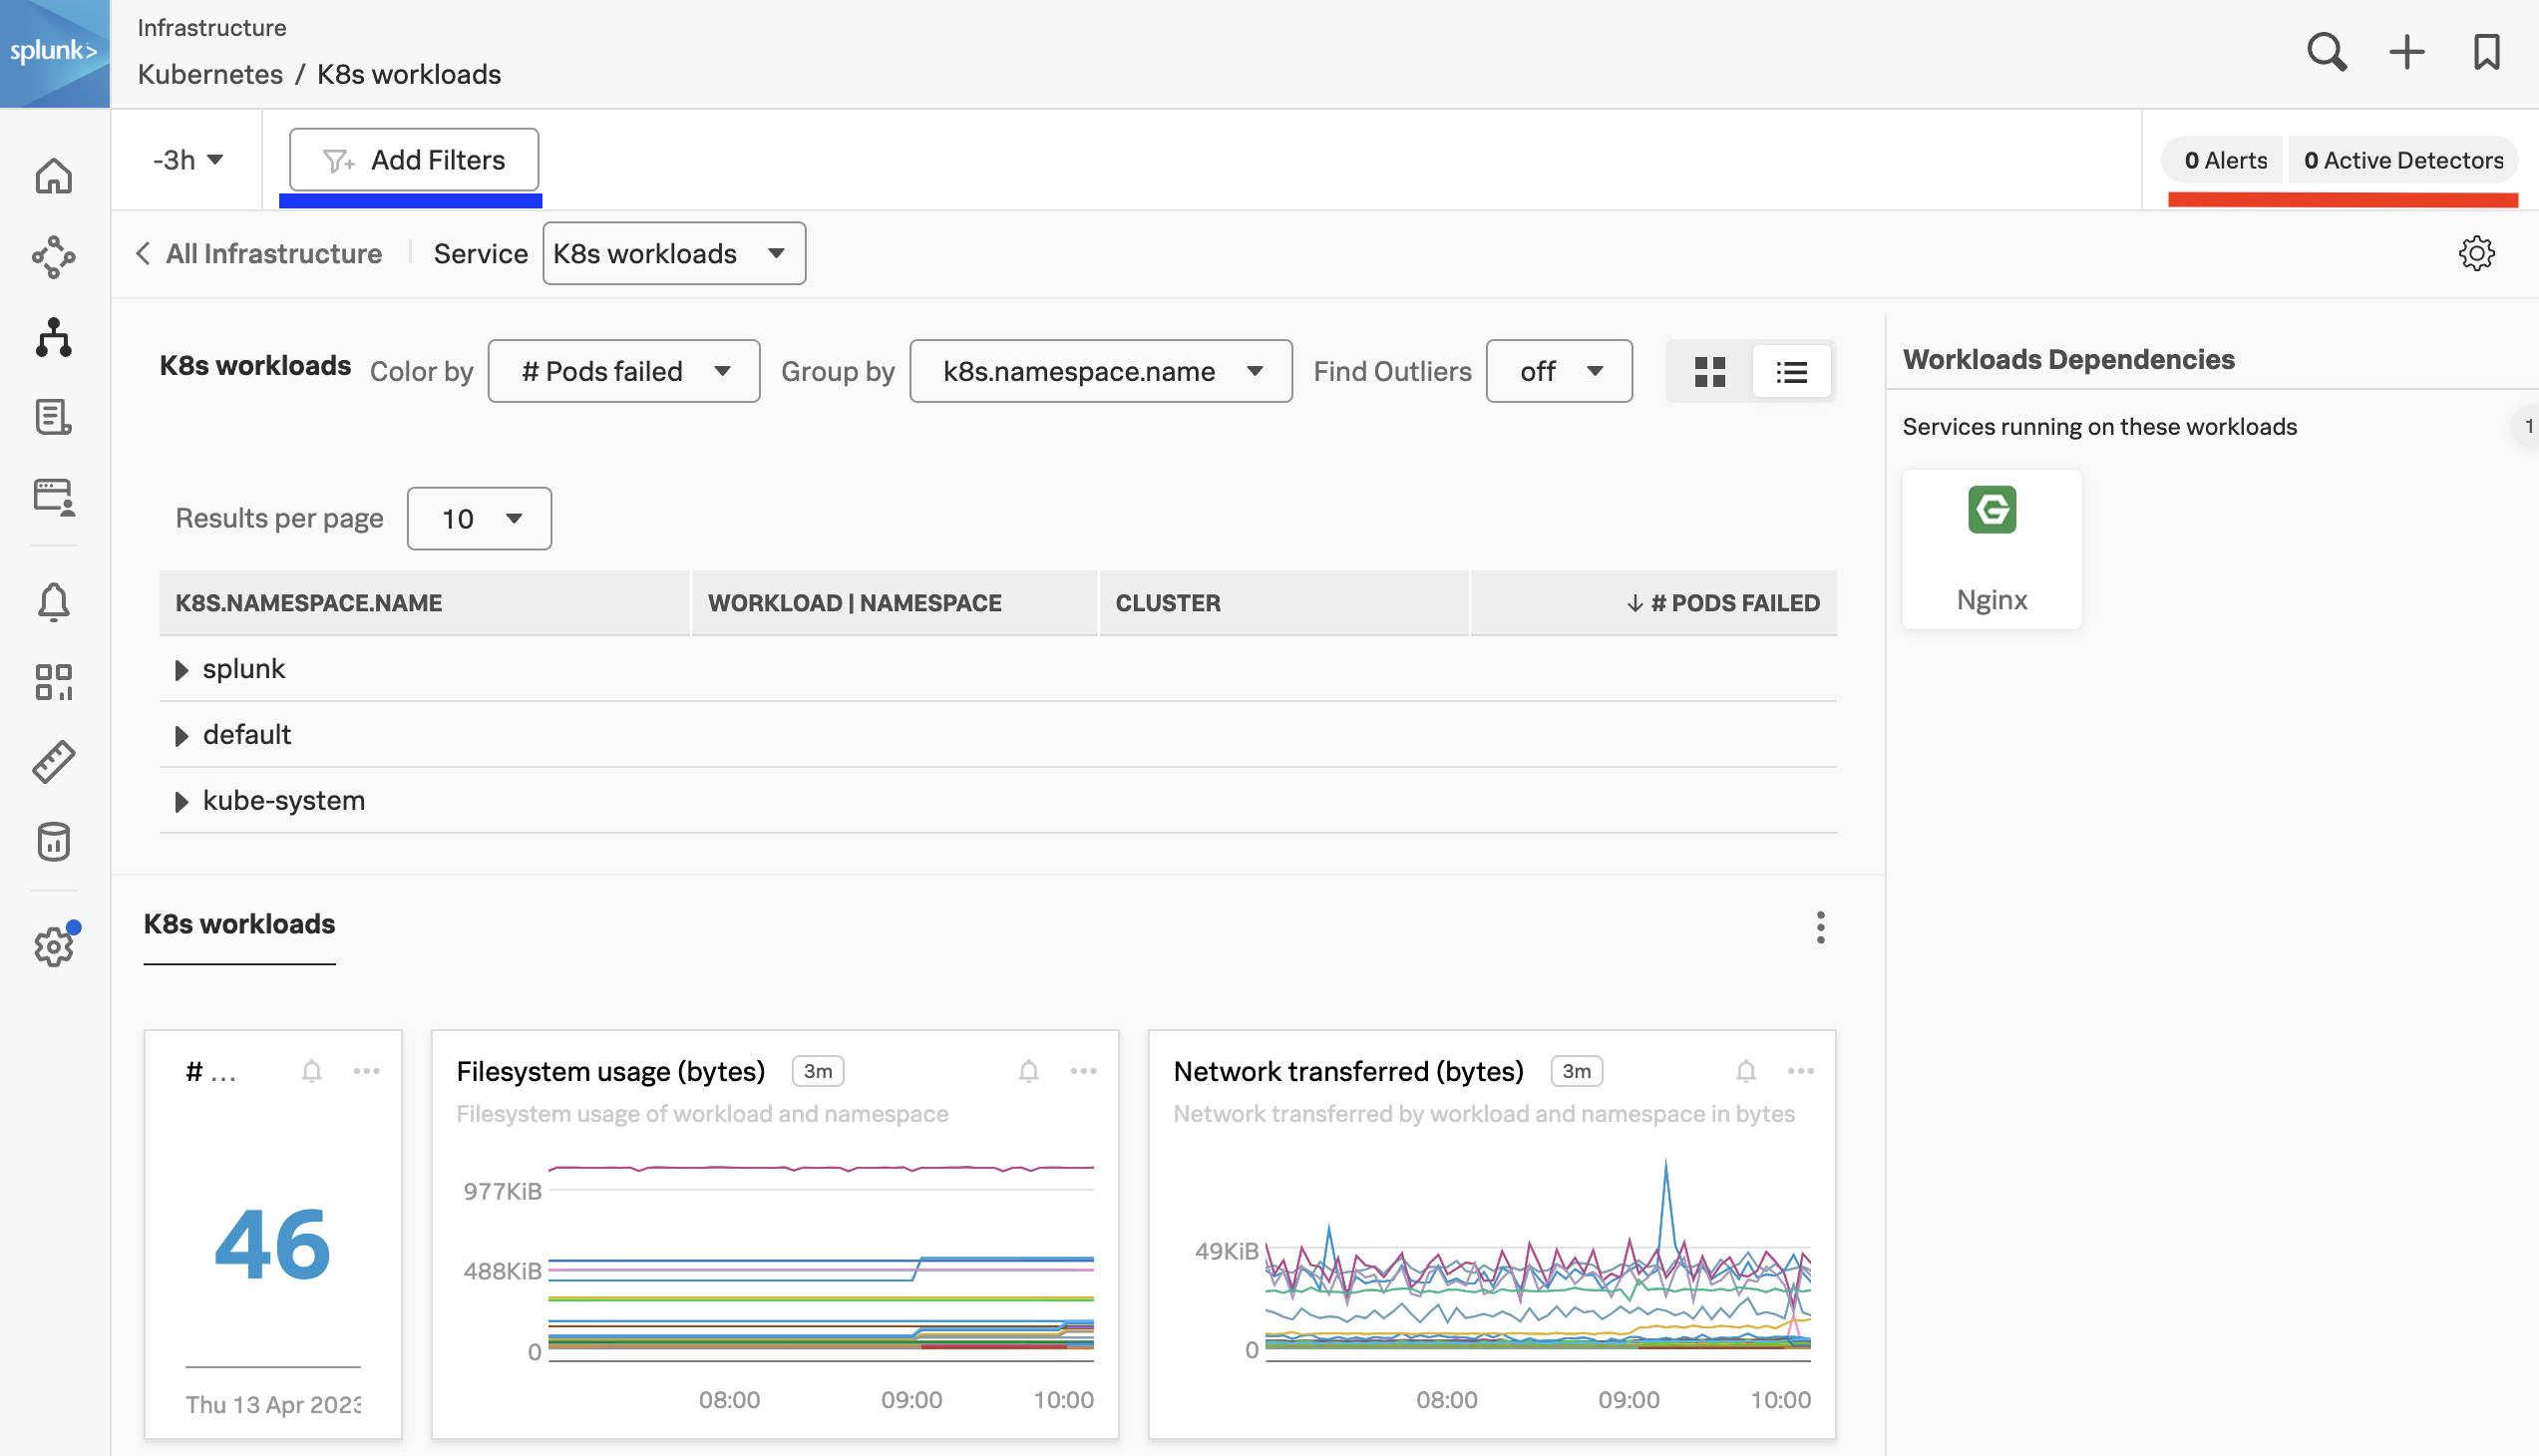
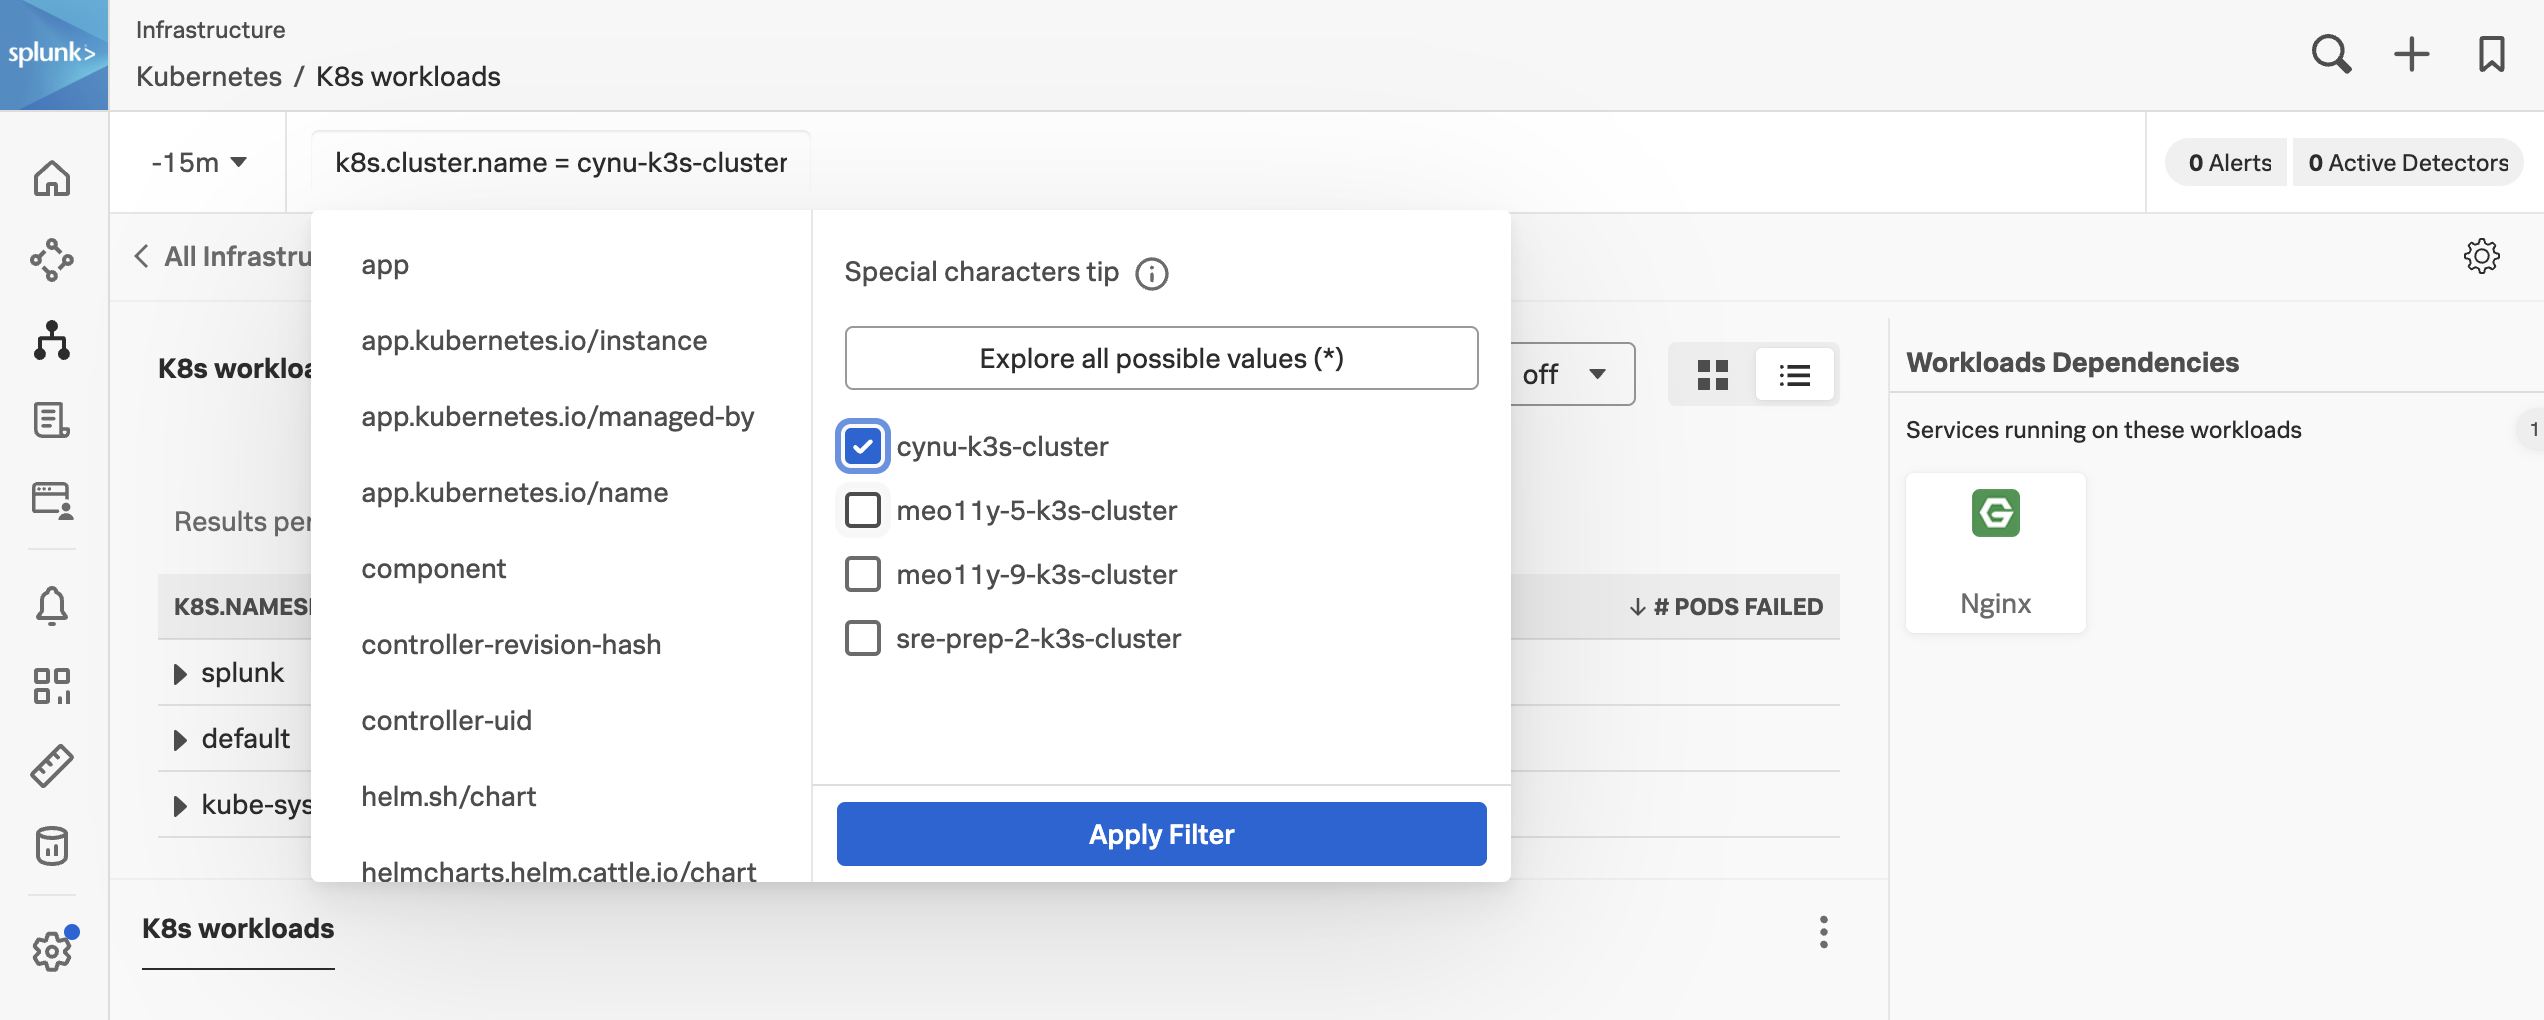
Now, let’s find your cluster by filtering on the field k8s.cluster.name in the filter toolbar (as marked with a blue stripe).
You can enter a partial name into the search box, such as emea-ws-7*, to quickly find your Cluster.
Also, it’s a very good idea to switch the default time from the default -4h back to the last 15 minutes (-15m).
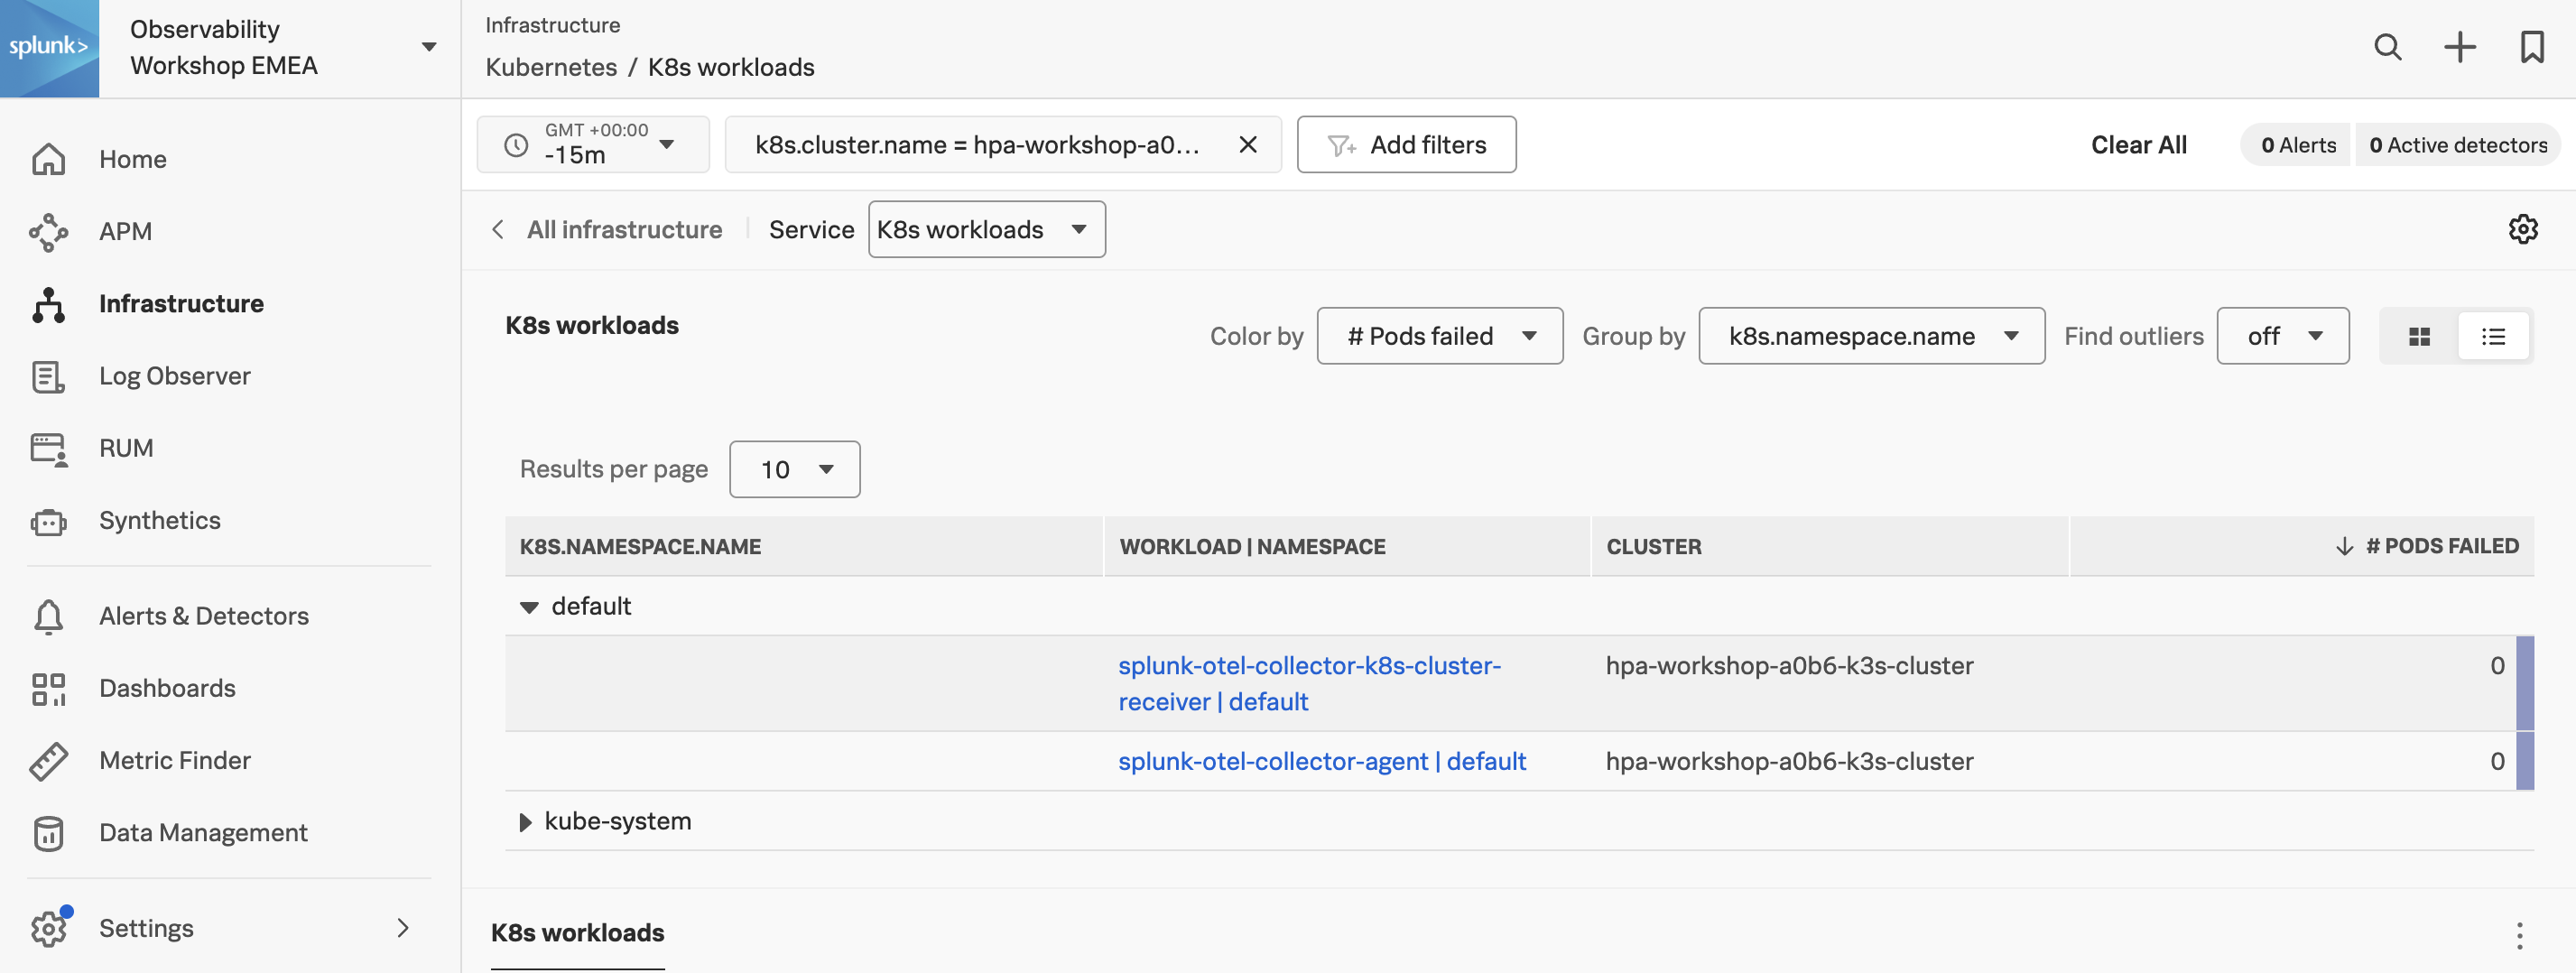
You should now just see information for your own cluster.
How many workloads are running & how many namespaces are in your Cluster?
2.1 Using the Navigator Selection Chart
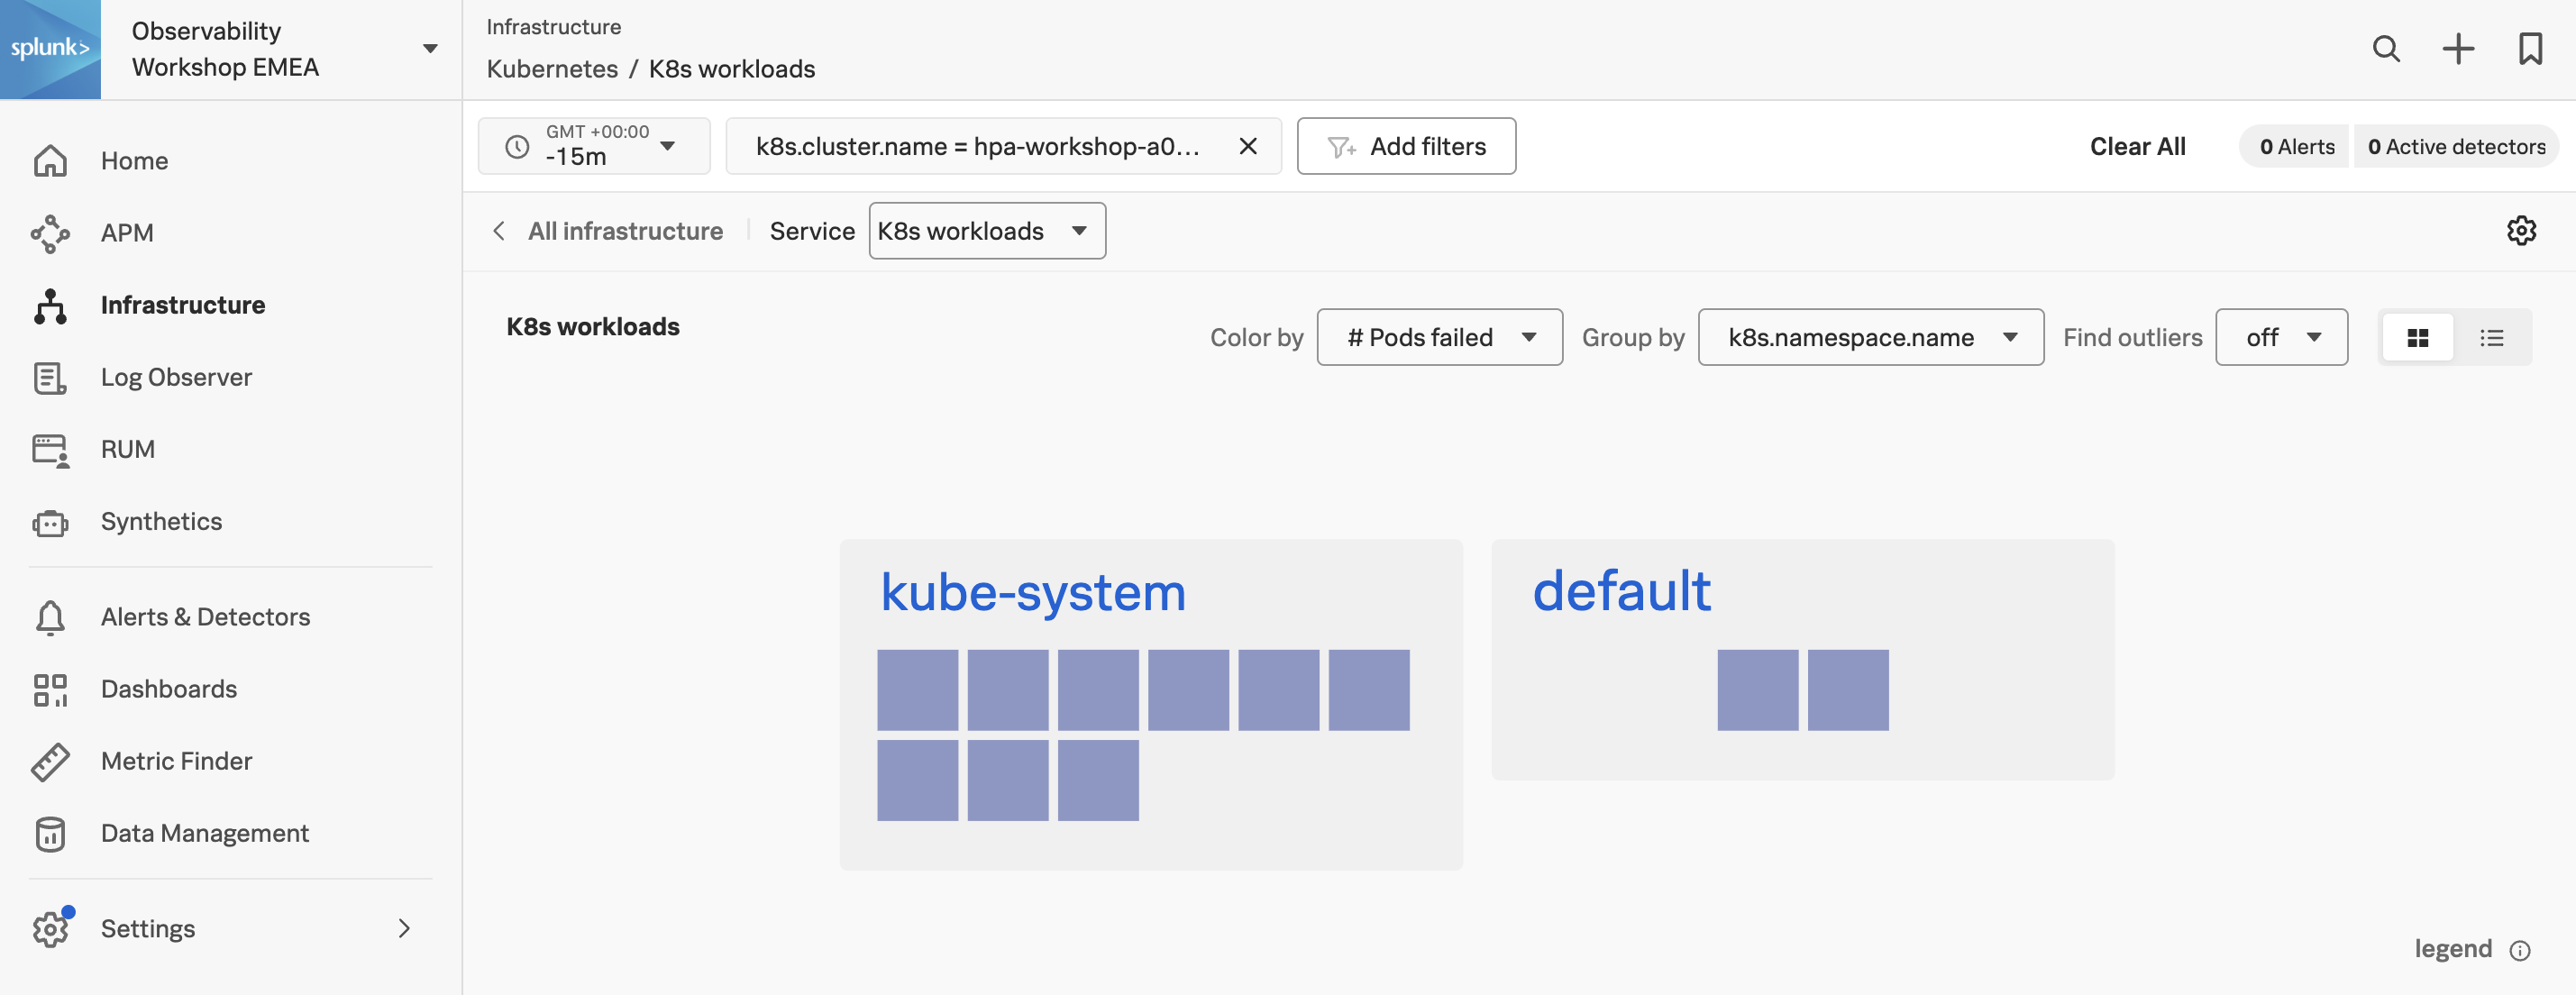
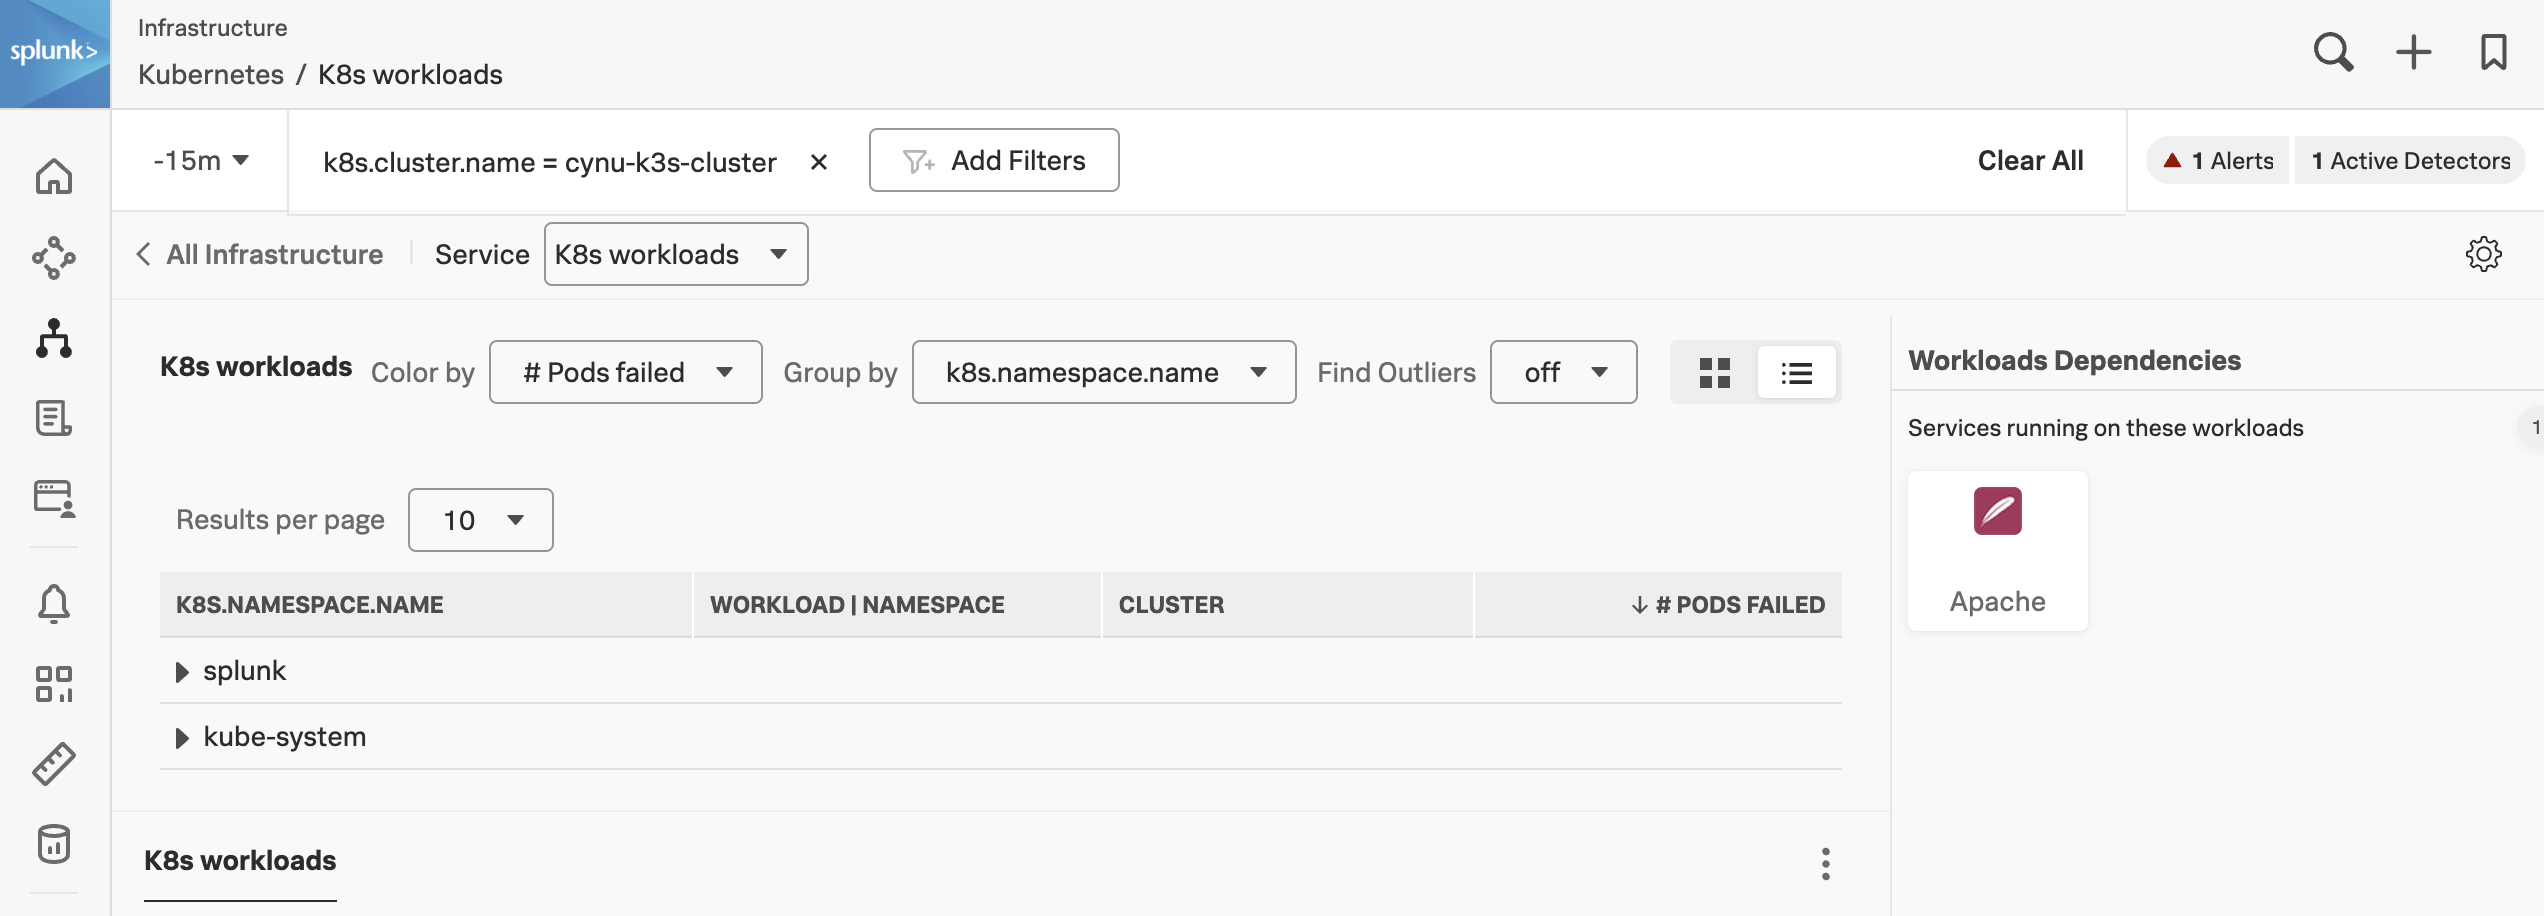
The K8s workloads table is a common feature used across most of the Navigators and will offer you a list view of the data you are viewing. In our case, it shows a list of Pods Failed grouped by k8s.namespace.name.
Now let’s change the list view to a heat map view by selecting either the Heat map icon or the List icon in the upper-right corner of the screen (as marked with the purple line).
Changing this option will result in the following visualization:
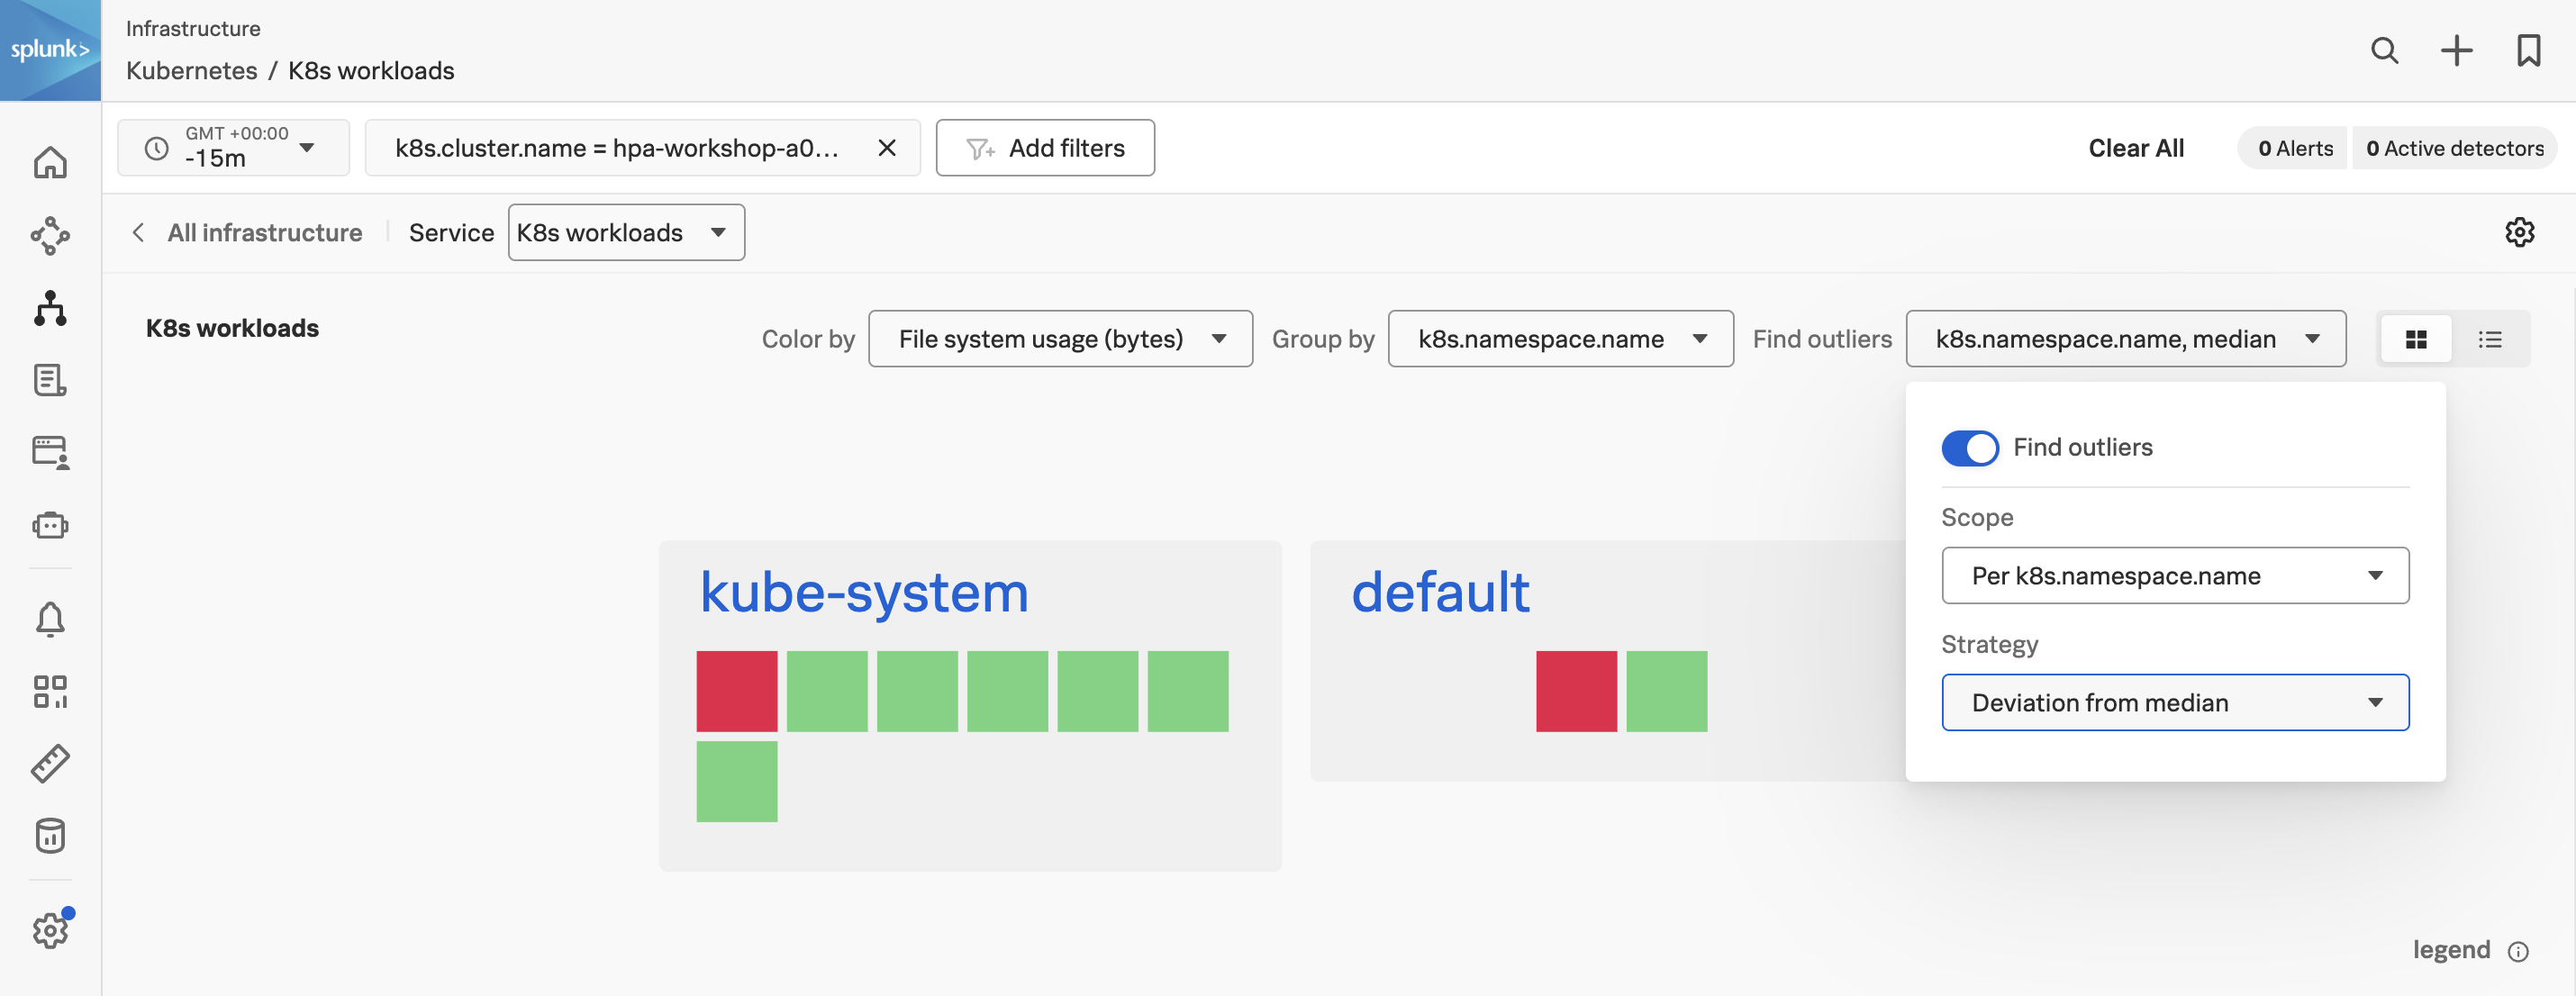
In this view, you will note that each workload is now a colored square. These squares will change color according to the Color by option you selected, as marked by the first green line in the image above. The colors give a visual indication of health and/or usage. You can check the meaning by hovering over the legend exclamation icon bottom right of the heatmaps.
Another valuable option in this screen is Find Outliers which provides historical analytics of your clusters based on what is selected in the Color by dropdown.
Now, let’s select the File system usage (bytes) from the Color by drop-down box, then click on the Find outliers drop-down as marked by a yellow line in the above image and make sure you change the Scope in the dialog to Per k8s.namespace.name and Deviation from Median as below:
The Find Outliers view is very useful when you need to view a selection of your workloads (or any service depending on the Navigator used) and quickly need to figure out if something has changed.
It will give you fast insight into items (workloads in our case) that are performing differently (both increased or decreased) which helps to make it easier to spot problems.
2.2 The Deployment Overview pane
The Deployment Overview pane gives you a quick insight into the status of your deployments. You can see at once if the pods of your deployments are Pending, Running, Succeeded, Failed or in an Unknown state.
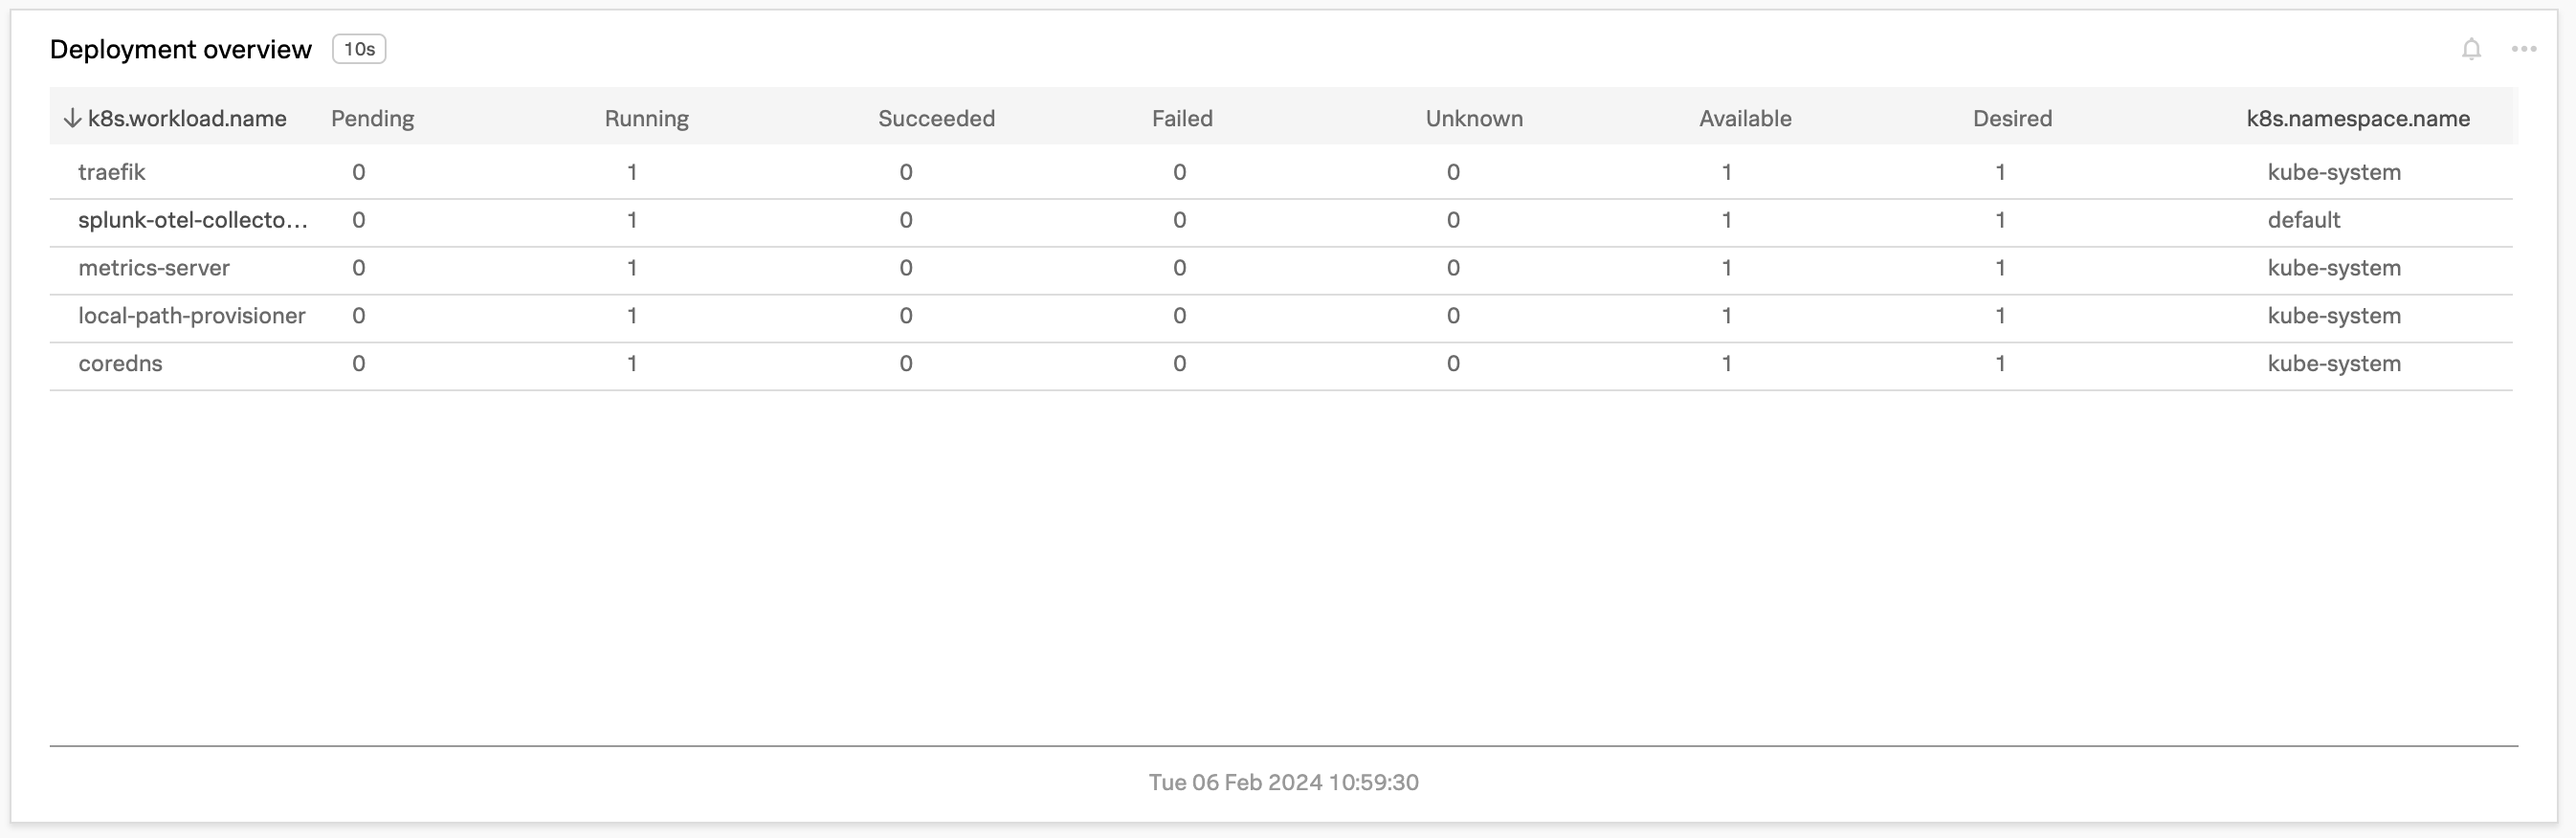
- Running: Pod is deployed and in a running state
- Pending: Waiting to be deployed
- Succeeded: Pod has been deployed and completed its job and is finished
- Failed: Containers in the pod have run and returned some kind of error
- Unknown: Kubernetes isn’t reporting any of the known states. (This may be during the starting or stopping of pods, for example).
You can expand the Workload name by hovering your mouse on it, in case the name is longer than the chart allows.
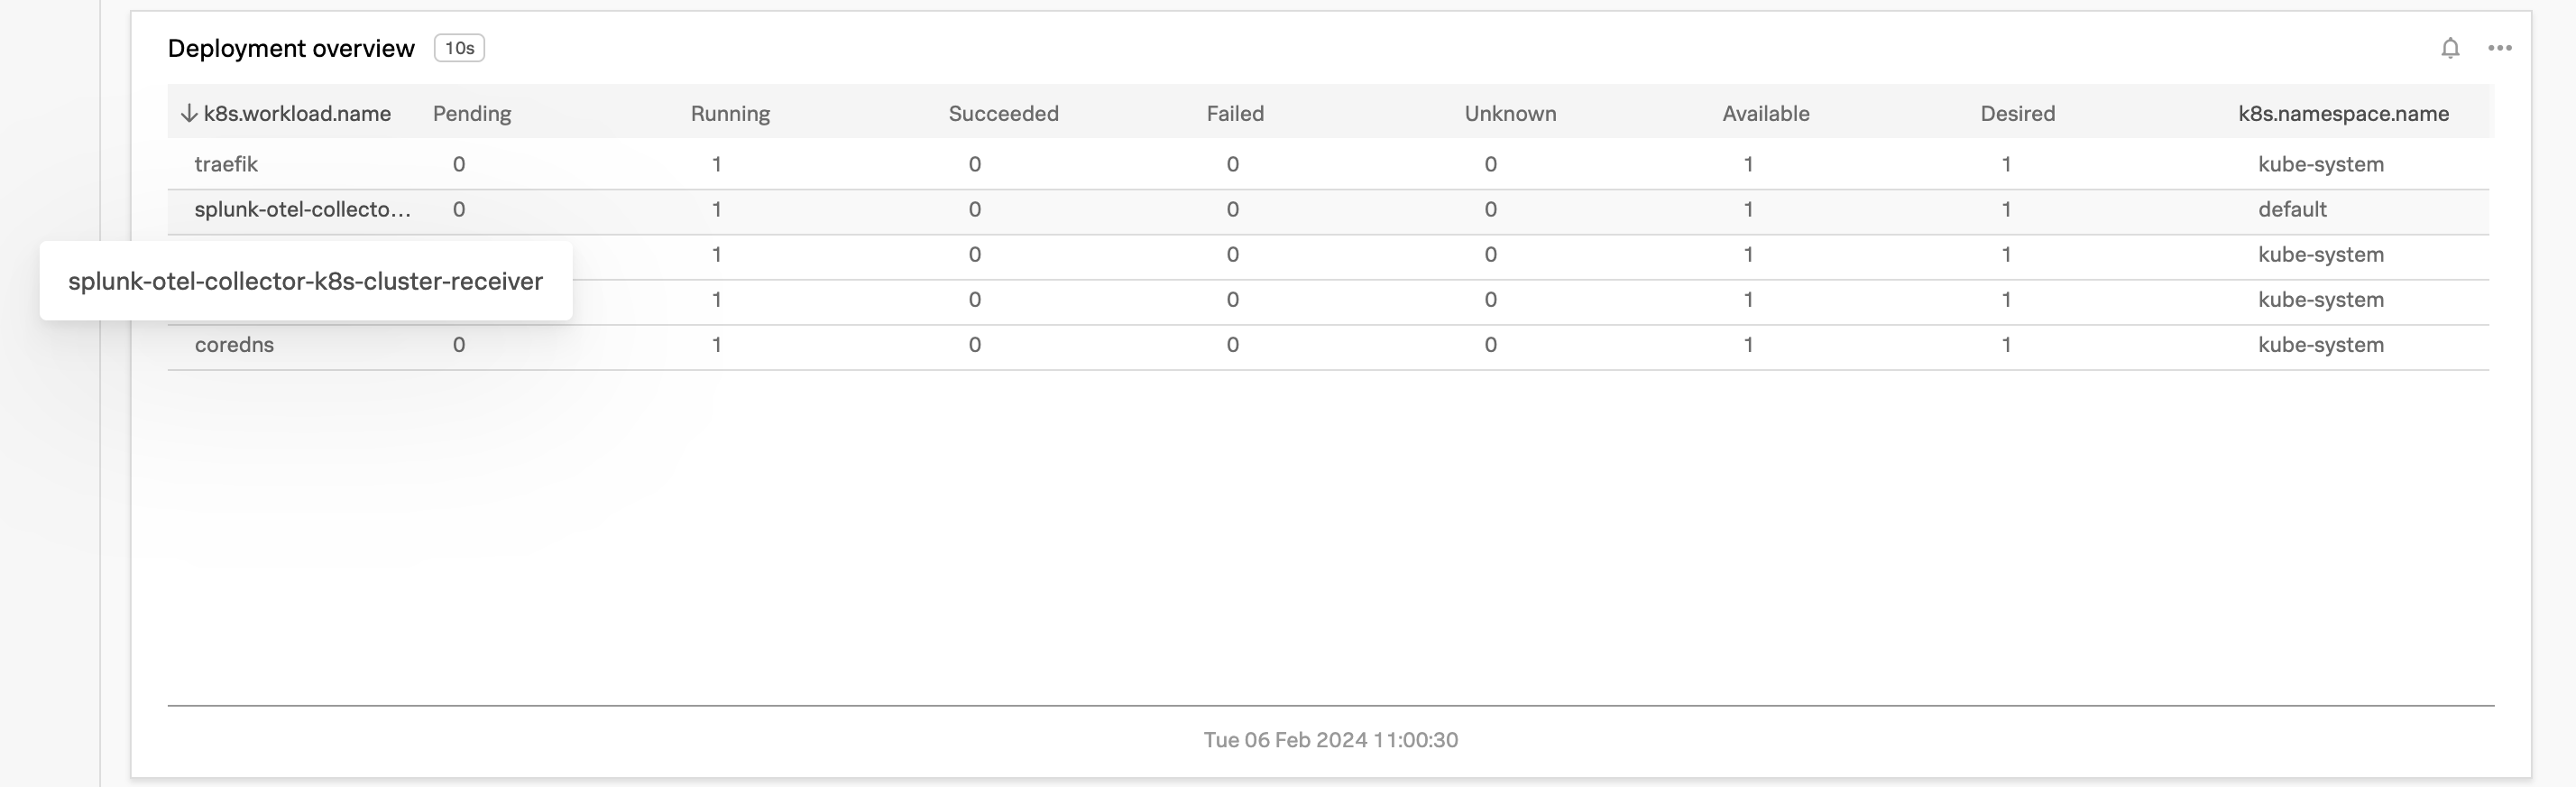
To filter to a specific workload, you can click on three dots … next to the workload name in the k8s.workload.name column and choose Filter from the dropdown box.
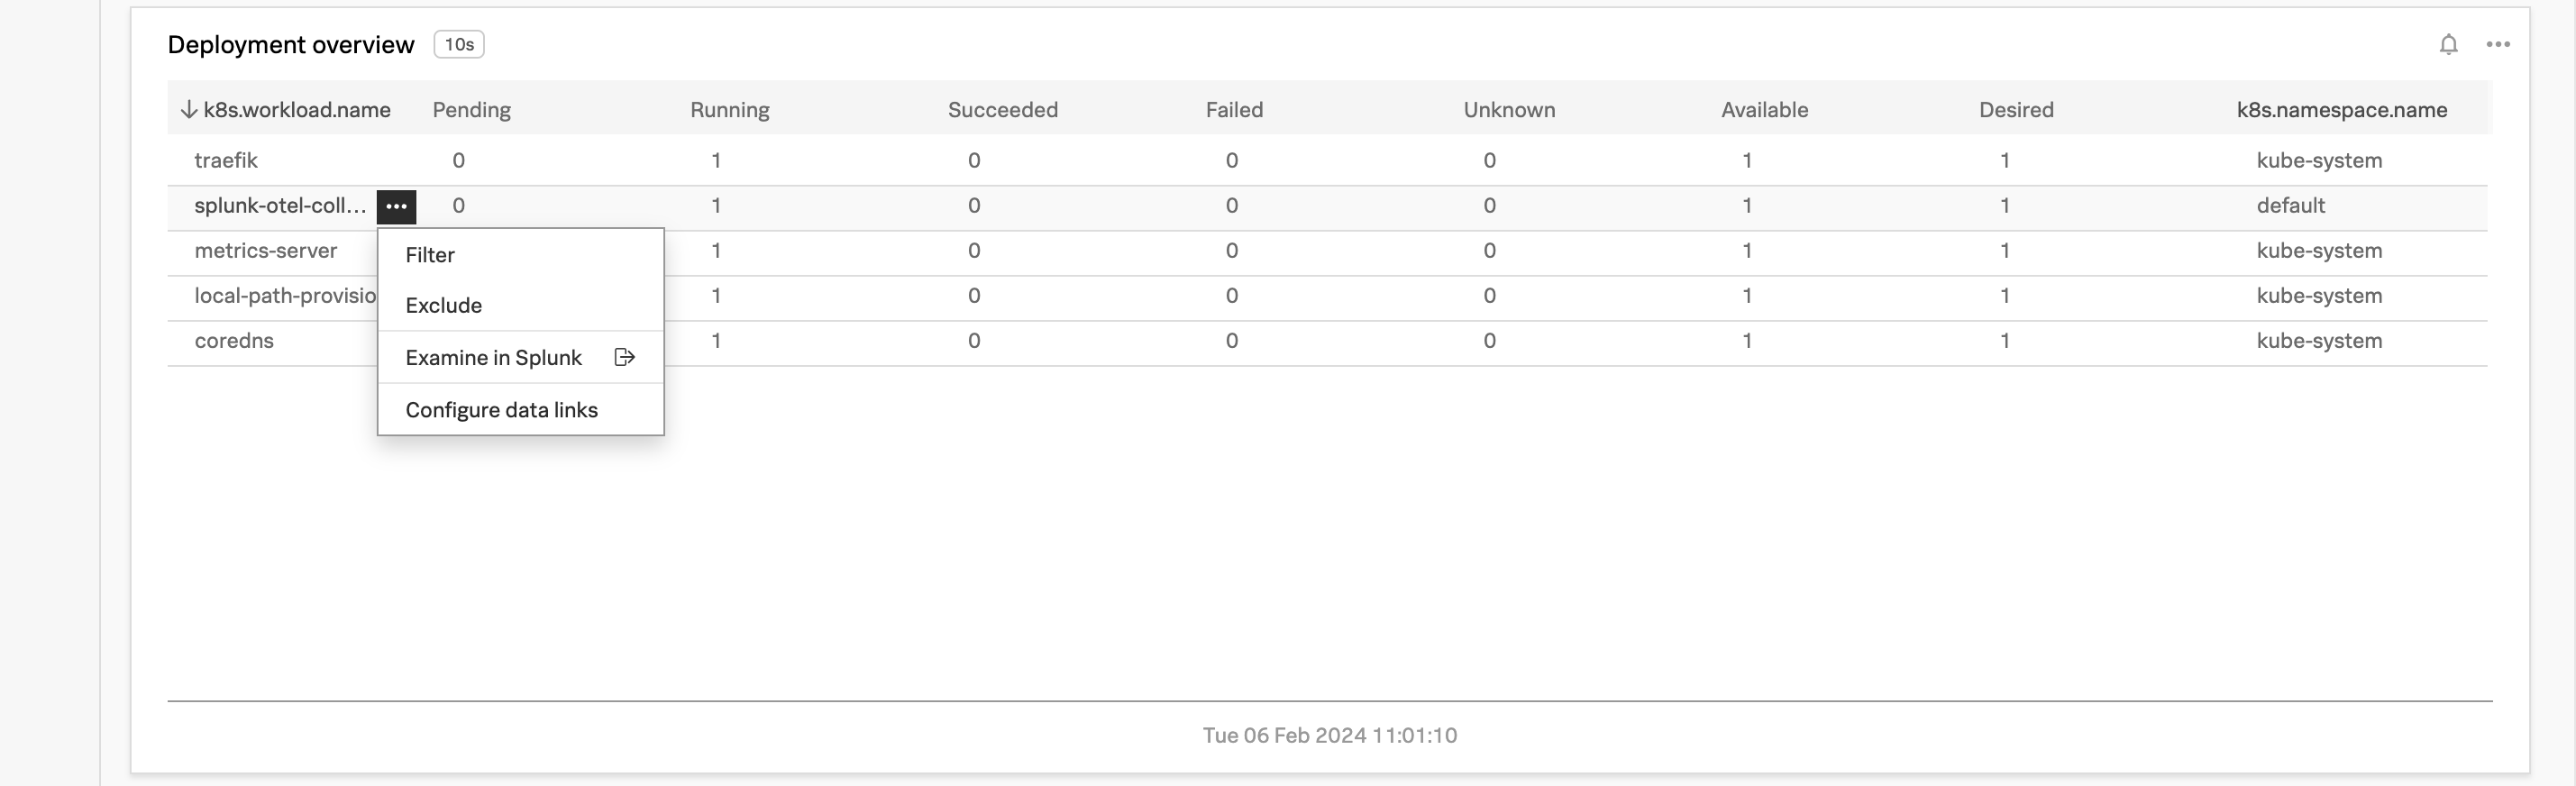
This will add the selected workload to your filters. It would then list a single workload in the default namespace.
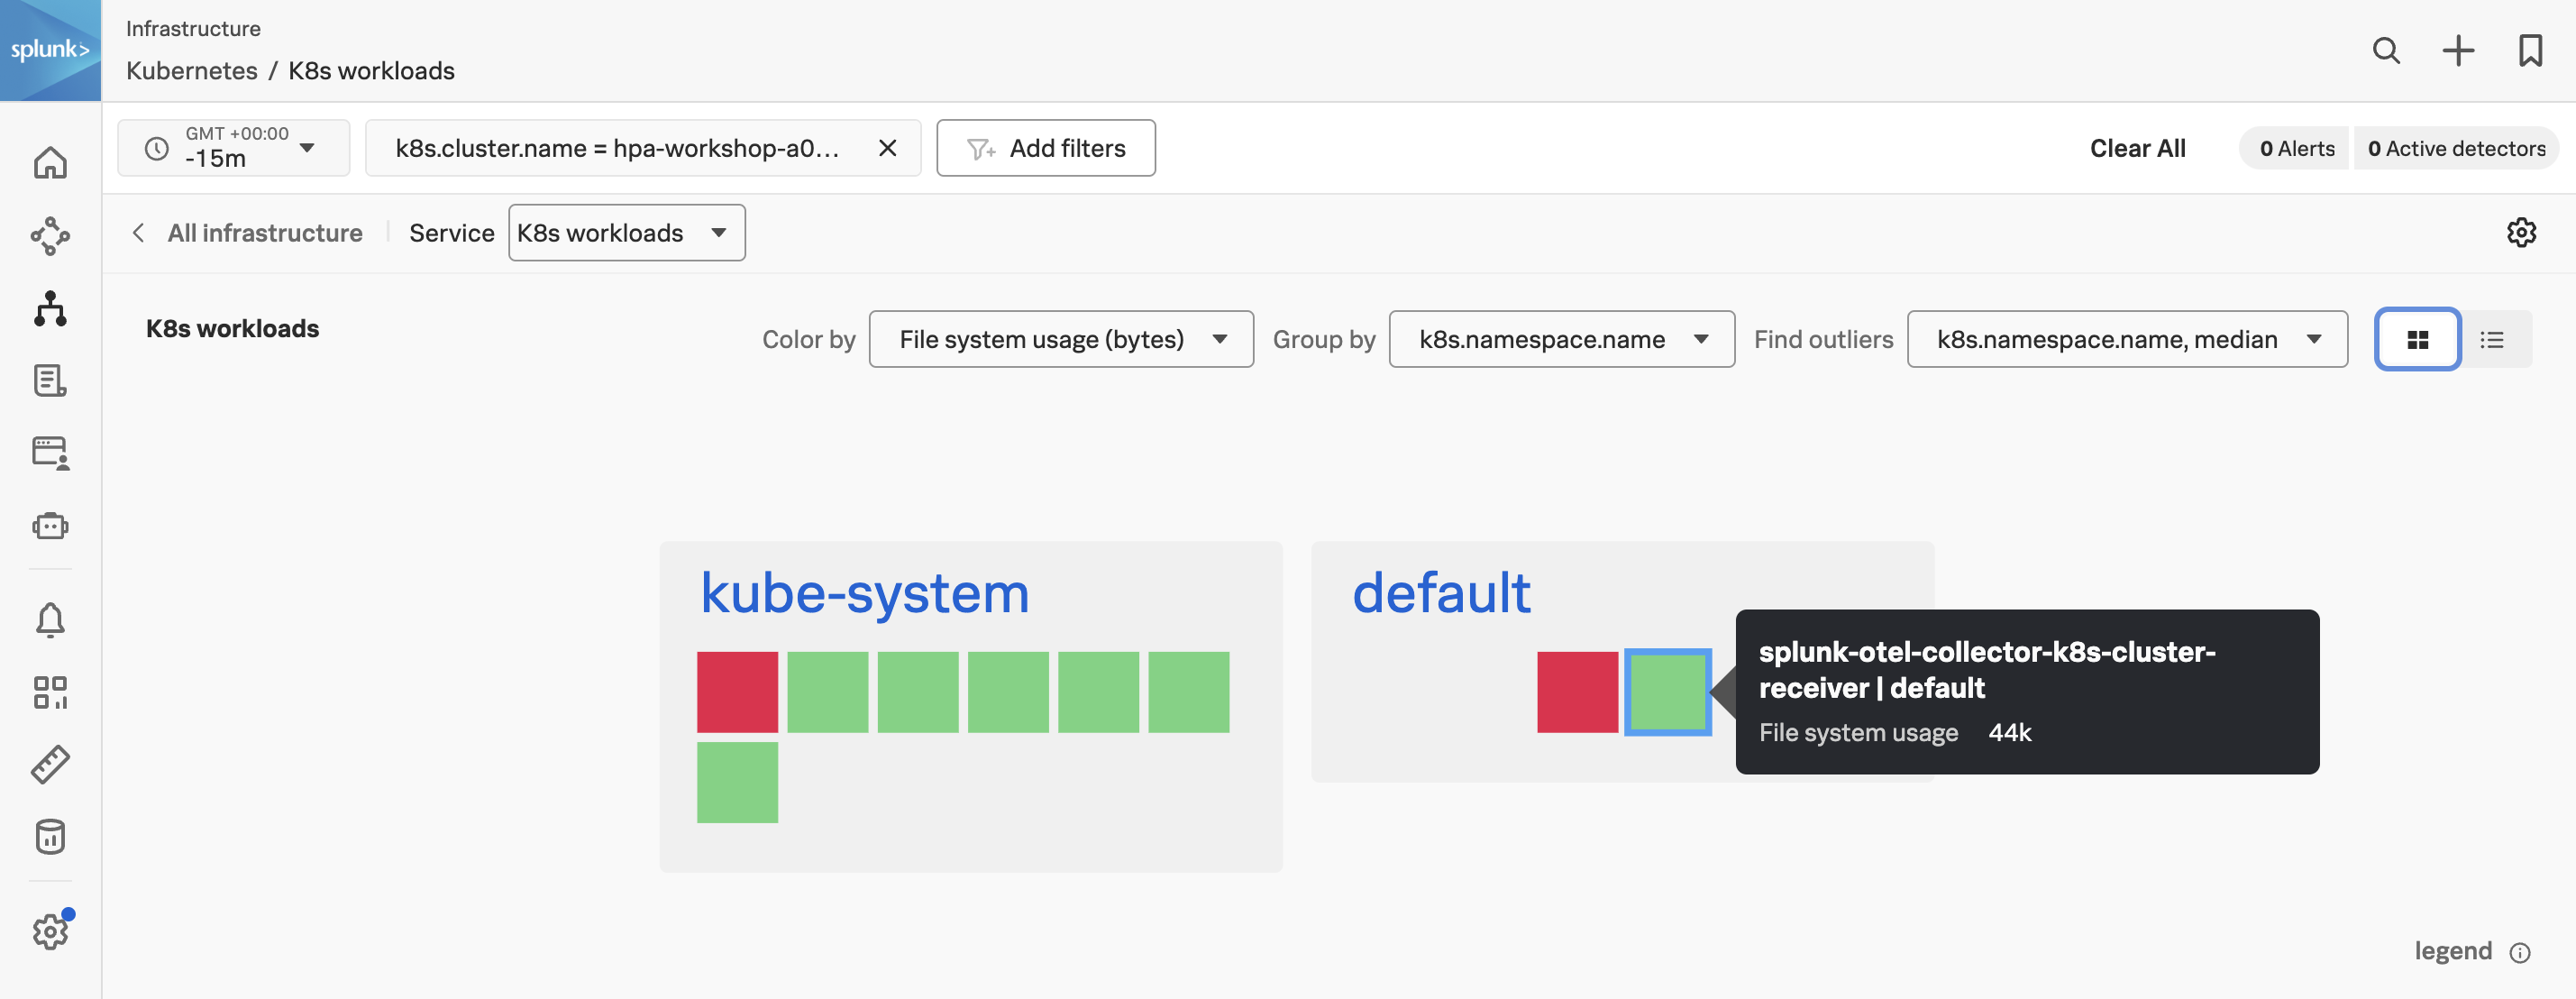
From the Heatmap above find the splunk-otel-collector-k8s-cluster-receiver in the default namespace and click on the square to see more information about the workload.
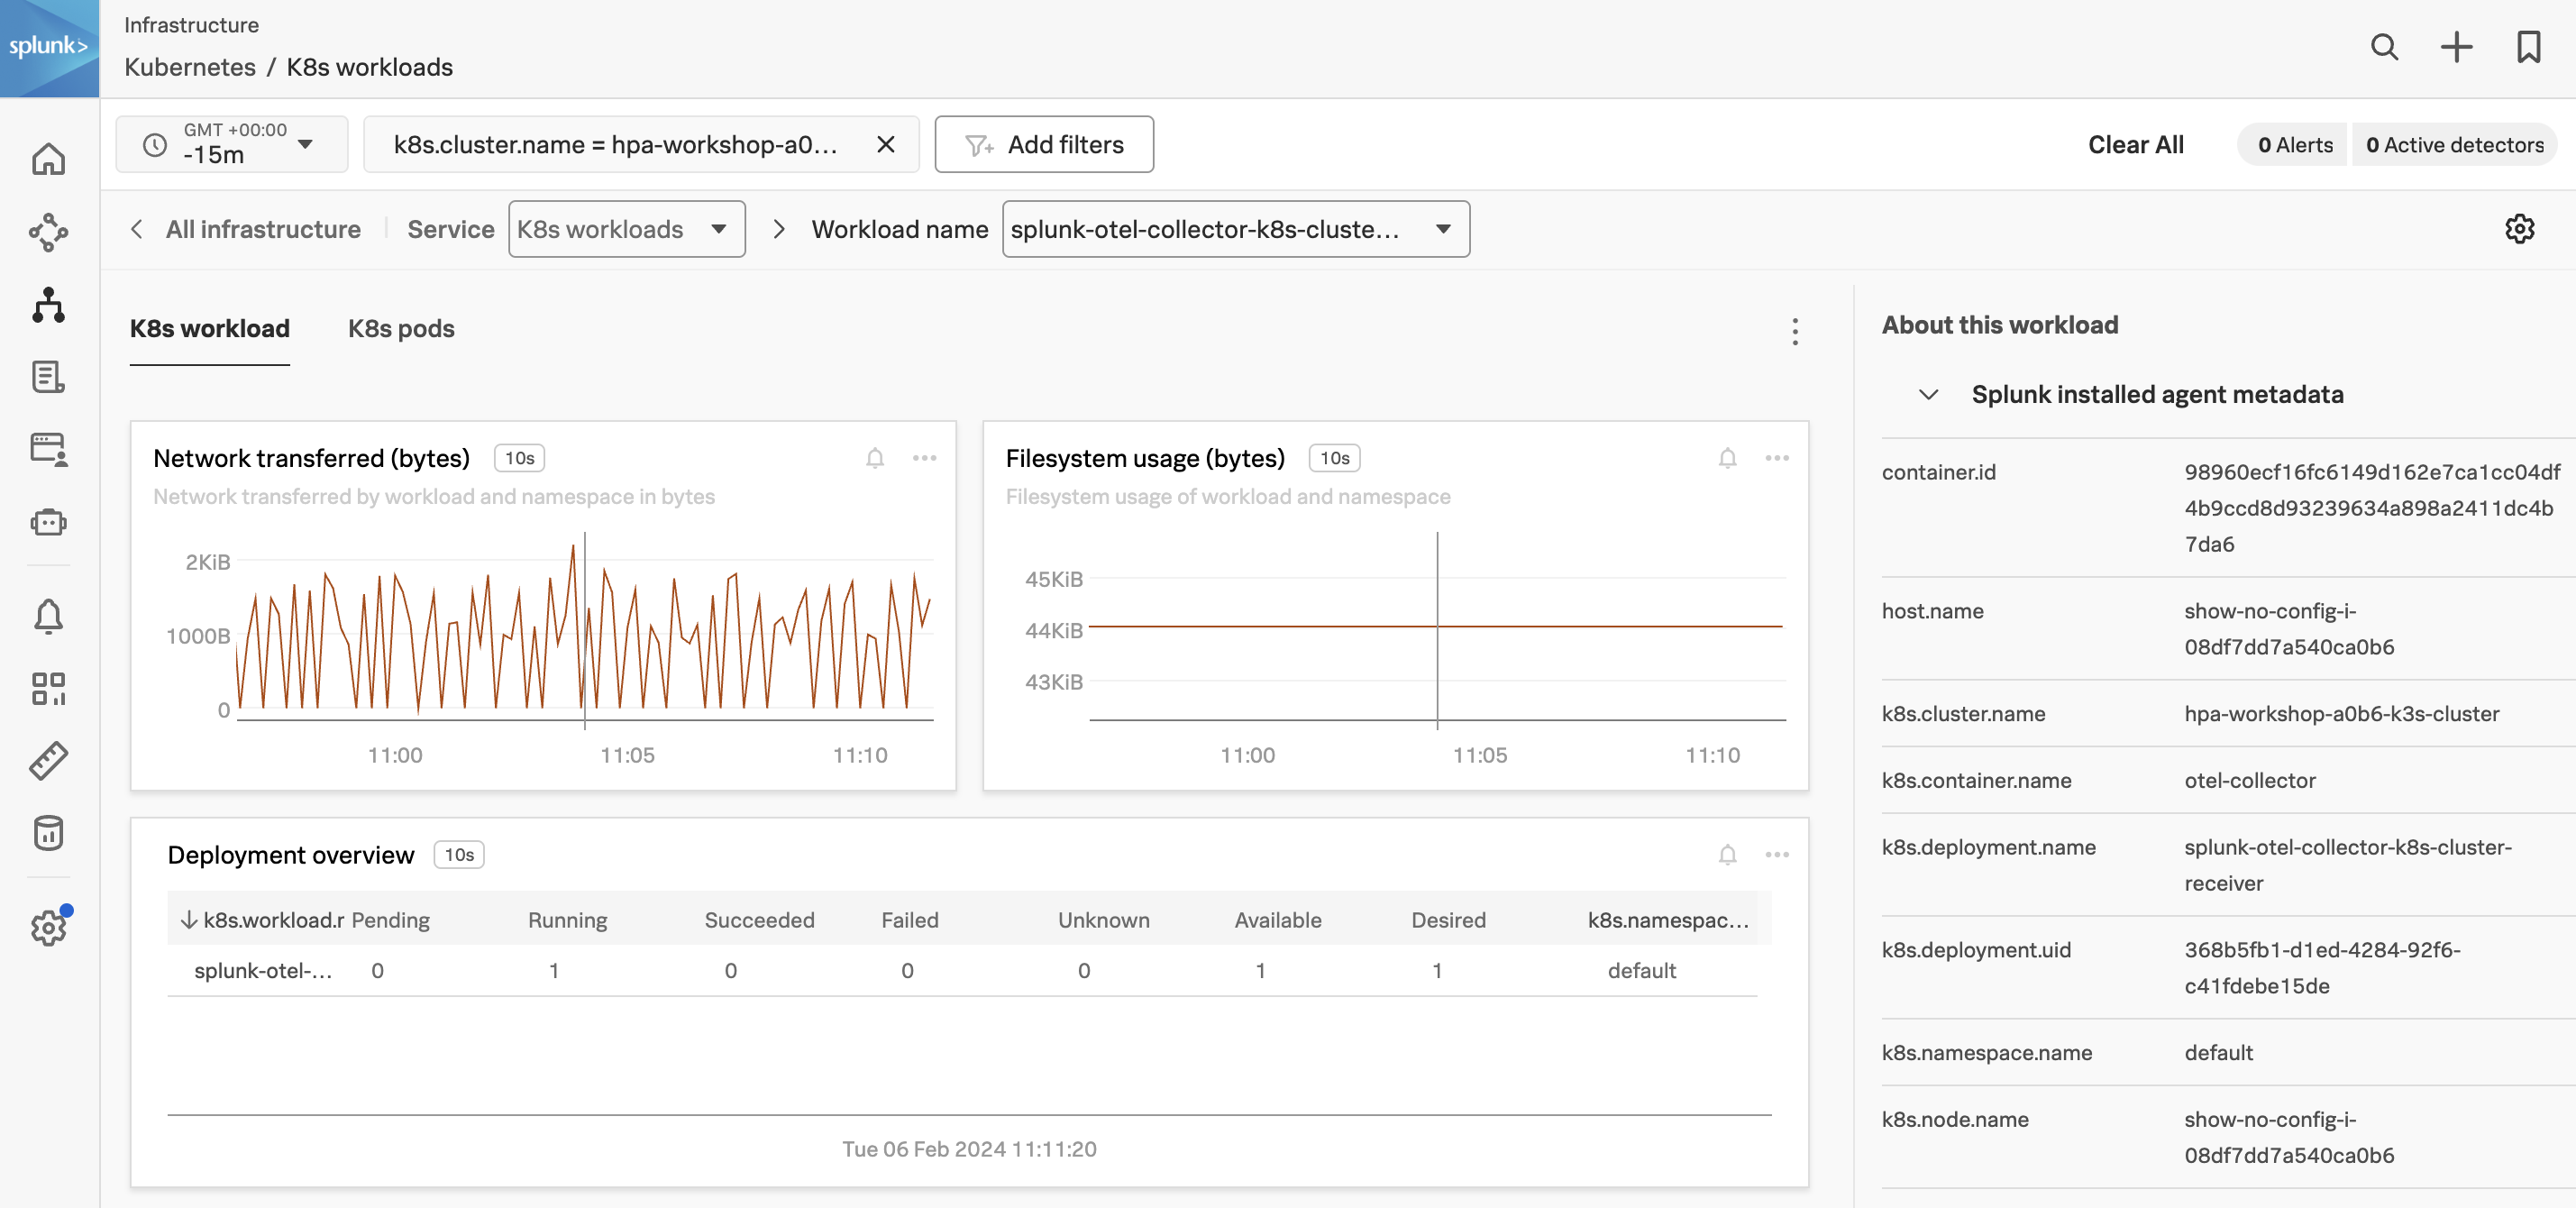
What are the CPU request & CPU limit units for the otel-collector?
At this point, you can drill into the information of the pods, but that is outside the scope of this workshop.
3. Navigator Sidebar
Later in the workshop, you will deploy an Apache server into your cluster which will display an icon in the Navigator Sidebar.
In navigators for Kubernetes, you can track dependent services and containers in the navigator sidebar. To get the most out of the navigator sidebar you configure the services you want to track by configuring an extra dimension called service.name. For this workshop, we have already configured the extraDimensions in the collector configuration for monitoring Apache e.g.
extraDimensions:
  service.name: php-apache
The Navigator Sidebar will expand and a link to the discovered service will be added as seen in the image below:
This will allow for easy switching between Navigators. The same applies to your Apache server instance, it will have a Navigator Sidebar allowing you to quickly jump back to the Kubernetes Navigator.