OpenTelemetry Collector Receivers
Prometheus Receiver
You will also notice another receiver called prometheus. Prometheus is an open-source toolkit used by the OpenTelemetry Collector. This receiver is used to scrape metrics from the OpenTelemetry Collector itself. These metrics can then be used to monitor the health of the collector.
Let’s modify the prometheus receiver to clearly show that it is for collecting metrics from the collector itself. By changing the name of the receiver from prometheus to prometheus/internal, it is now much clearer as to what that receiver is doing. Update the configuration file to look like this:
prometheus/internal:
  config:
    scrape_configs:
    - job_name: 'otel-collector'
      scrape_interval: 10s
      static_configs:
      - targets: ['0.0.0.0:8888']
Example Dashboard - Prometheus metrics
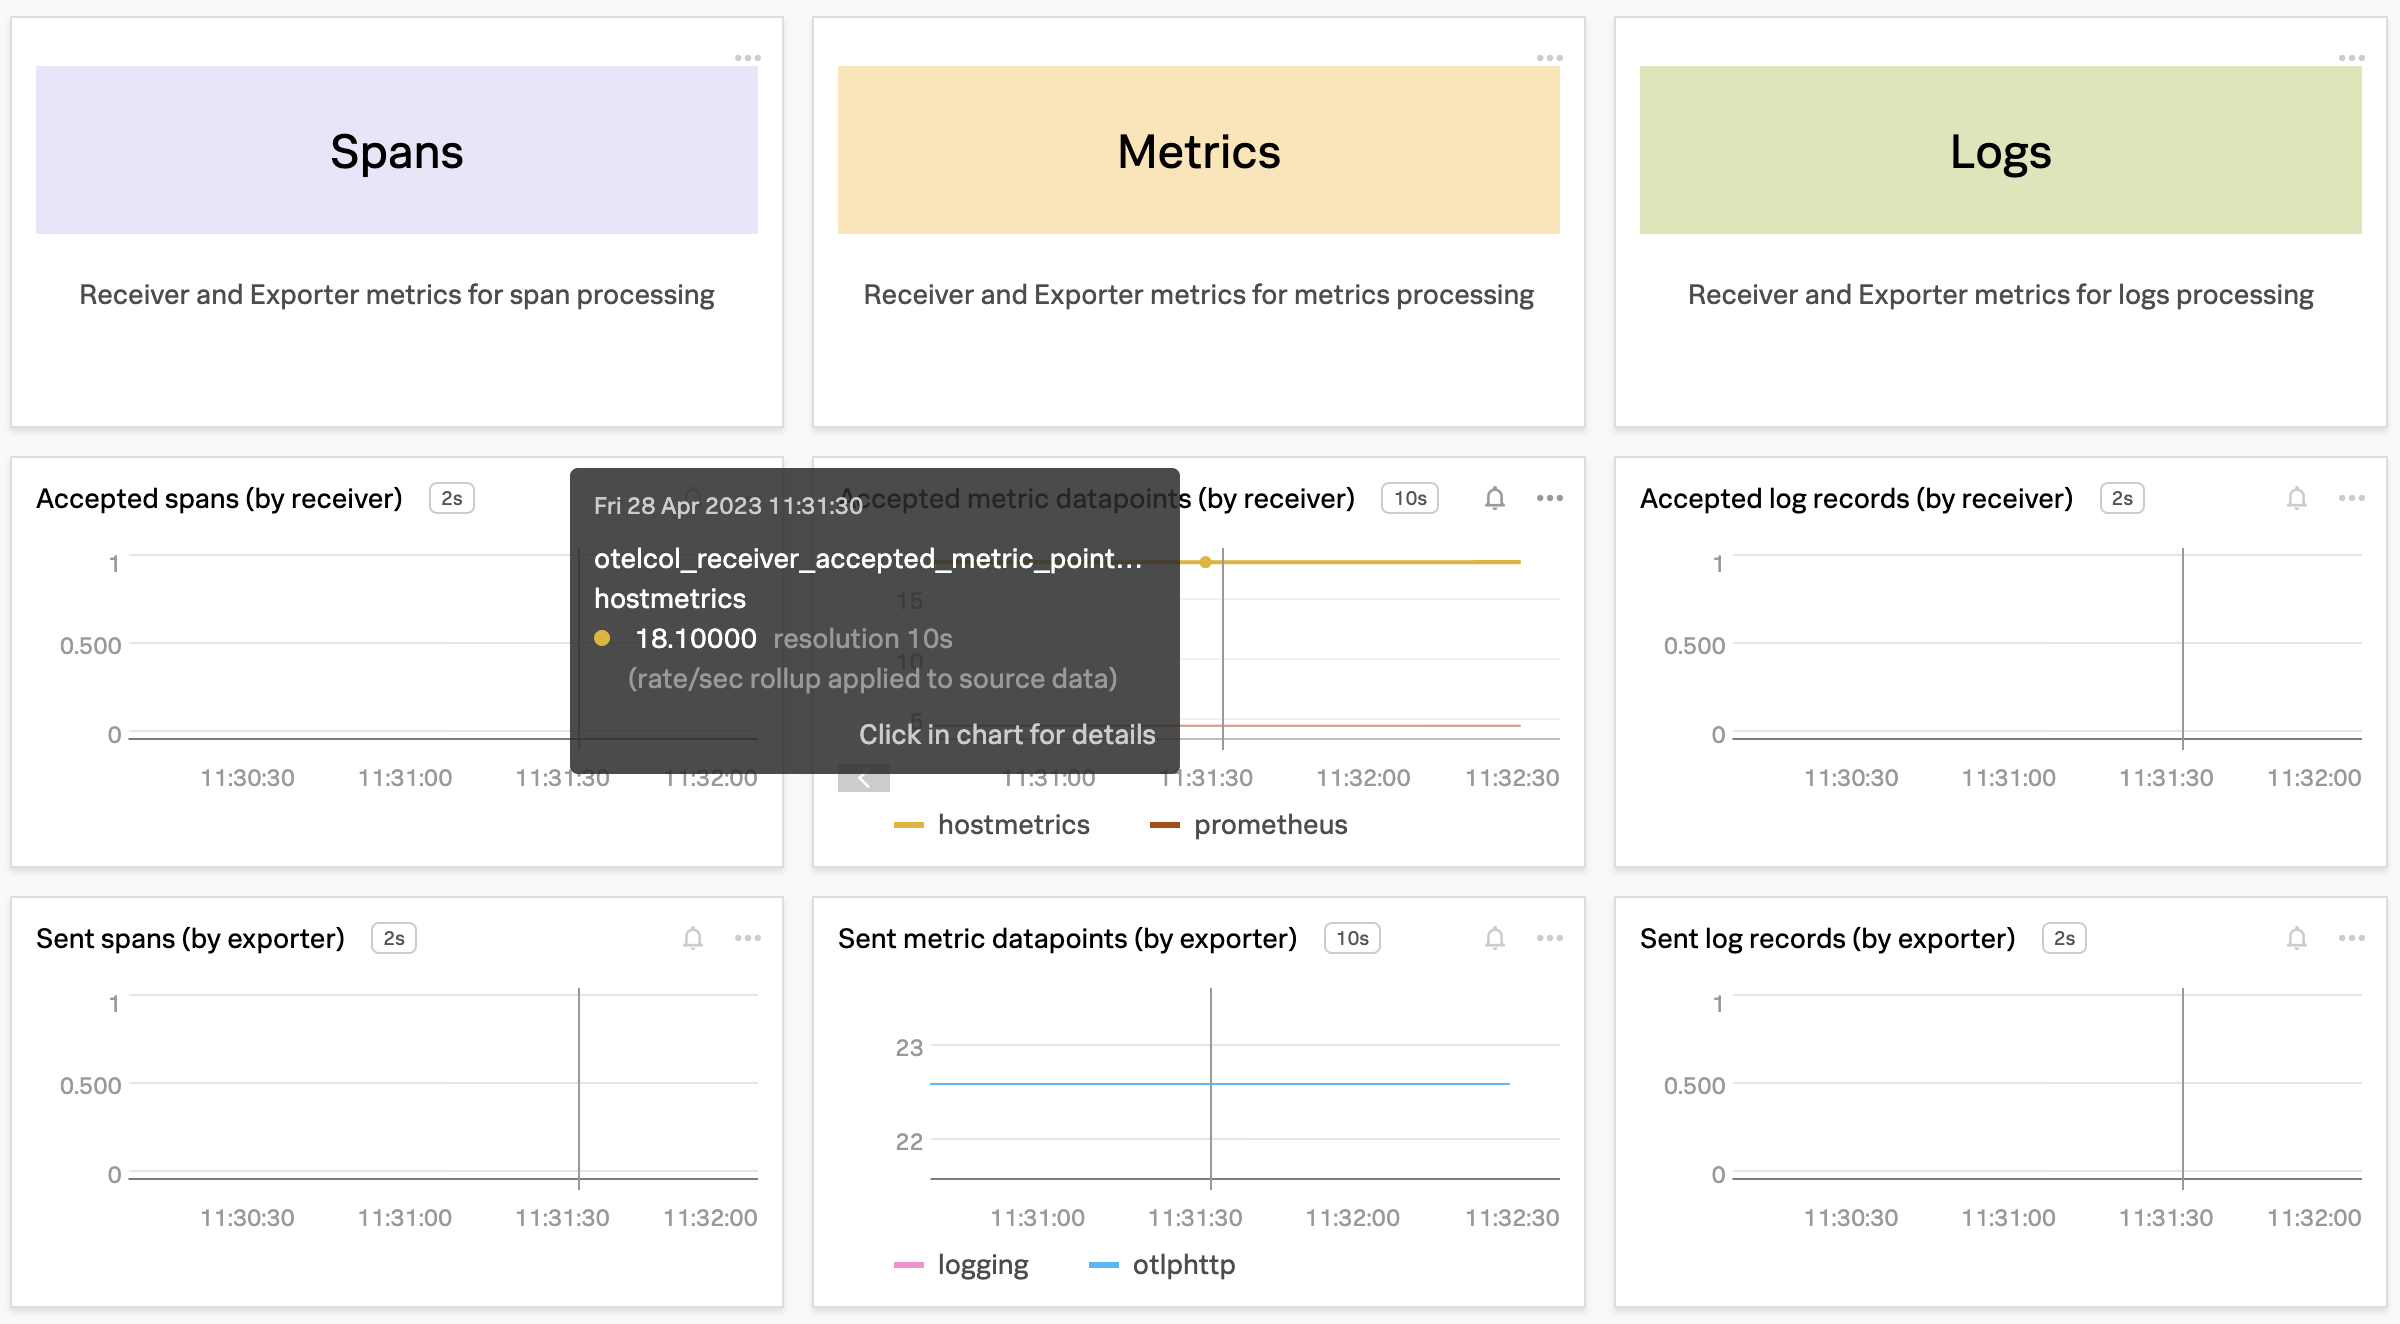
The following screenshot shows an example dashboard of spme of the metrics the Prometheus internal receiver collects from the OpenTelemetry Collector. Here, we can see accepted and sent spans, metrics and log records.
The following screenshot is an out-of-the-box (OOTB) dashboard from Splunk Observability Cloud that allows you to easily monitor your Splunk OpenTelemetry Collector install base.