OpenTelemetry Collector Service

OTLP HTTP Exporter

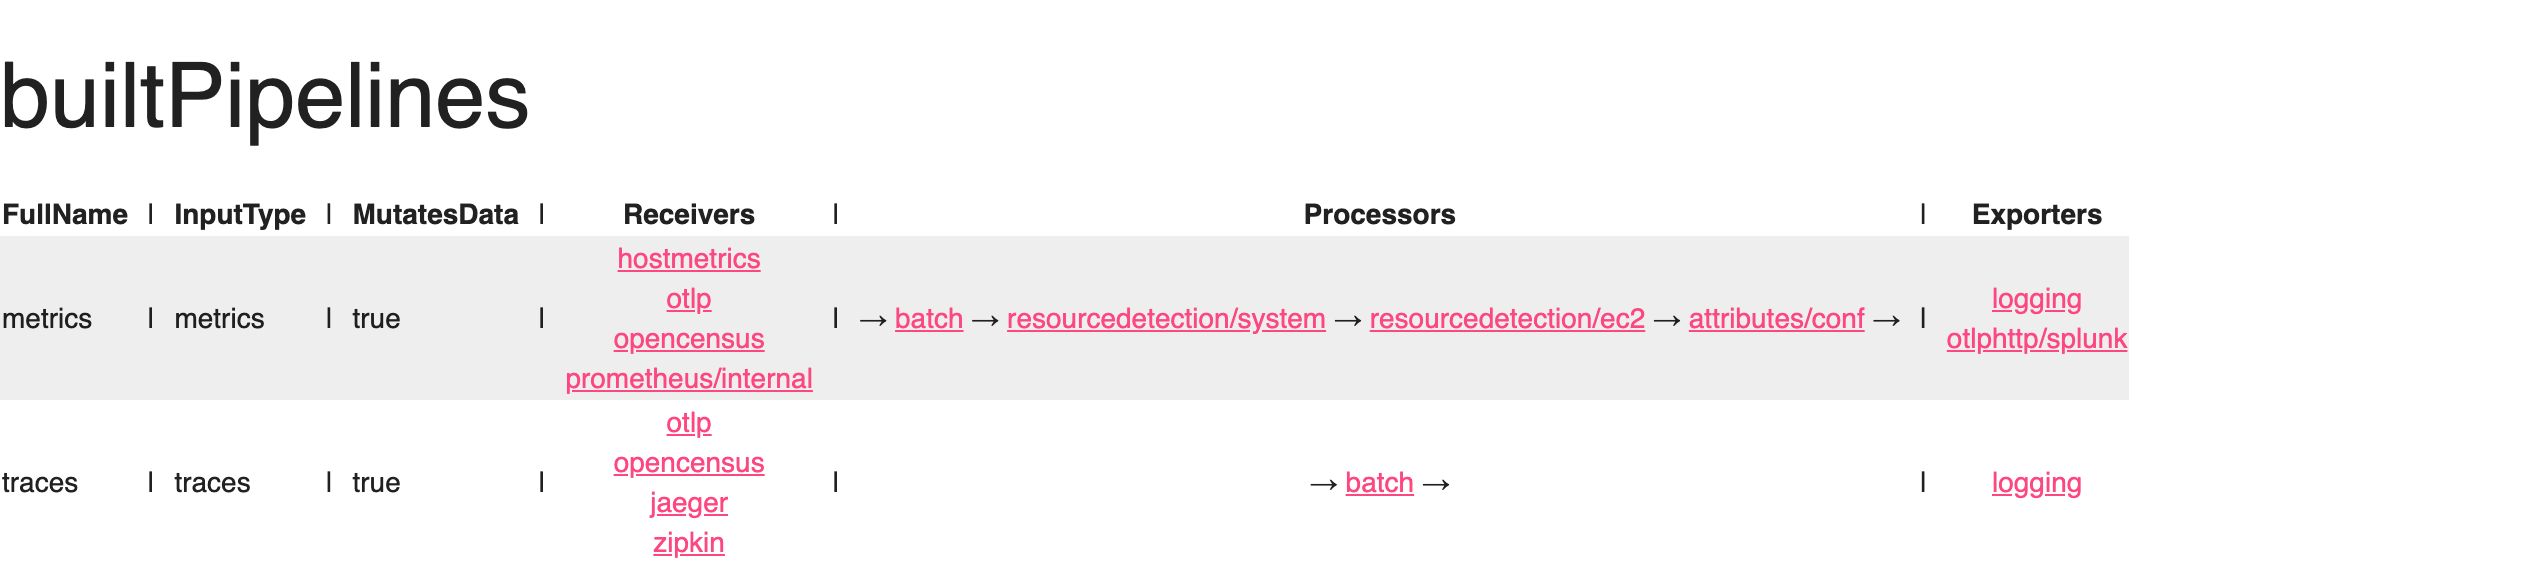
In the Exporters section of the workshop, we configured the otlphttp exporter to send metrics to Splunk Observability Cloud. We now need to enable this under the metrics pipeline.

Update the exporters section to include otlphttp/splunk under the metrics pipeline:

service:

  pipelines:

    traces:
      receivers: [otlp, opencensus, jaeger, zipkin]
      processors: [batch]
      exporters: [logging]

    metrics:
      receivers: [hostmetrics, otlp, opencensus, prometheus/internal]
      processors: [batch, resourcedetection/system, resourcedetection/ec2, attributes/conf]
      exporters: [logging, otlphttp/splunk]

The collector captures internal signals about its behavior this also includes additional signals from running components. The reason for this is that components that make decisions about the flow of data need a way to surface that information as metrics or traces.

Why monitor the collector?

This is somewhat of a chicken and egg problem of, “Who is watching the watcher?”, but it is important that we can surface this information. Another interesting part of the collector’s history is that it existed before the Go metrics’ SDK was considered stable so the collector exposes a Prometheus endpoint to provide this functionality for the time being.

Considerations

Monitoring the internal usage of each running collector in your organization can contribute a significant amount of new Metric Time Series (MTS). The Splunk distribution has curated these metrics for you and would be able to help forecast the expected increases.

The Ninja Zone

To expose the internal observability of the collector, some additional settings can be adjusted:

service:
  telemetry:
    logs:
      level: <info|warn|error>
      development: <true|false>
      encoding: <console|json>
      disable_caller: <true|false>
      disable_stacktrace: <true|false>
      output_paths: [<stdout|stderr>, paths...]
      error_output_paths: [<stdout|stderr>, paths...]
      initial_fields:
        key: value
    metrics:
      level: <none|basic|normal|detailed>
      # Address binds the promethues endpoint to scrape
      address: <hostname:port>
service:
  telemetry:
    logs: 
      level: info
      encoding: json
      disable_stacktrace: true
      initial_fields:
        instance.name: ${env:INSTANCE}
    metrics:
      address: localhost:8888 

References

  1. https://opentelemetry.io/docs/collector/configuration/#service

Final configuration


 1
 2
 3
 4
 5
 6
 7
 8
 9
10
11
12
13
14
15
16
17
18
19
20
21
22
23
24
25
26
27
28
29
30
31
32
33
34
35
36
37
38
39
40
41
42
43
44
45
46
47
48
49
50
51
52
53
54
55
56
57
58
59
60
61
62
63
64
65
66
67
68
69
70
71
72
73
74
75
76
77
78
79
80
81
82
83
84
85
86
87
88
89
90
91
92
extensions:
  health_check:
    endpoint: 0.0.0.0:13133
  pprof:
    endpoint: 0.0.0.0:1777
  zpages:
    endpoint: 0.0.0.0:55679

receivers:
  hostmetrics:
    collection_interval: 10s
    scrapers:
      # CPU utilization metrics
      cpu:
      # Disk I/O metrics
      disk:
      # File System utilization metrics
      filesystem:
      # Memory utilization metrics
      memory:
      # Network interface I/O metrics & TCP connection metrics
      network:
      # CPU load metrics
      load:
      # Paging/Swap space utilization and I/O metrics
      paging:
      # Process count metrics
      processes:
      # Per process CPU, Memory and Disk I/O metrics. Disabled by default.
      # process:
  otlp:
    protocols:
      grpc:
      http:

  opencensus:

  # Collect own metrics
  prometheus/internal:
    config:
      scrape_configs:
      - job_name: 'otel-collector'
        scrape_interval: 10s
        static_configs:
        - targets: ['0.0.0.0:8888']

  jaeger:
    protocols:
      grpc:
      thrift_binary:
      thrift_compact:
      thrift_http:

  zipkin:

processors:
  batch:
  resourcedetection/system:
    detectors: [system]
    system:
      hostname_sources: [os]
  resourcedetection/ec2:
    detectors: [ec2]
  attributes/conf:
    actions:
      - key: participant.name
        action: insert
        value: "INSERT_YOUR_NAME_HERE"

exporters:
  logging:
    verbosity: normal
  otlphttp/splunk:
    metrics_endpoint: https://ingest.${env:REALM}.signalfx.com/v2/datapoint/otlp
    headers:
      X-SF-TOKEN: ${env:ACCESS_TOKEN}

service:

  pipelines:

    traces:
      receivers: [otlp, opencensus, jaeger, zipkin]
      processors: [batch]
      exporters: [logging]

    metrics:
      receivers: [hostmetrics, otlp, opencensus, prometheus/internal]
      processors: [batch, resourcedetection/system, resourcedetection/ec2, attributes/conf] 
      exporters: [logging, otlphttp/splunk]

  extensions: [health_check, pprof, zpages]

Tip

It is recommended that you validate your configuration file before restarting the collector. You can do this by using the built-in validate command:

otelcol-contrib validate --config=file:/etc/otelcol-contrib/config.yaml
Error: failed to get config: cannot unmarshal the configuration: 1 error(s) decoding:

* error decoding 'processors': error reading configuration for "attributes/conf": 1 error(s) decoding:

* 'actions[0]' has invalid keys: actions
2023/06/29 09:41:28 collector server run finished with error: failed to get config: cannot unmarshal the configuration: 1 error(s) decoding:

* error decoding 'processors': error reading configuration for "attributes/conf": 1 error(s) decoding:

* 'actions[0]' has invalid keys: actions

Now that we have a working configuration, let’s start the collector and then check to see what zPages is reporting.

otelcol-contrib --config=file:/etc/otelcol-contrib/config.yaml

pipelinez-full-config pipelinez-full-config