Auto-Instrumentation
Auto-Instrumentation
Navigate to the auto directory that contains auto-instrumentation code.
cd ~/o11y-lambda-lab/autoInspect the contents of the files in this directory. Take a look at the serverless.yml template.
cat serverless.yml- Can you identify which AWS entities are being created by this template?
- Can you identify where OpenTelemetry instrumentation is being set up?
- Can you determine which instrumentation information is being provided by the Environment Variables?
You should see the Splunk OpenTelemetry Lambda layer being added to each fuction.
layers:
      - arn:aws:lambda:us-east-1:254067382080:layer:splunk-apm:70
You can see the relevant layer ARNs (Amazon Resource Name) and latest versions for each AWS region here: https://github.com/signalfx/lambda-layer-versions/blob/main/splunk-apm/splunk-apm.md
You should also see a section where the Environment variables that are being set.
environment:
  AWS_LAMBDA_EXEC_WRAPPER: /opt/nodejs-otel-handler
  OTEL_RESOURCE_ATTRIBUTES: deployment.environment=${self:custom.prefix}-apm-lambda
  OTEL_SERVICE_NAME: consumer-lambda
  SPLUNK_ACCESS_TOKEN: ${self:custom.accessToken}
  SPLUNK_REALM: ${self:custom.realm}
Using the environment variables we are configuring and enriching our auto-instrumentation.
Here we provide minimum information, such as NodeJS wrapper location in the Splunk APM Layer, environment name, service name, and our Splunk Org credentials. We are sending trace data directly to Splunk Observability Cloud. You could alternatively export traces to an OpenTelemetry Collector set up in Gateway mode.
Take a look at the function code.
cat handler.js- Can you identify the code for producer function?
- Can you identify the code for consumer function?
Notice there is no mention of Splunk or OpenTelemetry in the code. We are adding the instrumentation using the Lambda layer and Environment Variables only.
Deploy your Lambdas
Run the following command to deploy your Lambda Functions:
sls deployDeploying hostname-lambda-lab to stage dev (us-east-1)
...
...
endpoint: POST - https://randomstring.execute-api.us-east-1.amazonaws.com/dev/producer
functions:
producer: hostname-lambda-lab-dev-producer (1.6 kB)
consumer: hostname-lambda-lab-dev-consumer (1.6 kB)This command will follow the instructions in your serverless.yml template to create your Lambda functions and your Kinesis stream. Note it may take a 1-2 minutes to execute.
serverless.yml is in fact a CloudFormation template. CloudFormation is an infrastructure as code service from AWS. You can read more about it here - https://aws.amazon.com/cloudformation/
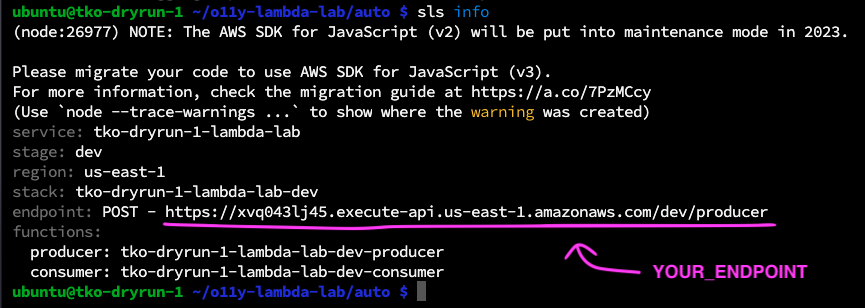
Check the details of your serverless functions:
sls infoTake note of your endpoint value:
Send some Traffic
Use the curl command to send a payload to your producer function. Note the command option -d is followed by your message payload.
Try changing the value of name to your name and telling the Lambda function about your superpower. Replace YOUR_ENDPOINT with the endpoint from your previous step.
curl -d '{ "name": "CHANGE_ME", "superpower": "CHANGE_ME" }' YOUR_ENDPOINTFor example:
curl -d '{ "name": "Kate", "superpower": "Distributed Tracing" }' https://xvq043lj45.execute-api.us-east-1.amazonaws.com/dev/producerYou should see the following output if your message is successful:
{"message":"Message placed in the Event Stream: hostname-eventSteam"}If unsuccessful, you will see:
{"message": "Internal server error"}If this occurs, ask one of the lab facilitators for assistance.
If you see a success message, generate more load: re-send that messate 5+ times. You should keep seeing a success message after each send.
Check the lambda logs output:
Producer function logs:
sls logs -f producerConsumer function logs:
sls logs -f consumerExamine the logs carefully.
Do you see OpenTelemetry being loaded? Look out for lines with splunk-extension-wrapper.