Lambdas in Splunk APM
Lambdas in Splunk APM
Now it’s time to check how your Lambda traffic has been captured in Splunk APM.
Navigate to your Splunk Observability Cloud
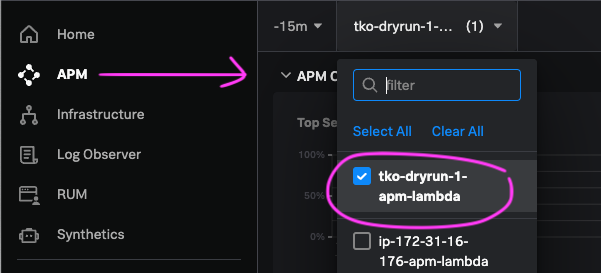
Select APM from the Main Menu and then select your APM Environment. Your APM environment should be in the format $INSTANCE-apm-lambda where the hostname value is a four letter name of your lab host. (Check it by looking at your command prompt, or by running echo $INSTANCE).
It may take a few minutes for you traces to appear in Splunk APM. Try hitting refresh on your browser until you find your environement name in the list of Envrionments
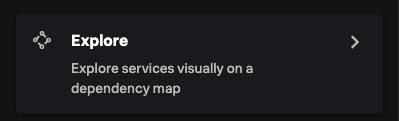
Go to Explore the Service Map to see the Dependencies between your Lambda Functions.
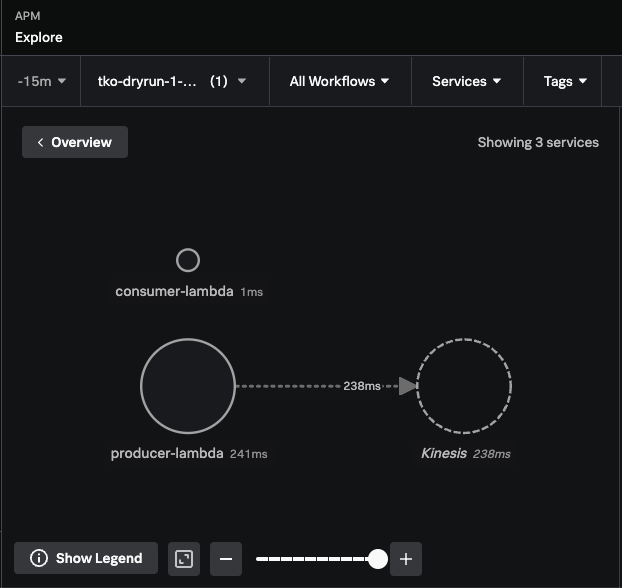
You should be able to see the producer-lambda and the call it is making to Kinesis service.
What about your consumer-lambda?
Click into Traces and examine some traces that container procuder function calls and traces with consumer function calls.
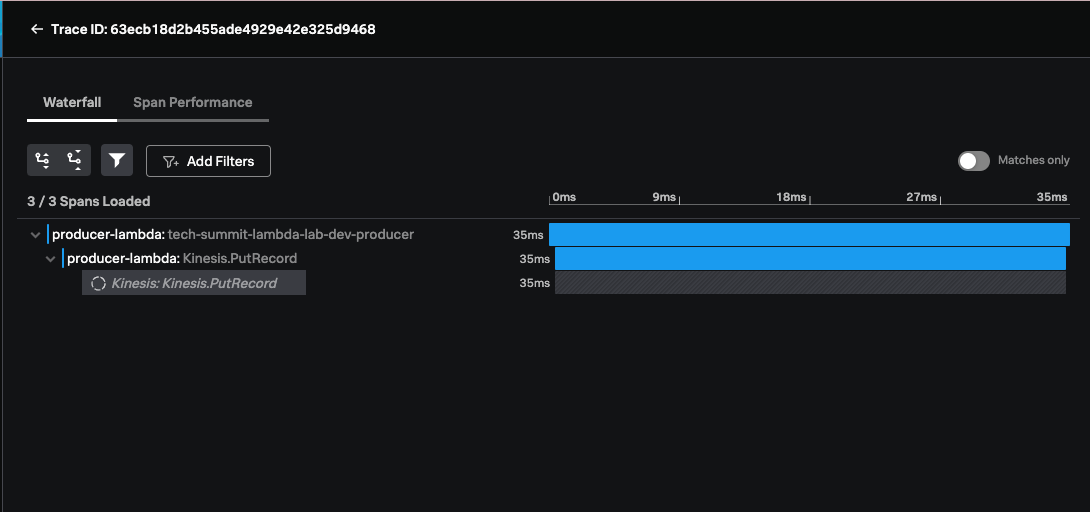
We can see the producer-lambda putting a Record on the Kinesis stream. But the action of consumer-function is disconnected!
This is because the Trace Context is not being propagated.
This is not something that is supported automatically Out-of-the-Box by Kinesis service at the time of this lab. Our Distributed Trace stops at Kinesis inferred service, and we can’t see the propagation any further.
Not yet…
Let’s see how we work around this in the next section of this lab.