Review APM in the UI
View Service Map
Next step is open your Observability UI, accessing the proper org ( where you sent the traces to ) and click APM and Access the Environemnnt that matches the username you put in .env.
Please note it may take 4-5 minutes or more for traces to show up and you will see full map “form” as traces are coming in, so you may have to refresh the page a few times each time we Build and Deploy.
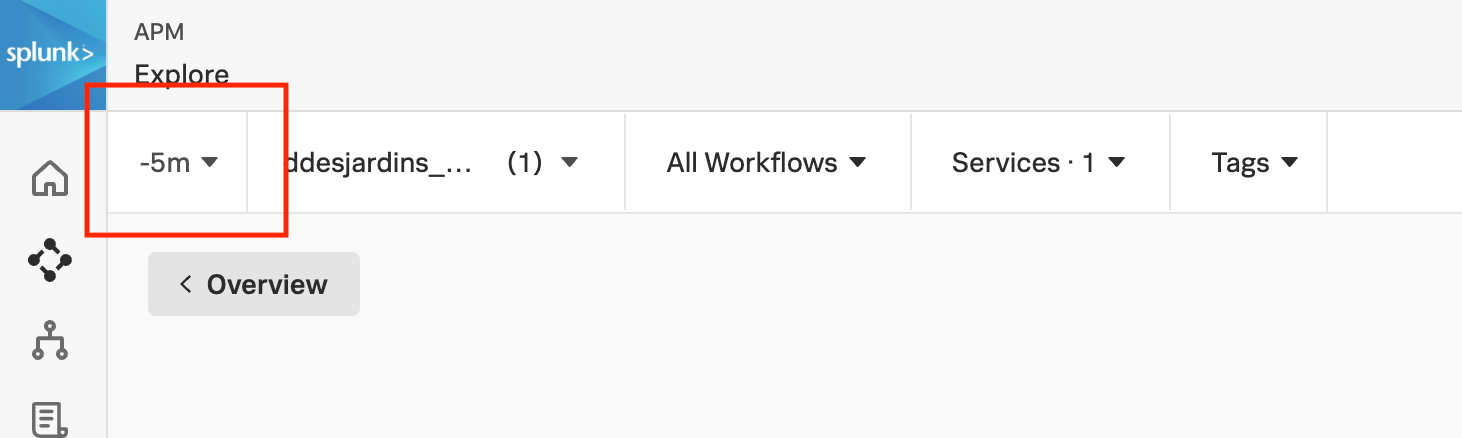
It is recommended to use a -15m look back during this lab. You may need to change it from time to time (for example to -5m or a custom -10m) to make sure you are only looking at the newer traces after your changes.
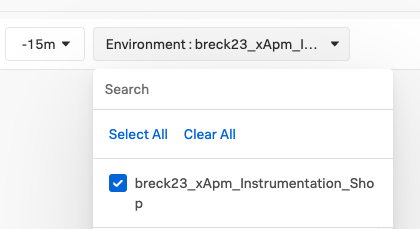
NOTE: You may have to refresh the page several times to see your Environment Tag in the UI. The prefix of the Environment tag should match what you entered for SHOP_USER in the .env file.
NOTE: Typically, to identify root cause and route an issue, an SRE or alert responder would check metrics and logs to determine if it is a software or hardware related issue, and thus route to the correct party. In this excercise we are ONLY handling software issues, so we are skipping the metrics and logs parts of normal triage.
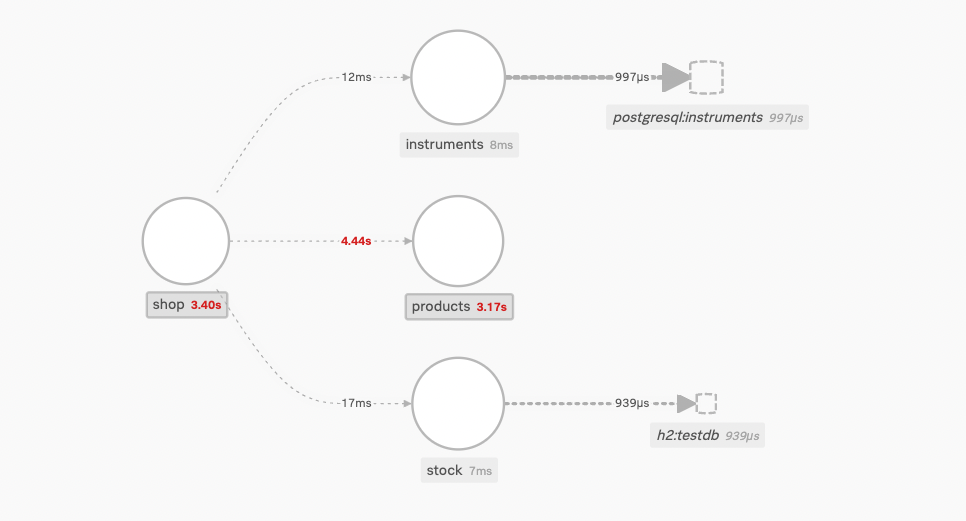
If your instrumentation was successful, the service-map will show latency from the shop service to the products service.
Ok let’s triage this SOFTWARE ISSUE and skip directly to the traces.
- Click on shop service
- Click Traces (on the right side)
- Sort by Duration
- Select the longest duration trace
- Or one of the obvious much longer ones
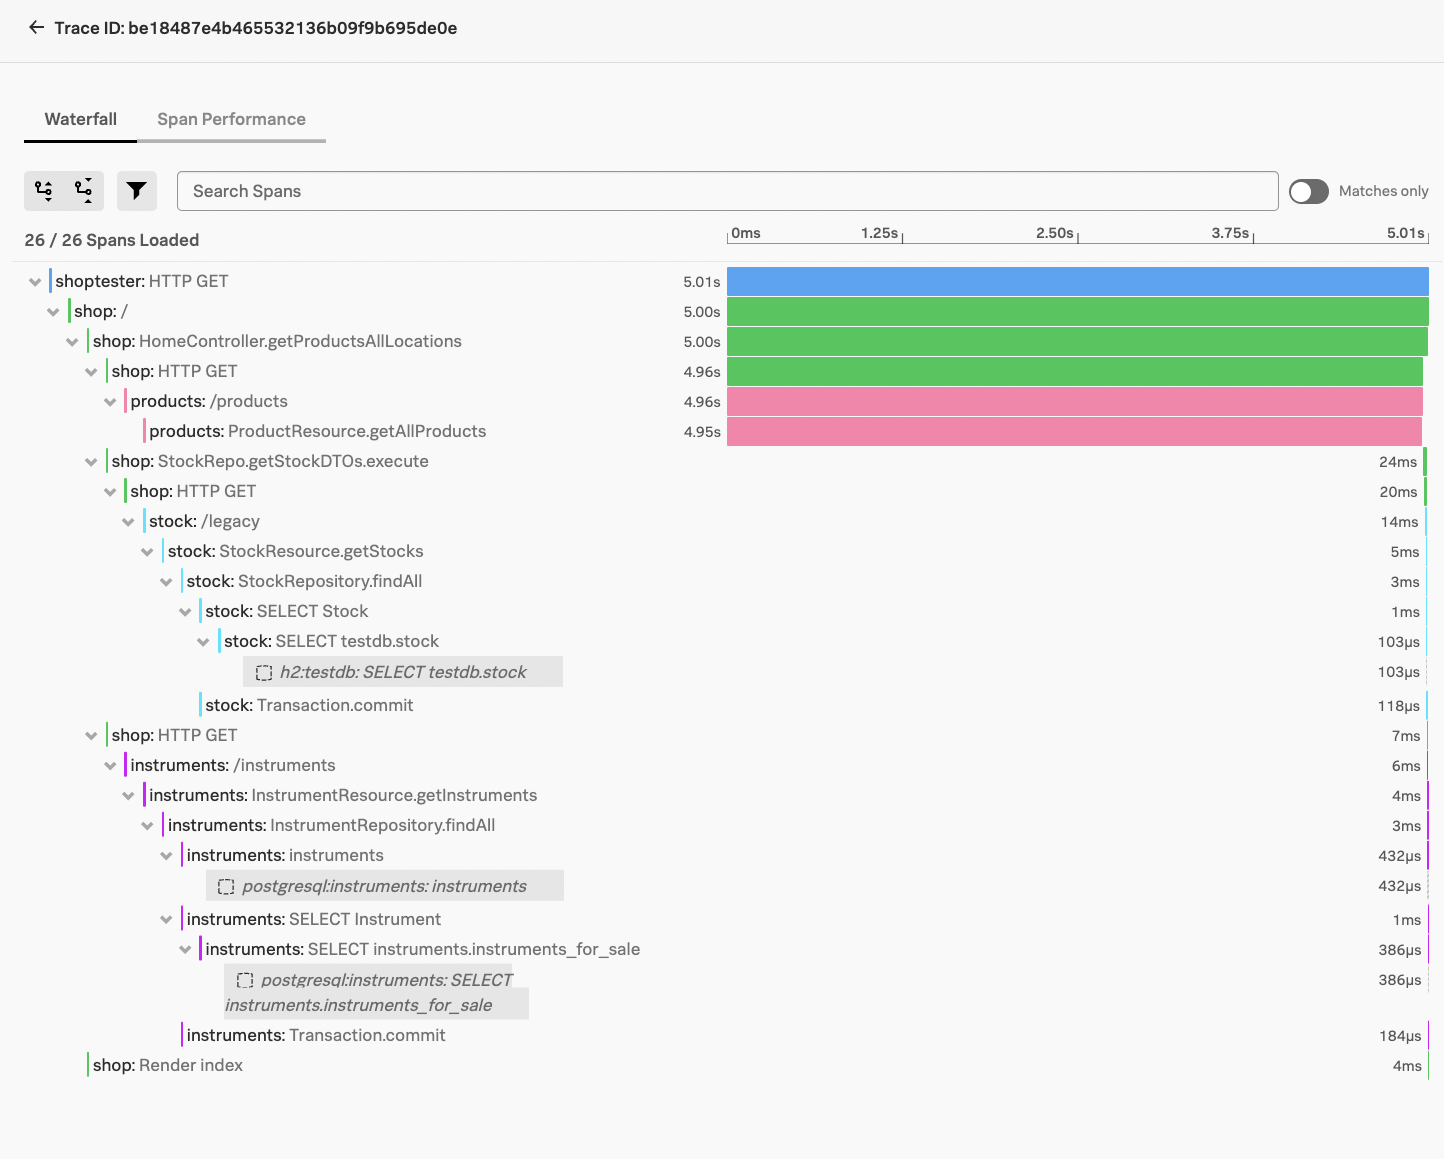
Now we can see the long latency occurred in the products service and if we click on products: /products we can see the offending method was products:ProductResource.getAllProducts
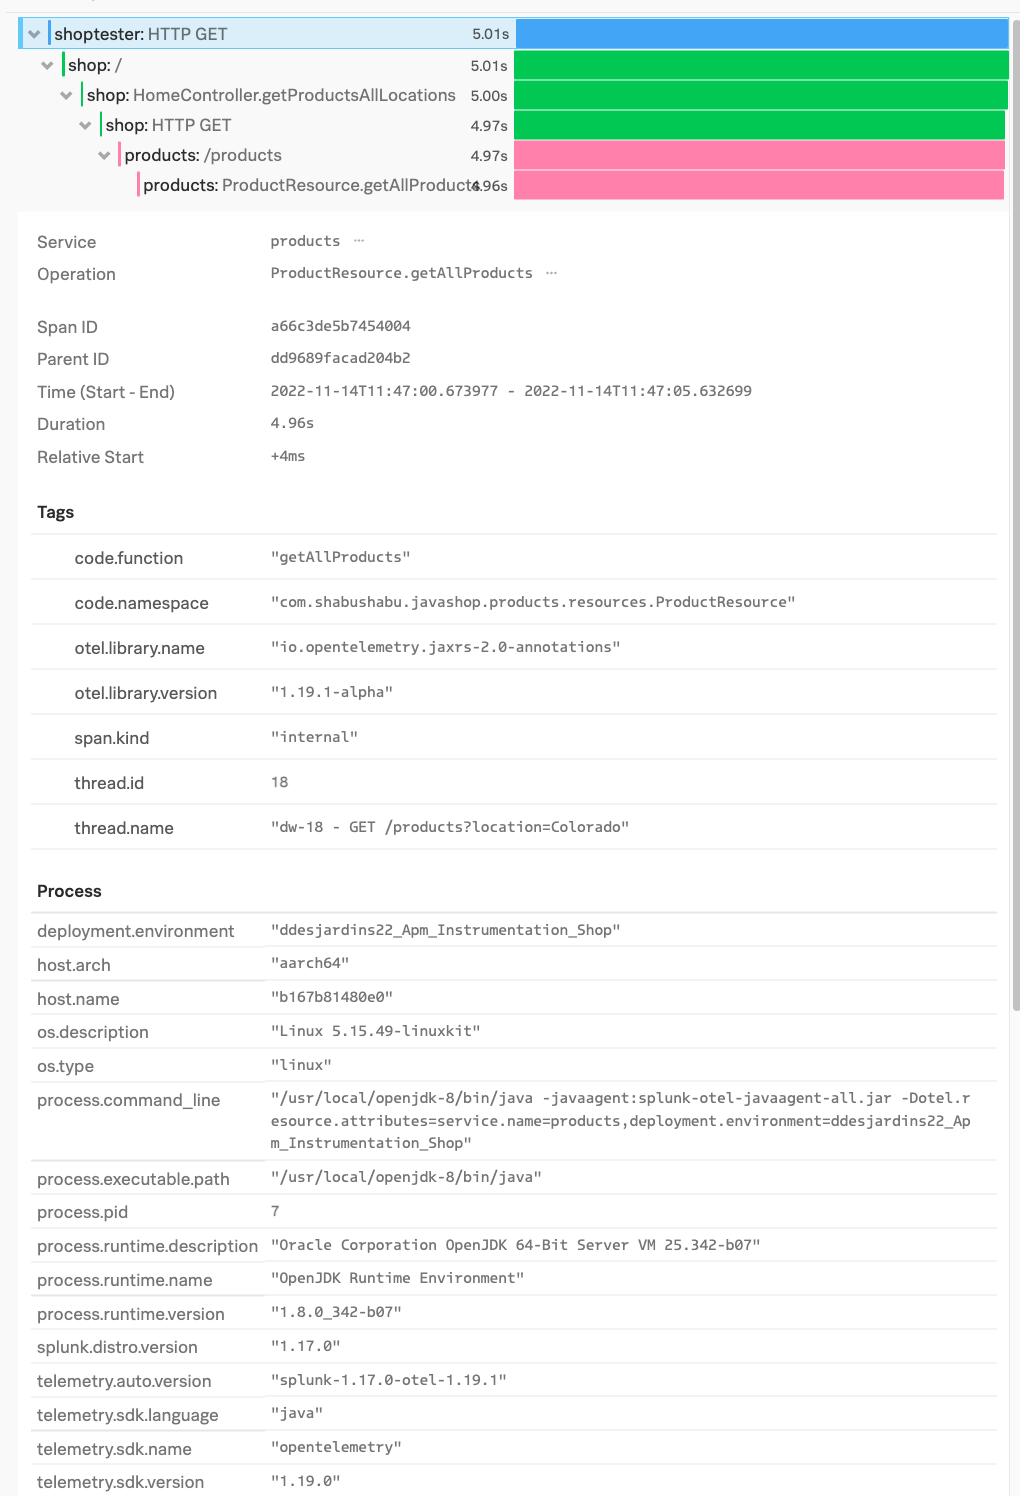
Our next step here would be to send that trace to a developer by clicking download trace and they will have to debug the function. Since we will be the developer there is no need to download the trace. Just remember that is normal workflow for alert responders to route an issue to the “Repairers” while providing trace data.
Before we do that please take note of the Tags available for the developer to leverage to find root cause. We see standard out of the box Otel tags on the span, environmental information, but no indications of data specific to something inside custom code (which is where the problem often is).