Custom Tags
Custom Attribution (Custom Tags)
To take a deeper look at this issue and make this much easier to debug we will implement Custom Attributes via Opentelemetry Manual Instrumentation.
To speed up manual instrumentation in Java you can leverage OpenTelemetry Annotations, which automatically create a span around a method without modifying the actual code inside the method. This can be very valuable if you are working with an SRE that may have limited access to source code changes.
To add even more information to help our developers find the root cause faster, OpenTelemetry Annotations can be used to generate span tags with parameter values for the method in question. This is incredibly important to mean time to Repair, because as a Developer, if I know the parameter values of a function at the time of latency or error, I can debug this without having to reproduce an issue in another environment if I have Full Fidelity Tracing.
Splunk Full Fidelity APM allows our customers development teams to debug their code as it ran in production, 100% of the time. Add with Custom Attribution, you are providing repeatable Mean Time to Repair reduction… 100% of the time, only with Full Fidelity tracing.
To expedite manual instrumentation implementation for this exercise, we have provided a tool which will annotate the entirety of the “shop” and “products” services with OpenTelemetry standard annotations for every function call without having to write any code. This “annotator” tool will also tag every parameter in every function, which adds a span tag with Parameter=Value.
- Run Manual Instrumentation Tool
./AutomateManualInstrumentation.sh- Rebuild and Deploy the Application
./BuildAndDeploy.shVisualize in Splunk APM
Now that we have rebuilt and deployed our application, traffic is being sent once again.
Go back to the Splunk Observability UI and let’s see if these annotations help us narrow down the root cause more quickly.
Let’s try to find our latency root cause again, this time with every function and every parameter spanned and tagged respectively…. You will see exactly what this means and how it benefits developers in a moment.
- Click on shop service
- Click Traces ( on the right side )
- Sort by Duration
- Select the longest duration trace ( or one of the obvious much longer ones )
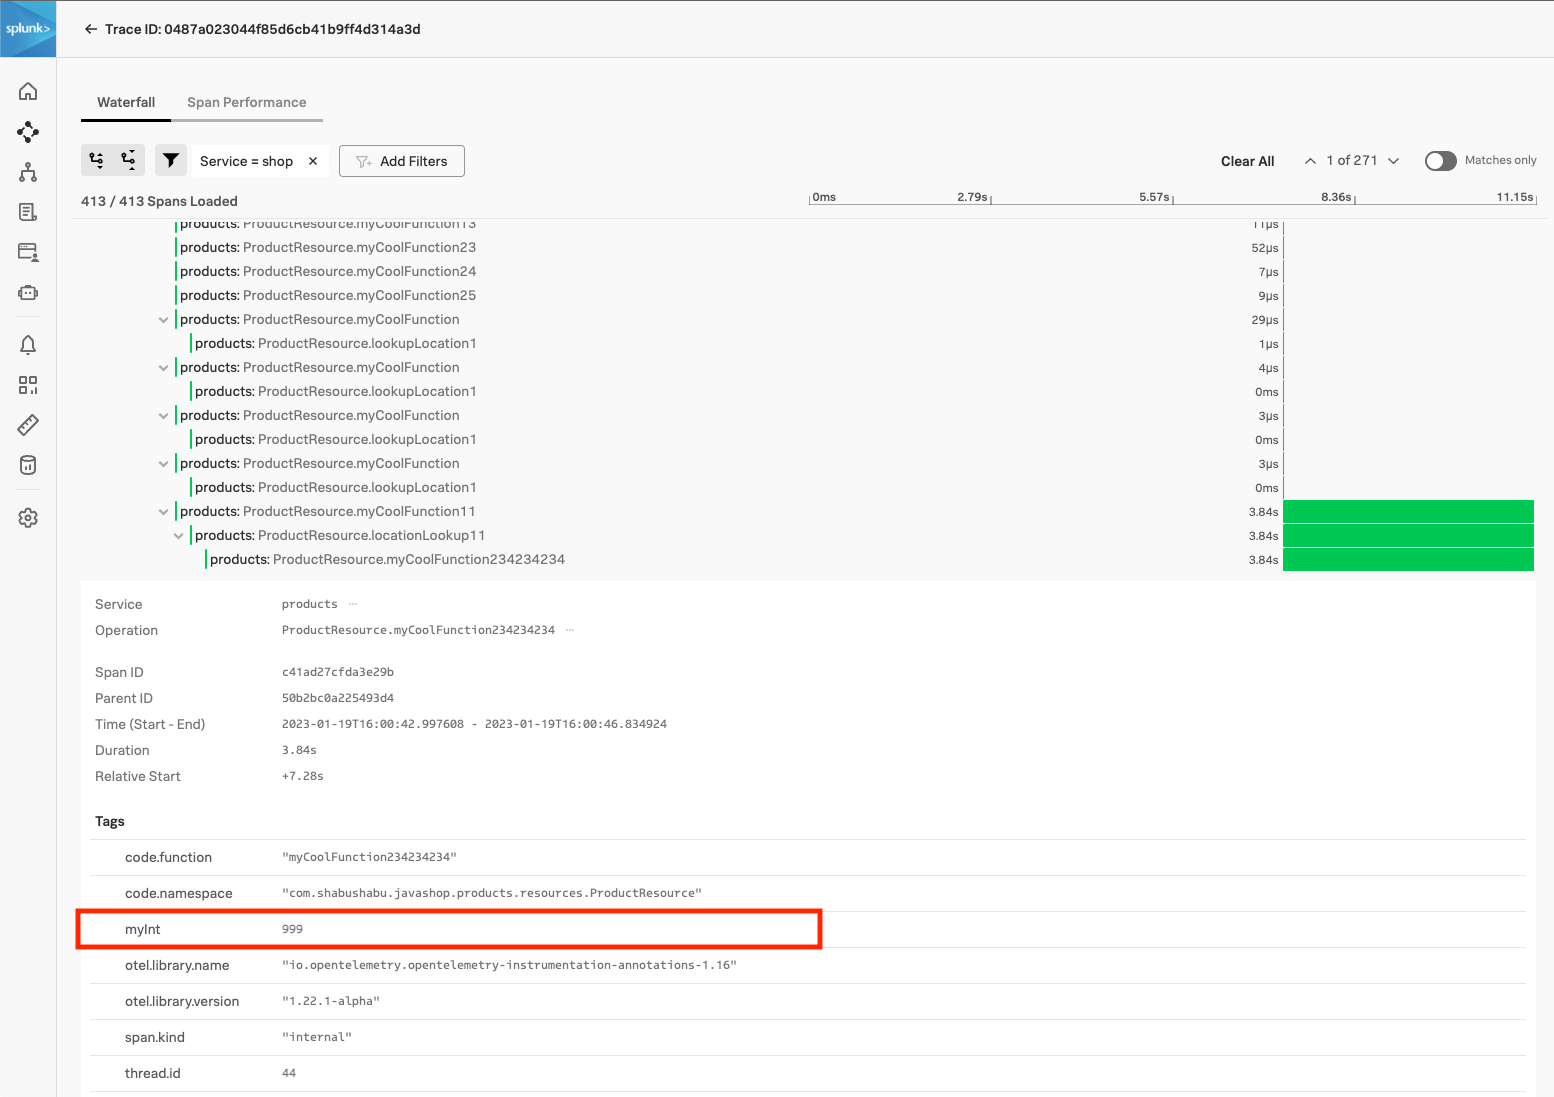
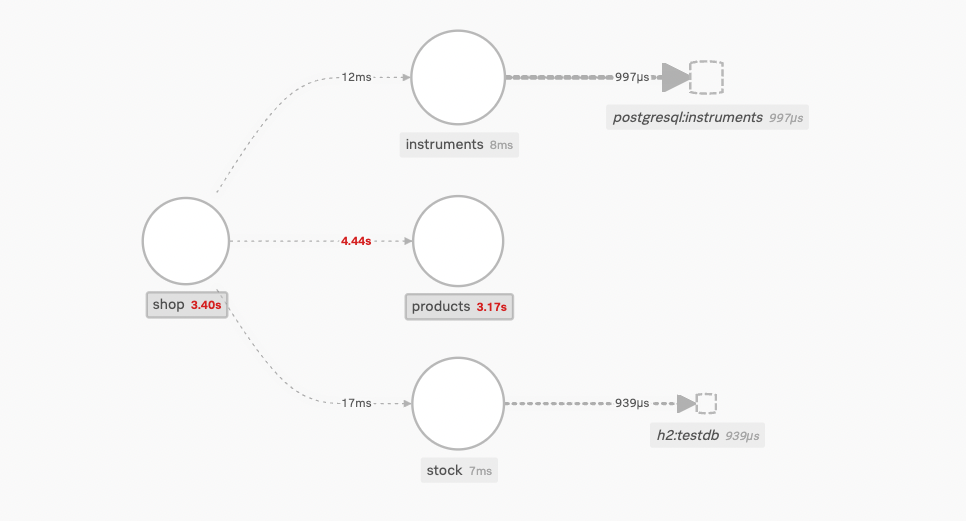
We can see that the actual function call that has the latency was not ProductResource.getAllProducts but the function call ProductResource.myCoolFunction234234234.
Since we now have the parameter tagged as part of our span metadata the actual root cause is seemingly related to the “location” Colorado. And it appears the one custom attribute that was tagged for function ProductResource.myCoolFunction234234234 was myInt with a value of 999. With this information a developer can debug very quickly.
We added additional span information, which we call Custom Attributes here at Splunk. In this case our Custom Attributes are Parameter Values at Time of Latency.
In our exmaple the myInt tag was created due our handy Annotator, that did the OpenTelemetry Annotations for us.
- Using nano:
nano products/src/main/java/com/shabushabu/javashop/products/resources/ProductResource.java- Search in Nano: [CTRL]-w
- Enter in: 999 [Enter]
We can see here, someone wrote some very bad code in the form of a long Sleep!
if (999==myInt)
    Thread.sleep(
        sleepy.nextInt(5000 - 3000) + 3000);