Fixing Code
Finding the Problem
How did we get here? How did the 999 end up in the trace as a Custom Attribute?
Take a look at the function signature
private void myCoolFunction234234234(@SpanAttribute("myInt") int myInt)@SpanAttribute("myint") is an OpenTelemetry Annotation that was added by our Java Otel Annotator tool.
Fixing the code
- Change this:
private void myCoolFunction234234234(@SpanAttribute("myInt") int myInt) {

// Generate a FAST sleep of 0 time !
Random sleepy = new Random();
try{
if (999==myInt)
Thread.sleep(
sleepy.nextInt(5000 - 3000)
+ 3000);
} catch (Exception e){- to this:
private void myCoolFunction234234234(@SpanAttribute("myInt") int myInt) {

// Generate a FAST sleep of 0 time !
Random sleepy = new Random();
try{
// if (999==myInt)
// Thread.sleep(
// sleepy.nextInt(5000 - 3000)
// + 3000);
} catch (Exception e){
which is basically placing comments (//) before the lines in myCoolFunction234234234 that are causing the slowness:
// if (999==myInt)
// Thread.sleep(
// sleepy.nextInt(5000 - 3000)
// + 3000);- Save the changes: [CTRL]-o [Enter]
- Exit: [CTRL]-x
Until we rebuild and restart our application this change isn’t implemented.
Find Other Issues
Let’s go see if our manual instrumentation uncovered any other issues we did not see before
So you may be asking yourself: “How does manual instrumentation alone show us “more problems” than before? Latency is latency, isn’t it?”
The answer is with auto-instrumentation you are in most situations NOT covering functions our customers’ development teams wrote, which is of course the bulk of what developers do. They write functions…. and of course this is where the bulk of software problems occur.
You may have noticed a new exception in our trace that was not present with Auto-Instrumentation during our latency fix use-case. Since we skipped over this, let’s walk you through it.
- Return to the service map
- Click on shop service
- Click Traces (on the right side)
- Click Errors Only
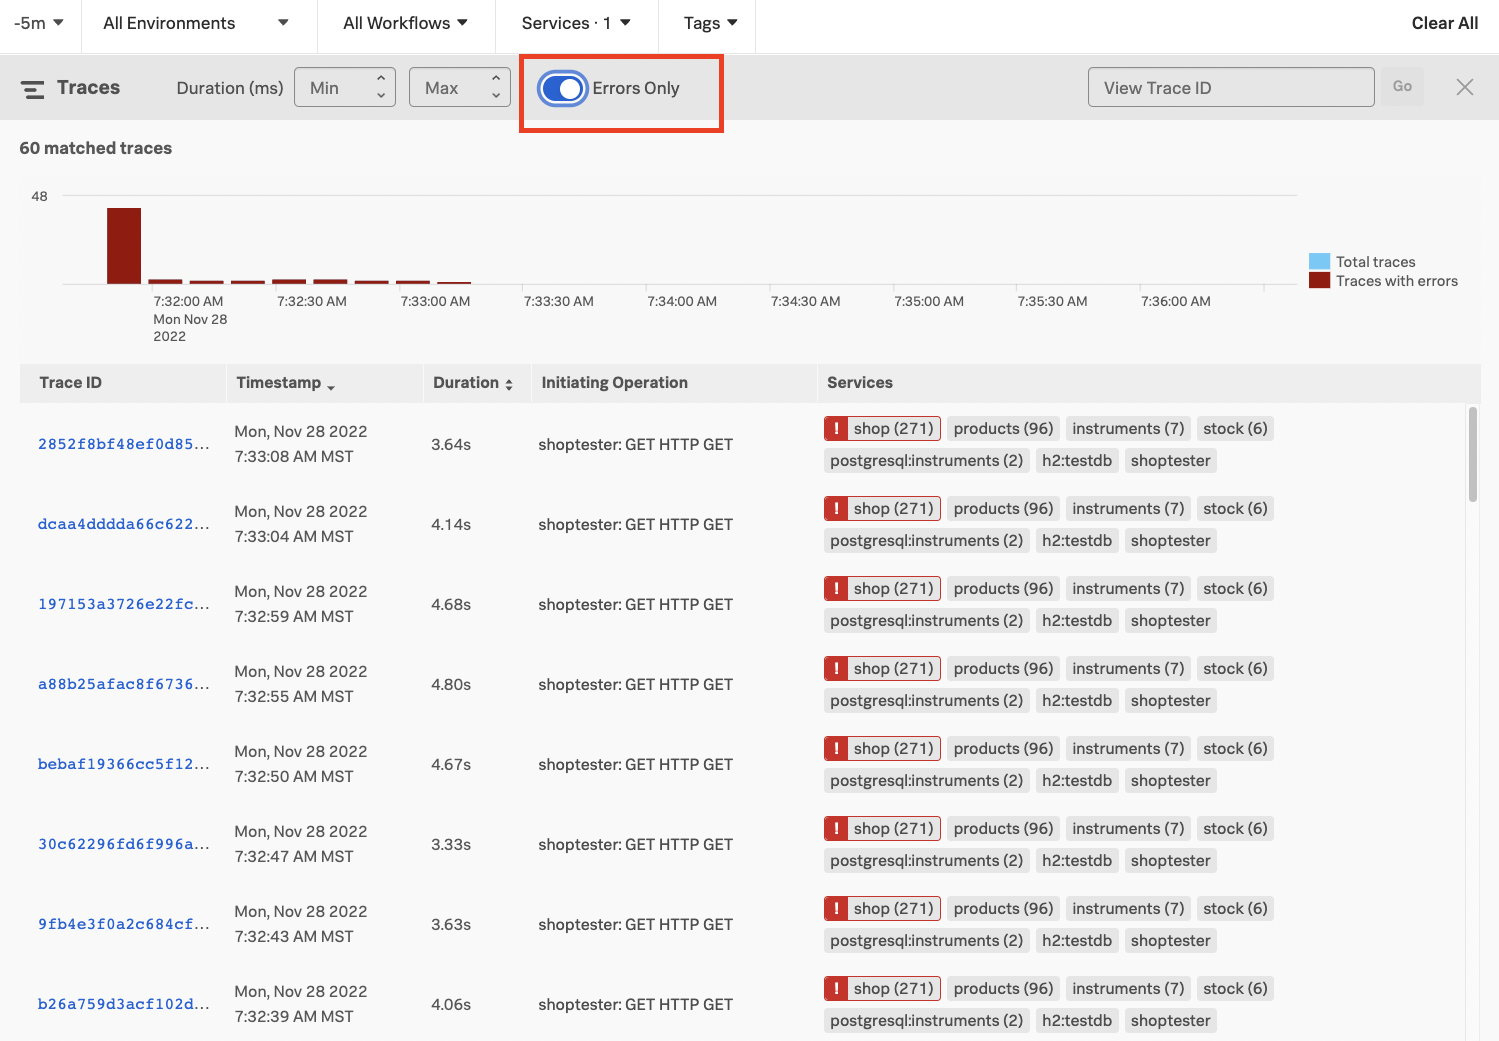
- Click on a trace with an error present
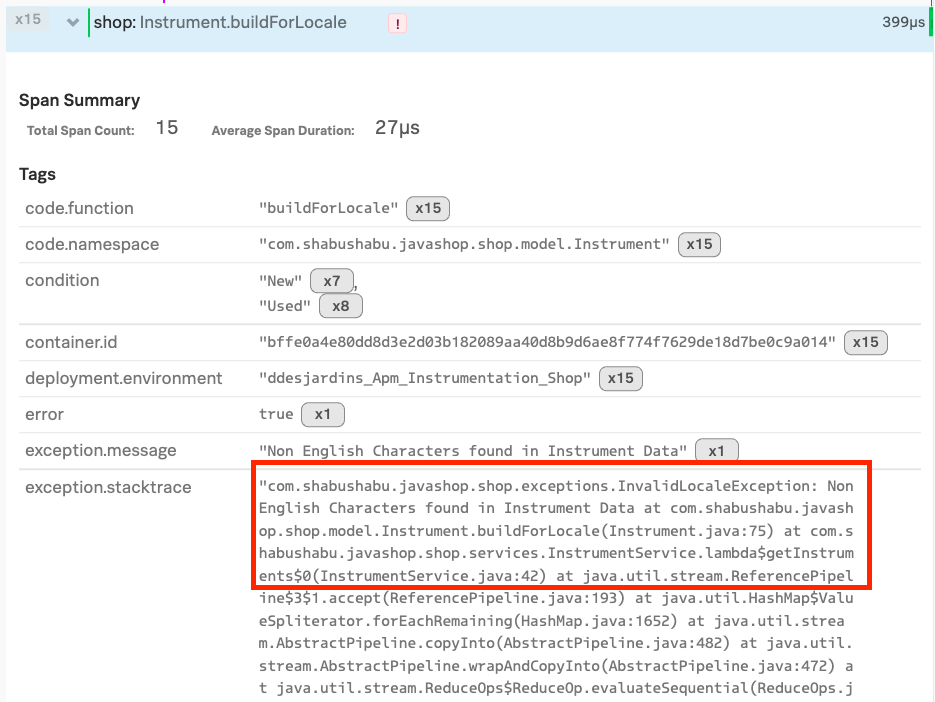
We can see our exception is InvalidLocaleException.
The real problem must be related to the new data associated with Sri Lanka as the Exception says “Non English Characters found in Instrument Data”.
This exception had not surfaced in previous traces based on ONLY Auto-Instrumentation because the method where it was thrown was NOT covered with Auto-Instrumentation.
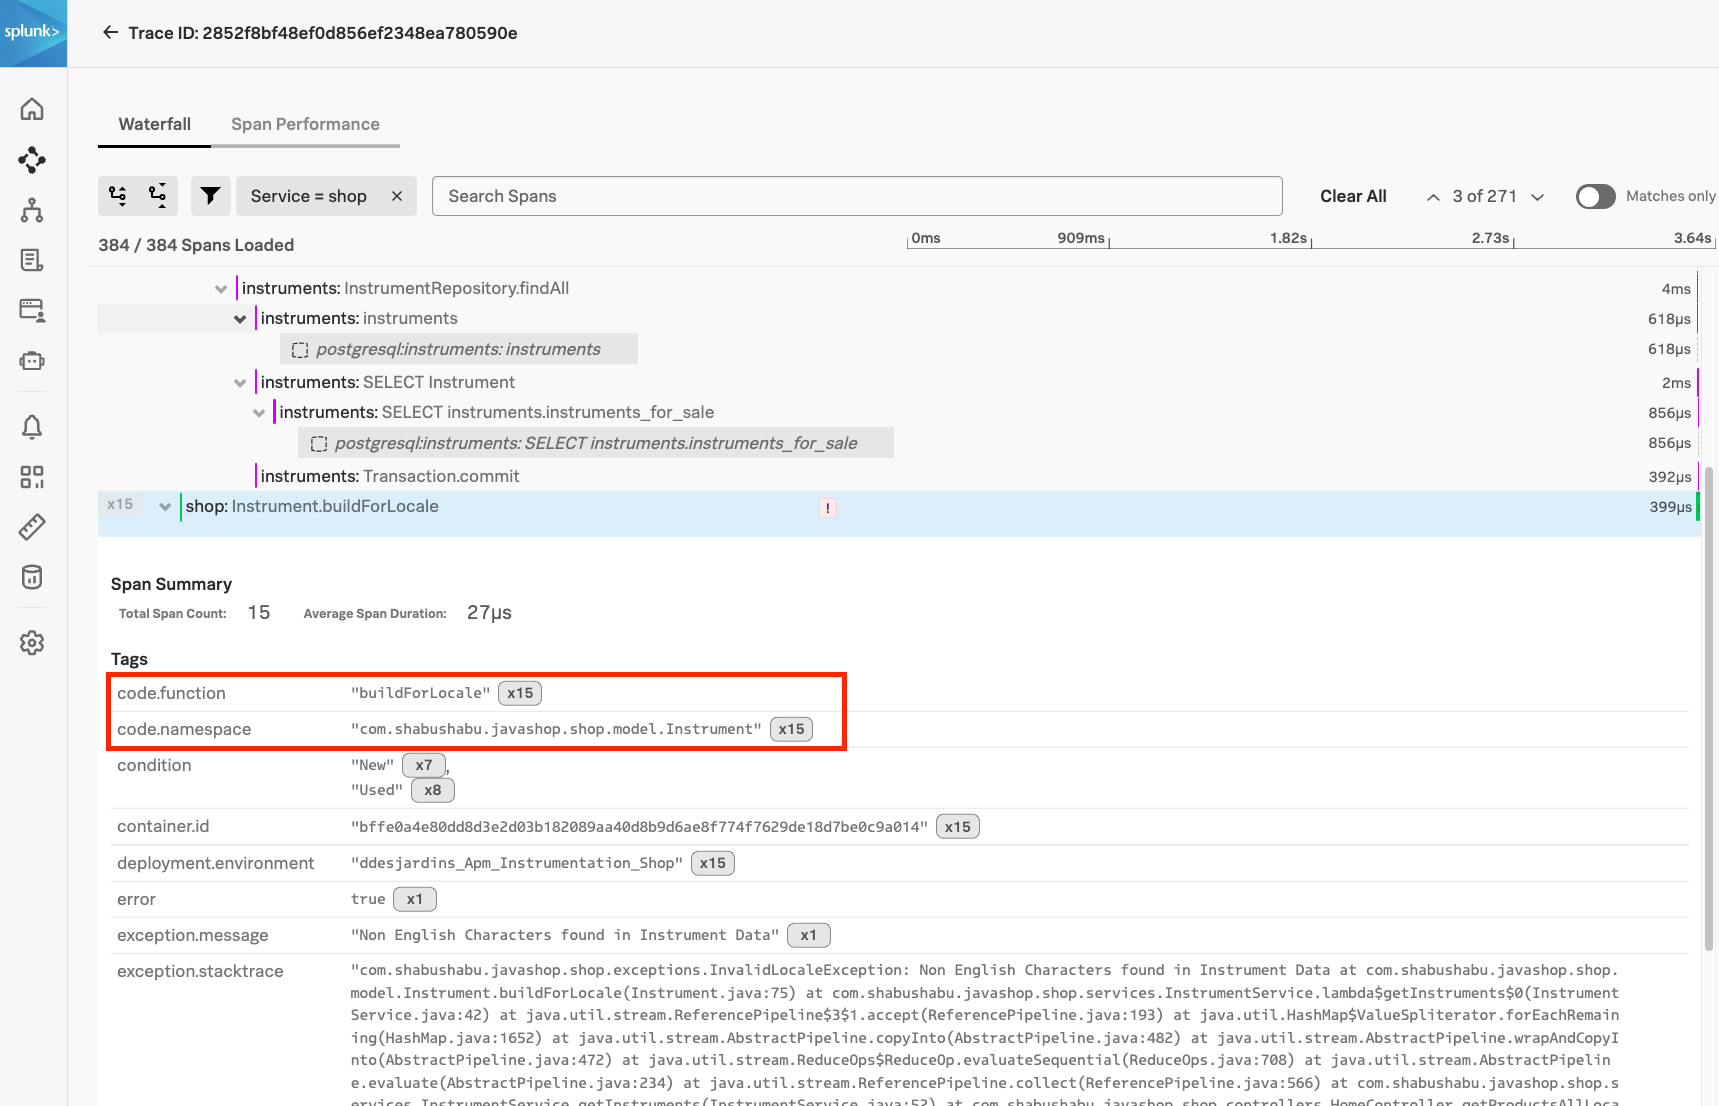
Once we completed the Manual Instrumentation via the Otel Annotator, this method was instrumented and we can now see we had a buried Exception being thrown.
Fixing more code
We already know exactly what file to look in and what method to look at as it is called out in the trace.
- Using nano:
nano shop/src/main/java/com/shabushabu/javashop/shop/model/Instrument.java- Search in Nano: [CTRL]-w
- Enter in: buildForLocale [Enter]
Look just above the buildForLocale function.
Notice the Annotation @WithSpan? @WithSpan is an OpenTelemetry Annotation for Java that automatically generates a span around a the function that follows.
@WithSpan
public Instrument buildForLocale(
  @SpanAttribute("id") long id, ...
  @SpanAttribute("seller_type") ...
  this.id= id;
Now let’s fix this code. We are going to simply comment this out for now and see if it fixes our latency issue.
- Change this:
if (!isEnglish(title)) {
  throw new InvalidLocaleException("Non English Characters found in Instrument Data");
 } else {
   System.out.println("Characters OK ");
}- to this (comment out if block):
// if (!isEnglish(title)) {
//   throw new InvalidLocaleException("Non English Characters found in Instrument Data");
// } else {
//   System.out.println("Characters OK ");
// }- Save the changes: [CTRL]-o [Enter]
- Exit: [CTRL]-x