5. Analyzing RUM Metrics
- See RUM Metrics and Session information in the RUM UI
- See correlated APM traces in the RUM & APM UI
1. RUM Overview Pages
From your RUM Application Summary Dashboard you can see detailed information by opening the Application Overview Page via the tripple dot  menu on the right by selecting Open Application Overview or by clicking the link with your application name which is jmcj-store in the example below.

This will take you to the RUM Application Overview Page screen as shown below.
2. RUM Browser Overview
2.1. Header
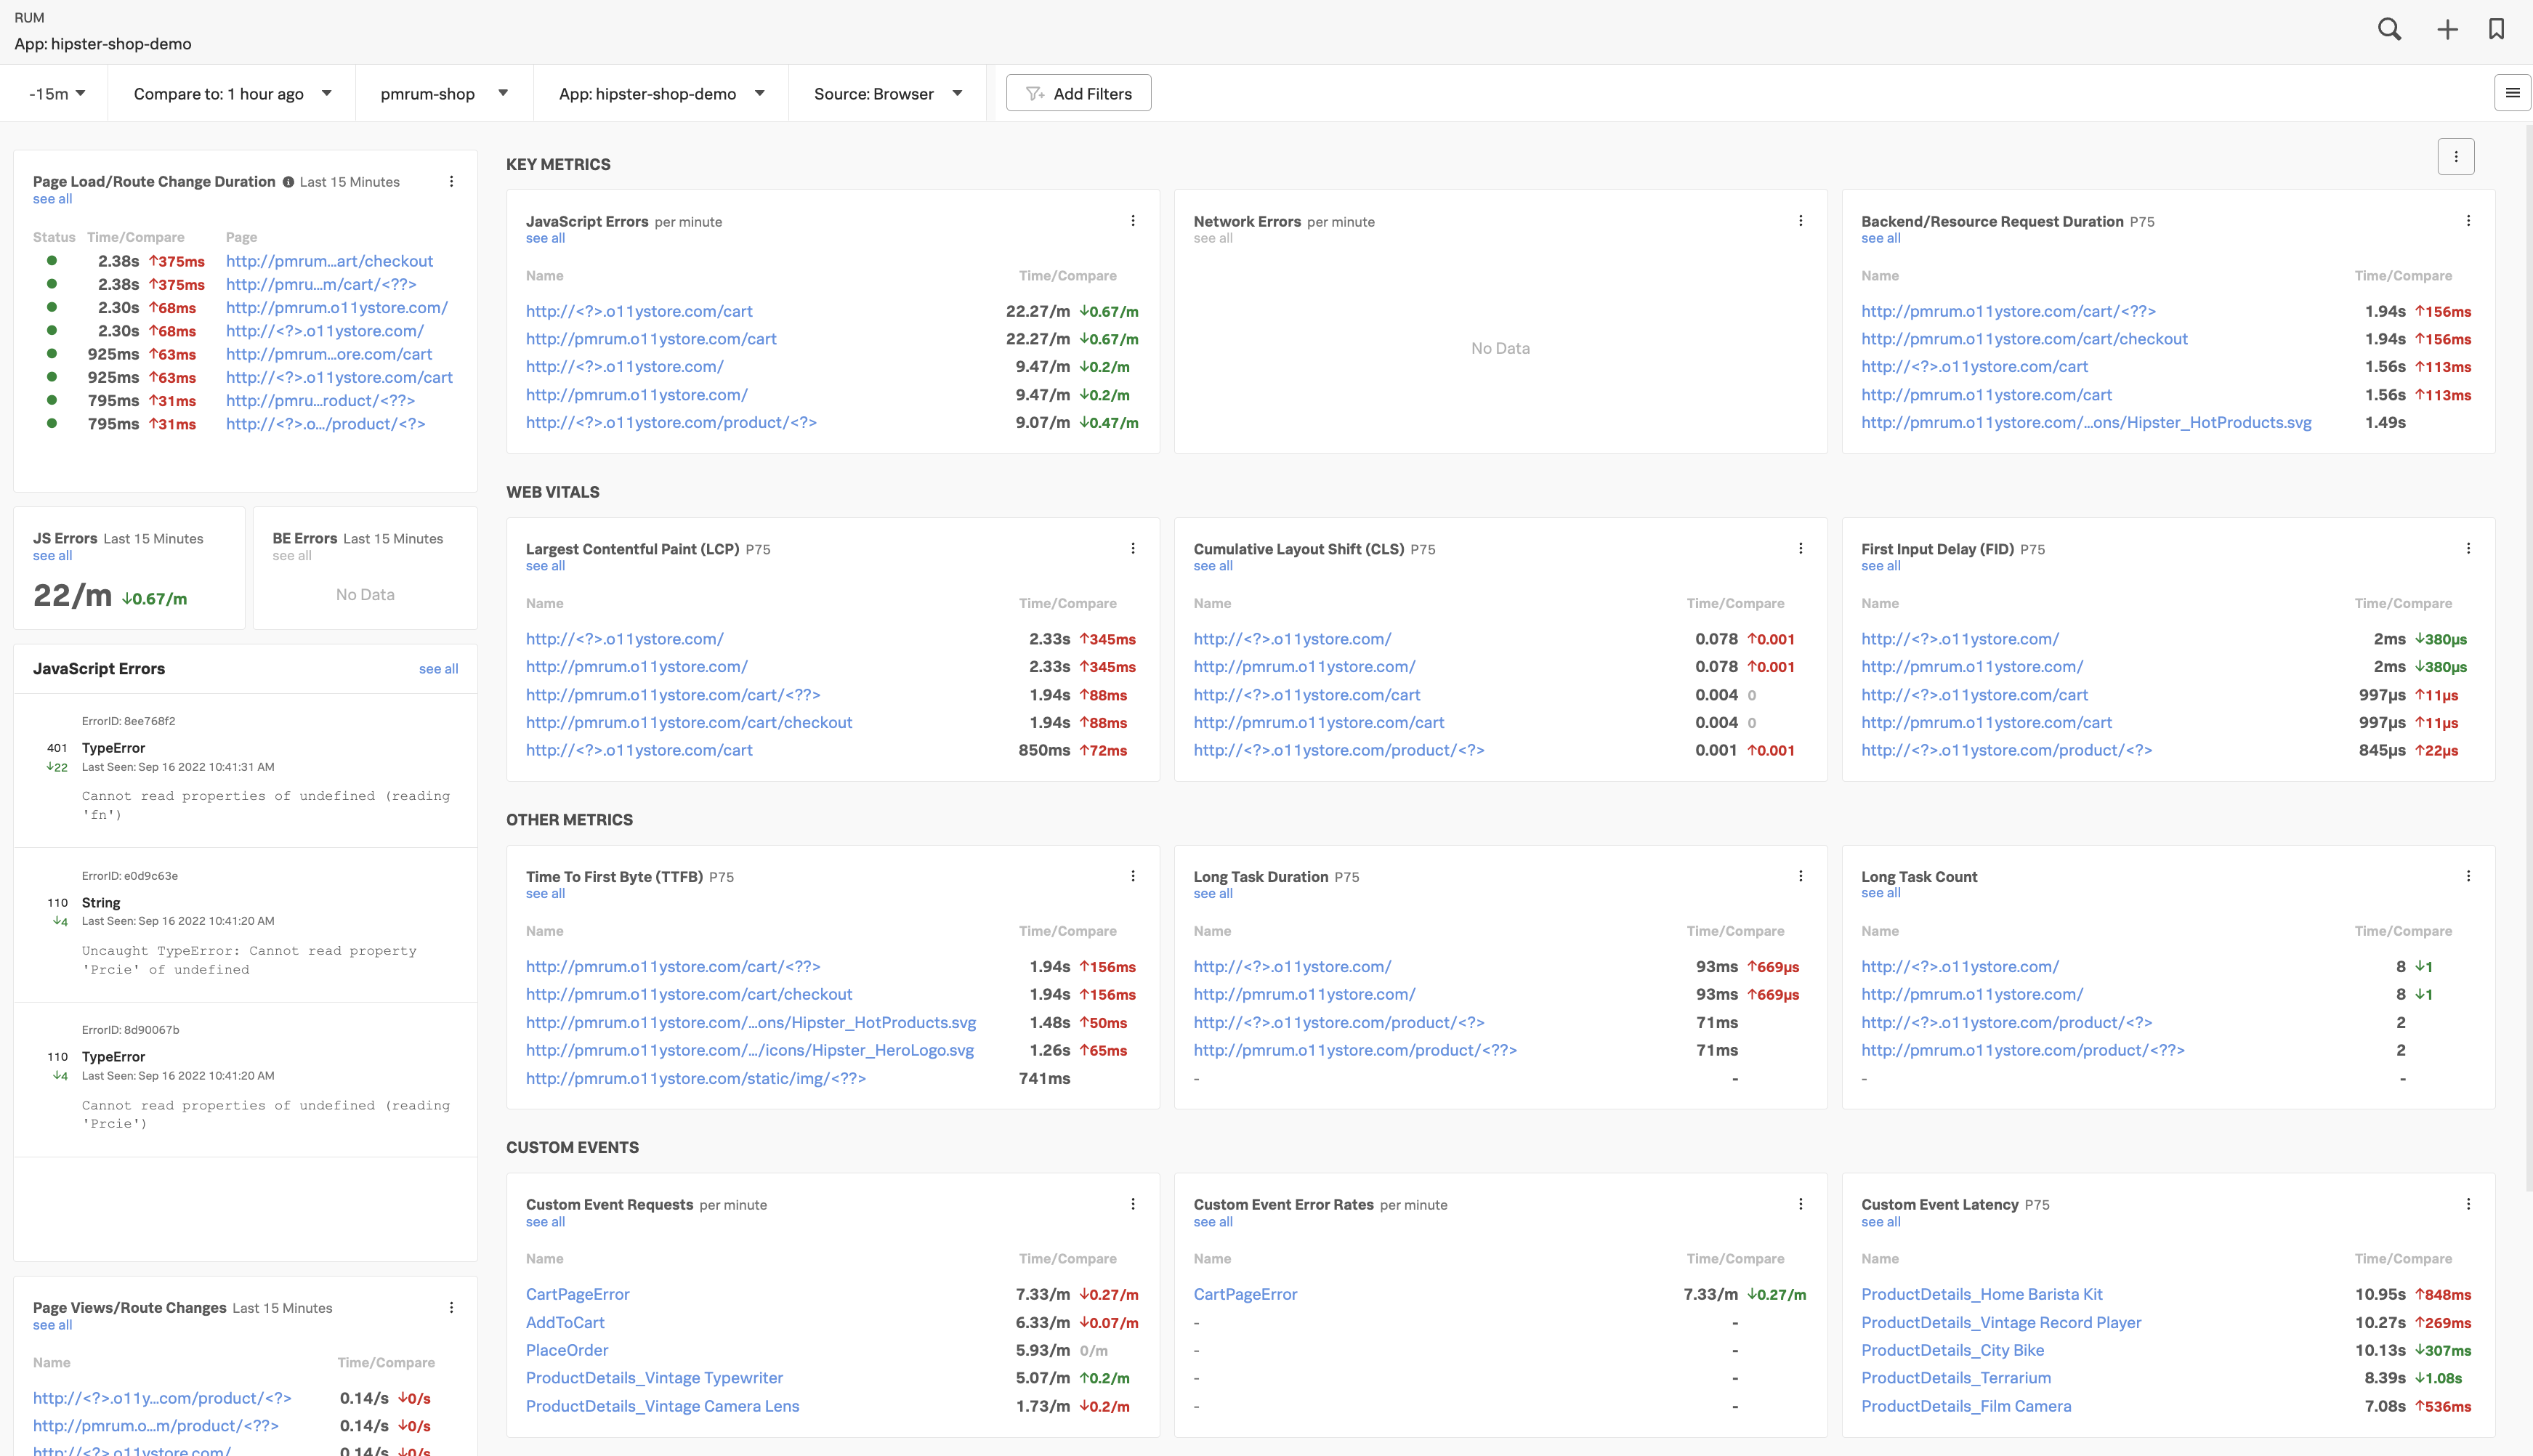
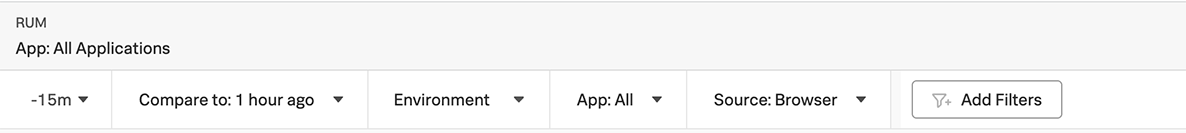
The RUM UI consists of 6 major sections. The first is the selection header, where you can set/filter a number of options:
- A drop down for the time window you’re reviewing (You are looking at the past hour in this case)
- A drop down to select the Comparison window (You are comparing current performance on a rolling window - in this case compared to 1 hour ago)
- A drop down with the available Environments to view: (Choose the one provided by the workshop host or All like in the example)
- A drop down list with the Various Web apps (You can use the one provided by the workshop host or use All)
- Optionally a drop down to select Browser or Mobile metrics (Might not be available in your workshop)
2.2. Overview Pane
The Overview Panes, down the left hand side of the page, give you a summary of the pages which have increased load times.
In the example here you can see that the checkout and cart pages have errors due to the yellow triangles, and you can see that the load time has increased by 2.38 to 5.50 seconds.
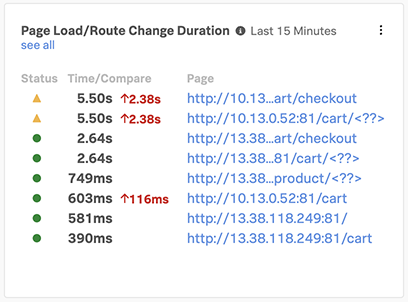
You also see an overview of the number of Front end Error and Backend Errors per minute, and we appear to have three JavaScript errors on our site.
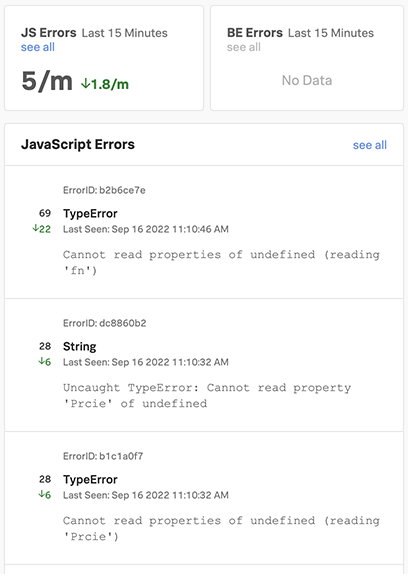
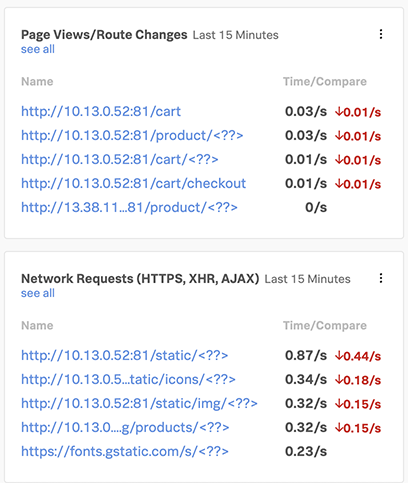
The last two panes show you the Top Page Views and the Top Network Requests.
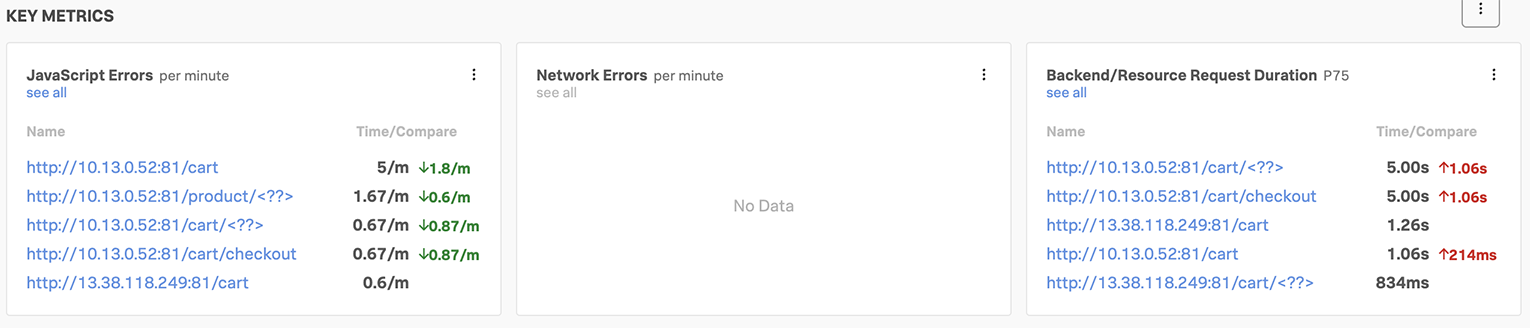
2.3. Key Metrics Pane
The Key Metrics View is the location where you will find the metrics for the number of JavaScript Errors per second, Network Errors per second an the Backend/Resource Request Duration. These Metrics are very useful to guide you to the location of an issue if you are experiencing problems with your site.
2.4. Web Vitals Pane
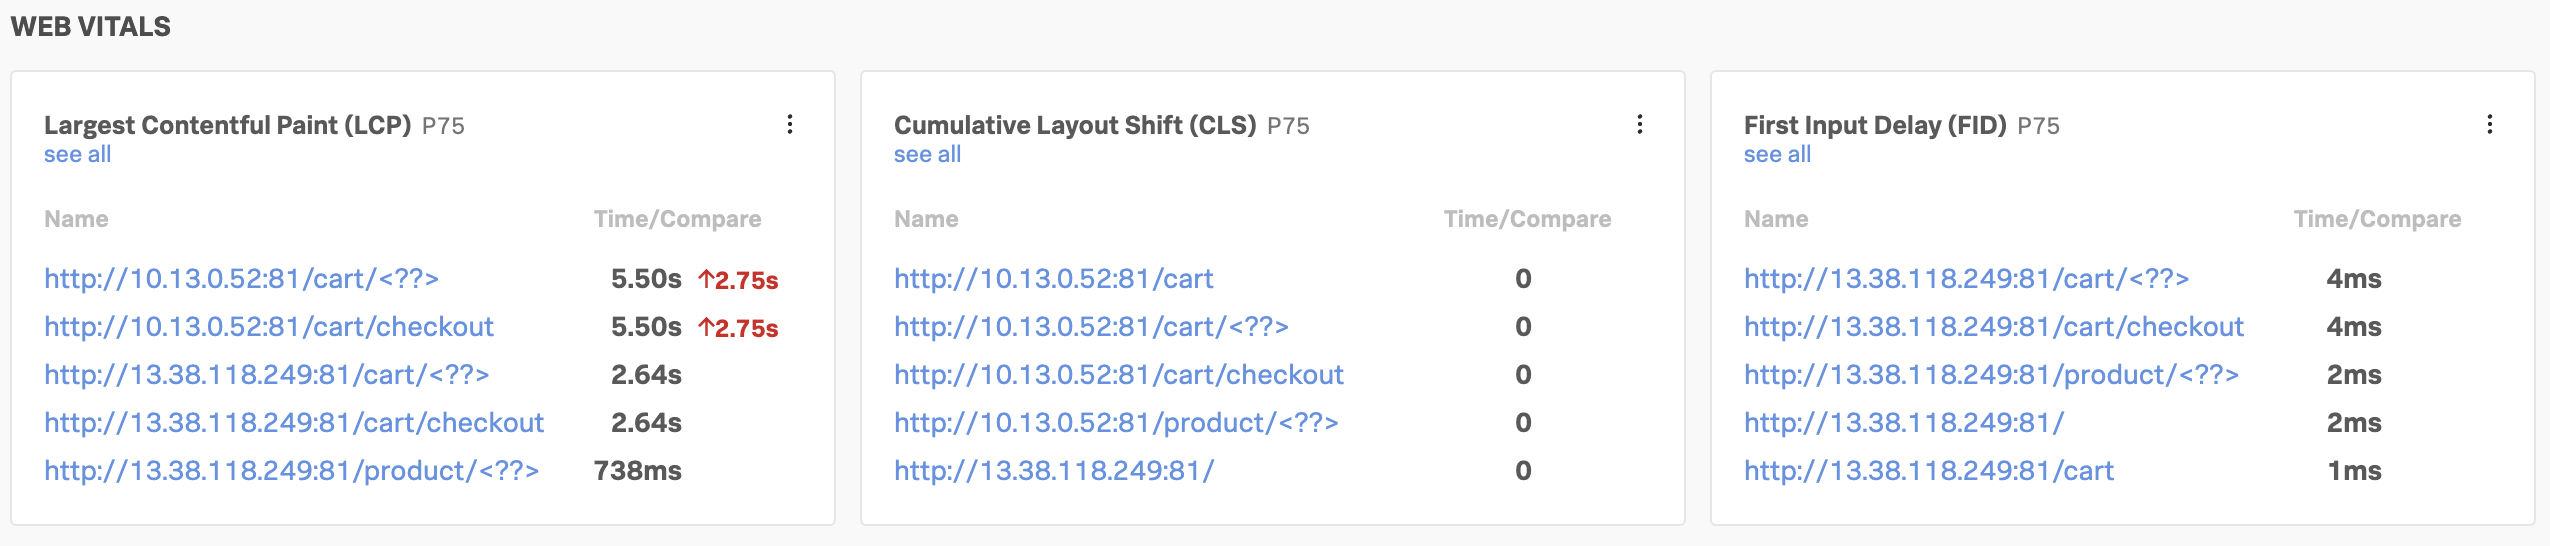
The Web Vitals view is the location where you go if you wish to get insight into the experience you are delivering to your End users based on Web Vitals metrics. Web Vitals is an initiative by Google to provide unified guidance for quality signals that are essential to delivering a great user experience on the web and focuses on three key parameters:
- Largest Contentful Paint (LCP), measures loading performance. To provide a good user experience, LCP should occur within 2.5 seconds of when the page first starts loading.
- First Input Delay (FID), measures interactivity. To provide a good user experience, pages should have a FID of 100 milliseconds or less.
- Cumulative Layout Shift (CLS), measures visual stability. To provide a good user experience, pages should maintain a CLS of 0.1. or less.
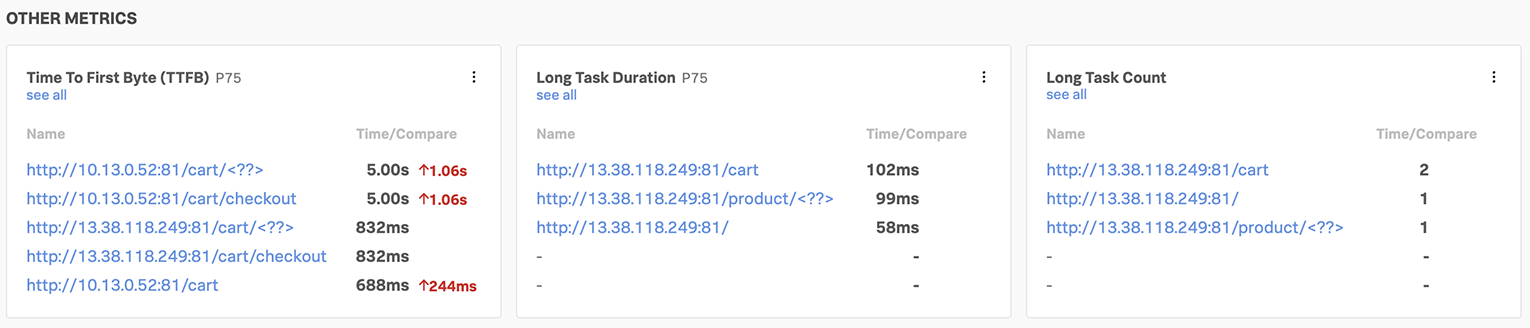
2.5. Other Metrics Pane
The Other Metrics Pane is the location where you find other performance metrics, with a focus on initial load time of your page or tasks that are taking too long to complete.
- Time To First Byte (TTFB), measures how long it takes for a client’s browser to receive the first byte of the response from the server. The longer it takes for the server to process the request and send a response, the slower your visitors’ browser is at displaying your page.
- Long Task Duration, a performance metric that can be used help developers to understand the bad user experience on the website, or can be an indication of a problem.
- Long Task Count, a metric to indicate how often a long task occurs, again used for exploring user experiences or problem detection.
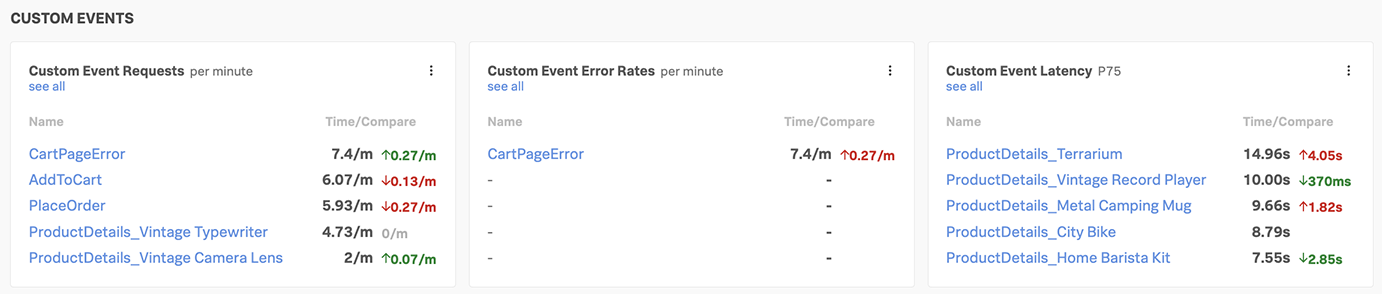
2.6. Custom Event Pane
The Custom Event View is the location where you will find the metrics for any event you may have added yourself to the web pages you are monitoring.
As we have seen in the RUM enabled website, we have added the following two lines:
const Provider = SplunkRum.provider;
var tracer=Provider.getTracer('appModuleLoader');
These lines will automatically create custom Events for every new Page, and you can also add these to pieces of custom code that are not part of a framework or an event you created so you can better understand the flow though your application. We support Custom Event Requests, Custom Event Error Rates and Custom Event Latency metrics.