Key Takeaways
During the workshop, we have seen how the Splunk Observability Cloud in combination with the OpenTelemetry signals (metrics, traces and logs) can help you to reduce mean time to detect (MTTD) and also reduce mean time to resolution (MTTR).
- We have a better understanding of the Main User interface and its components, the Landing, Infrastructure, APM, RUM, Synthetics, Dashboard pages, and a quick peek at the Settings page.
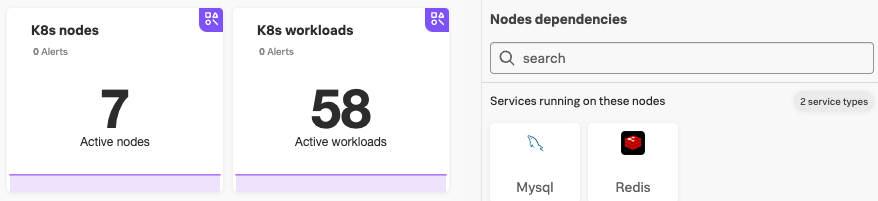
- Depending on time, we did an Infrastructure exercise and looked at Metrics used in the Kubernetes Navigators and saw related services found on our Kubernetes cluster:
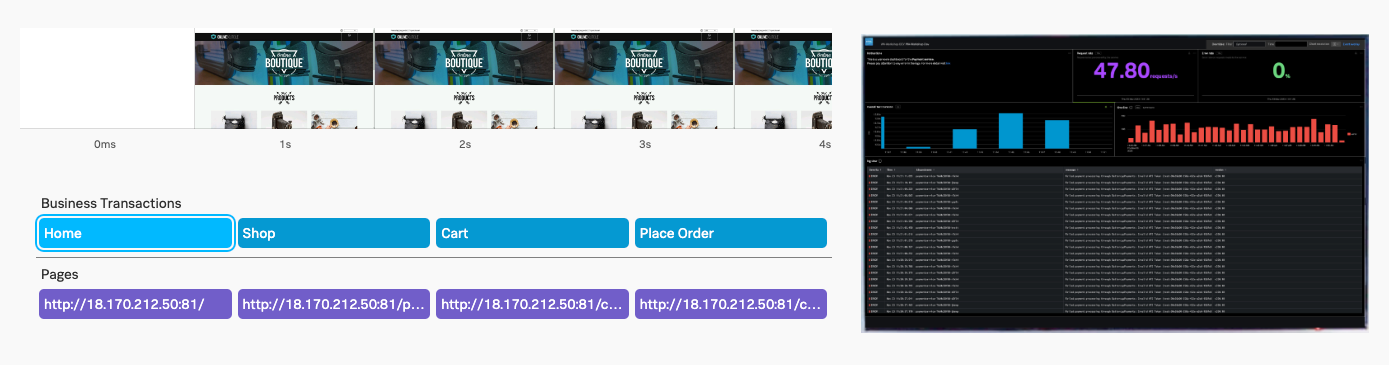
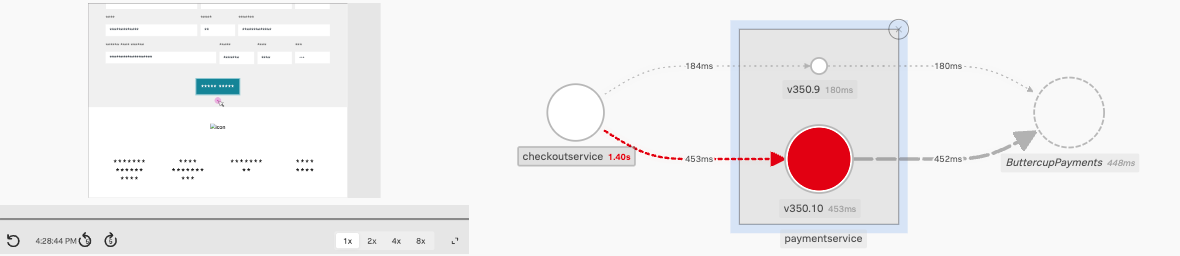
- Understood what users were experiencing and used RUM & APM to Troubleshoot a particularly long page load, by following its trace across the front and back end and right to the log entries. We used tools like RUM Session replay and the APM Dependency map with Breakdown to discover what is causing our issue:
- Used Tag Spotlight, in both RUM and APM, to understand blast radius, detect trends and context for our performance issues and errors. We drilled down in Span’s in the APM Trace waterfall to see how services interacted and find errors:
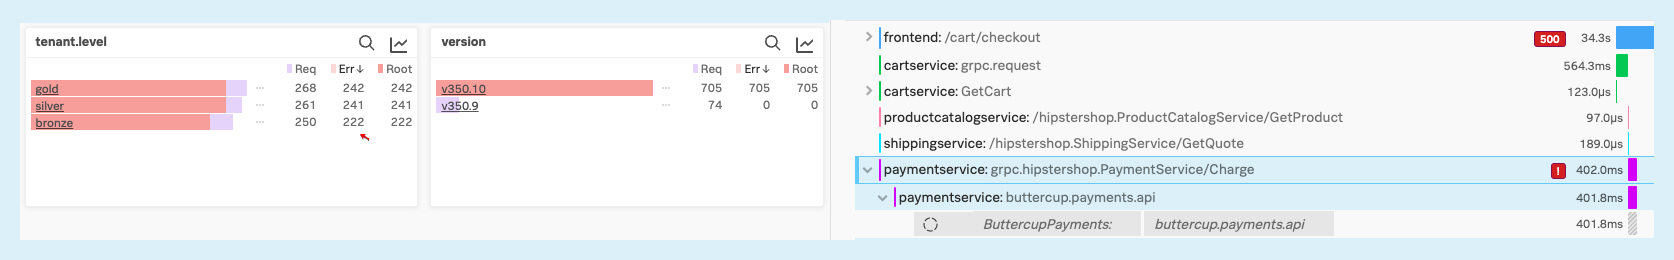
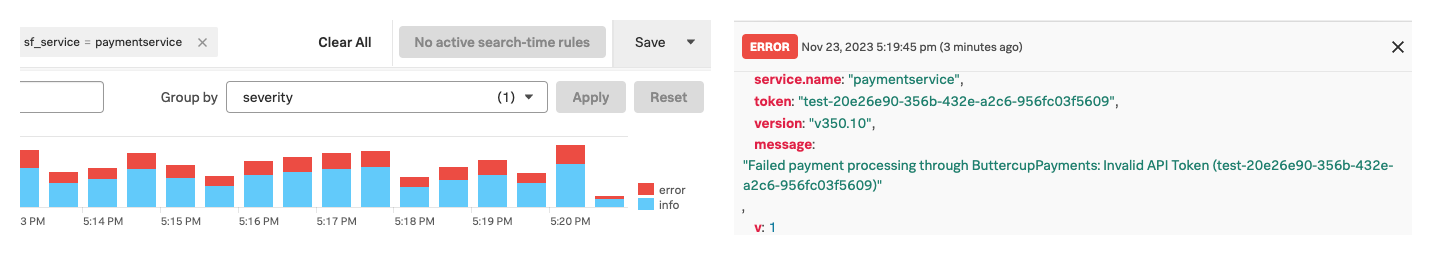
- We used the Related content feature to follow the link between our Trace directly to the Logs related to our Trace and used filters to drill down to the exact cause of our issue.
We then looked at Synthetics, which can simulate web and mobile traffic and we used the available Synthetic Test, first to confirm our finding from RUM/AMP and Log observer, then we created a Detector so we would be alerted if when the run time of a test exceeded our SLA.
In the final exercise, we created a health dashboard to keep that running for our Developers and SREs on a TV screen: