Real User Monitoring Home Page
Click RUM in the main menu, this will bring you to the main RUM Home or Landing page. The main concept of this page is to provide you at a glance, the overall status of all selected RUM applications, either in a full dashboard or the compact view.
Independent of the type of Status Dashboard used, the RUM Home Page is made up of 3 distinct sections:
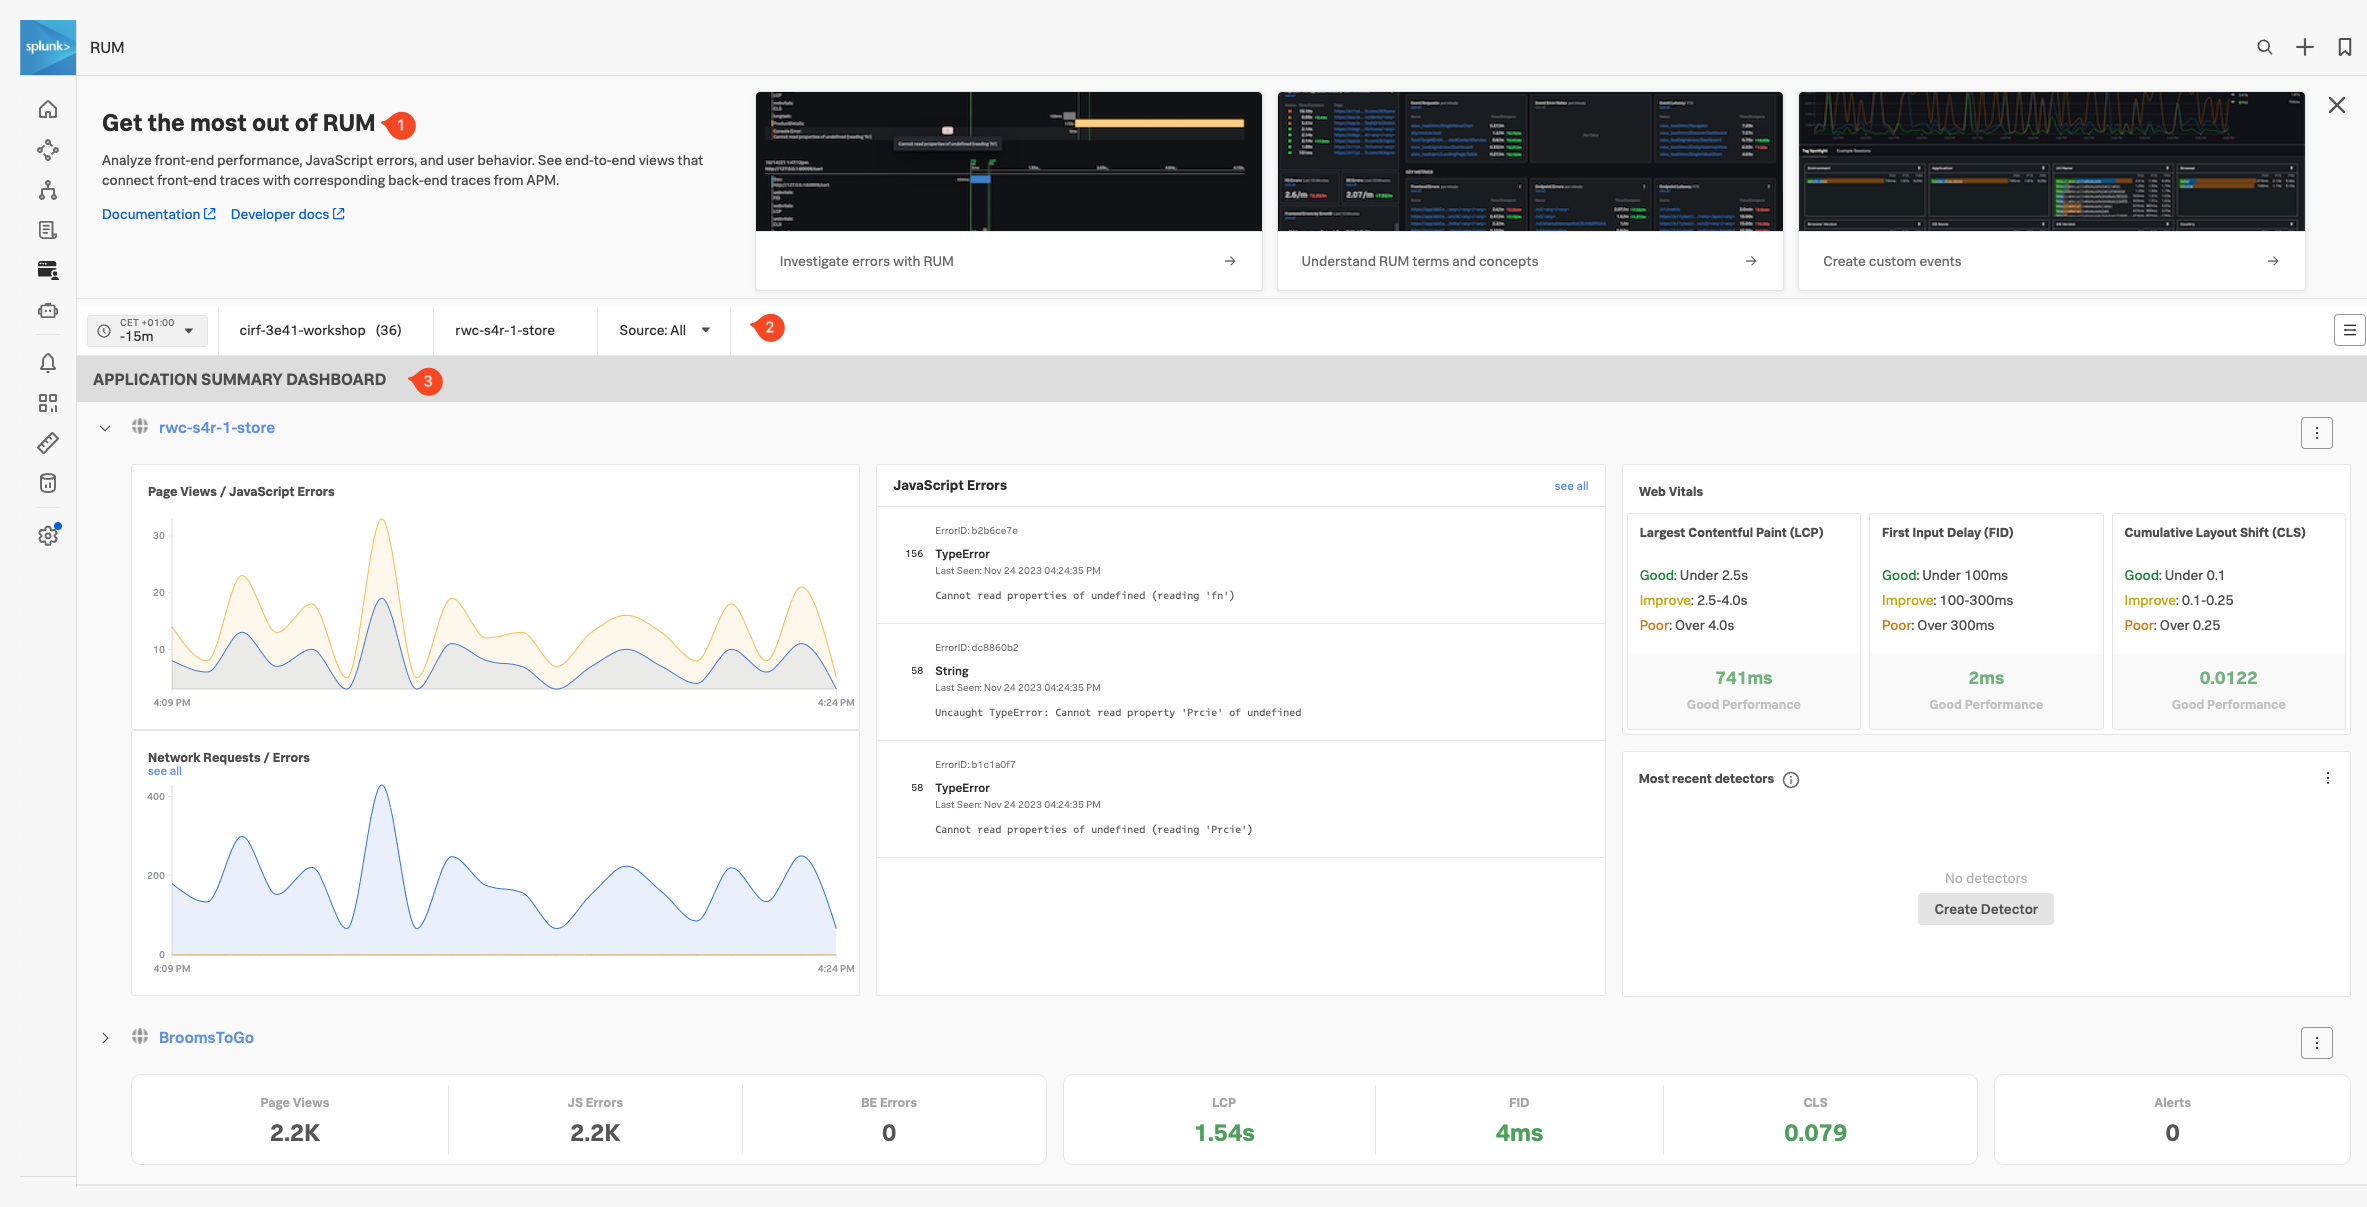
- Onboarding Pane: Training videos and links to documentation to get you started with Splunk RUM. (You can hide this pane in case you need the screen real estate).
- Filter Pane: Filter on the time frame, environment, application and source type.
- Application Summary Pane: Summary of all your applications that send RUM data.
RUM Environments & Application and Source Type
- Splunk Observability uses the environments Tag that is sent as part of the RUM trace, (created with every interaction with your website or Mobile App), to separate data coming from different environments like “Production” or “Development”.
- A further separation can be made by the Applications Tag. This allows you to distinguish between separate browser/mobile applications running in the same environment.
- Splunk RUM is available for both browser and mobile applications, you could use Source Type to distinguish between them, however for this workshop, we will only use browser-based RUM.
Exercise
- Ensure the time window is set to -15m
- Select the environment for your workshop from the drop-down box. The naming convention is [NAME OF WORKSHOP]-workshop (Selecting this will make sure the workshop RUM application is visible)
- Select the App name. There the naming convention is [NAME OF WORKSHOP]-store and leave Source set to All
- In the JavaScript Errors tile click on the TypeError entry that says: Cannot read properties of undefined (reading ‘Prcie’) to see more details. Note that you are given a quick indication of what part of the website the error occurred, allowing you to fix this quickly.
- Close the pane.
- The 3rd tile reports Web Vitals, a metric that focuses on three important aspects of the user experience: loading, interactivity, and visual stability.
Based on the Web Vitals metrics, how do you rate the current web performance of the site?
According to the Web Vitals Metrics, the initial load of the site is OK and is rated Good
- The last tile, Most recent detectors tile, will show if any alerts have been triggered for the application.
- Click on the down ⌵ arrow in front of the Application name to toggle the view to the compact style. Note that you have all the main information available in this view as well. Click anywhere in the compact view to go back to the full view.
Next, let’s check out Splunk Application Performance Monitoring (APM).