Log Observer Home Page
Click Log Observer in the main menu, the Log Observer Home Page is made up of 4 distinct sections:
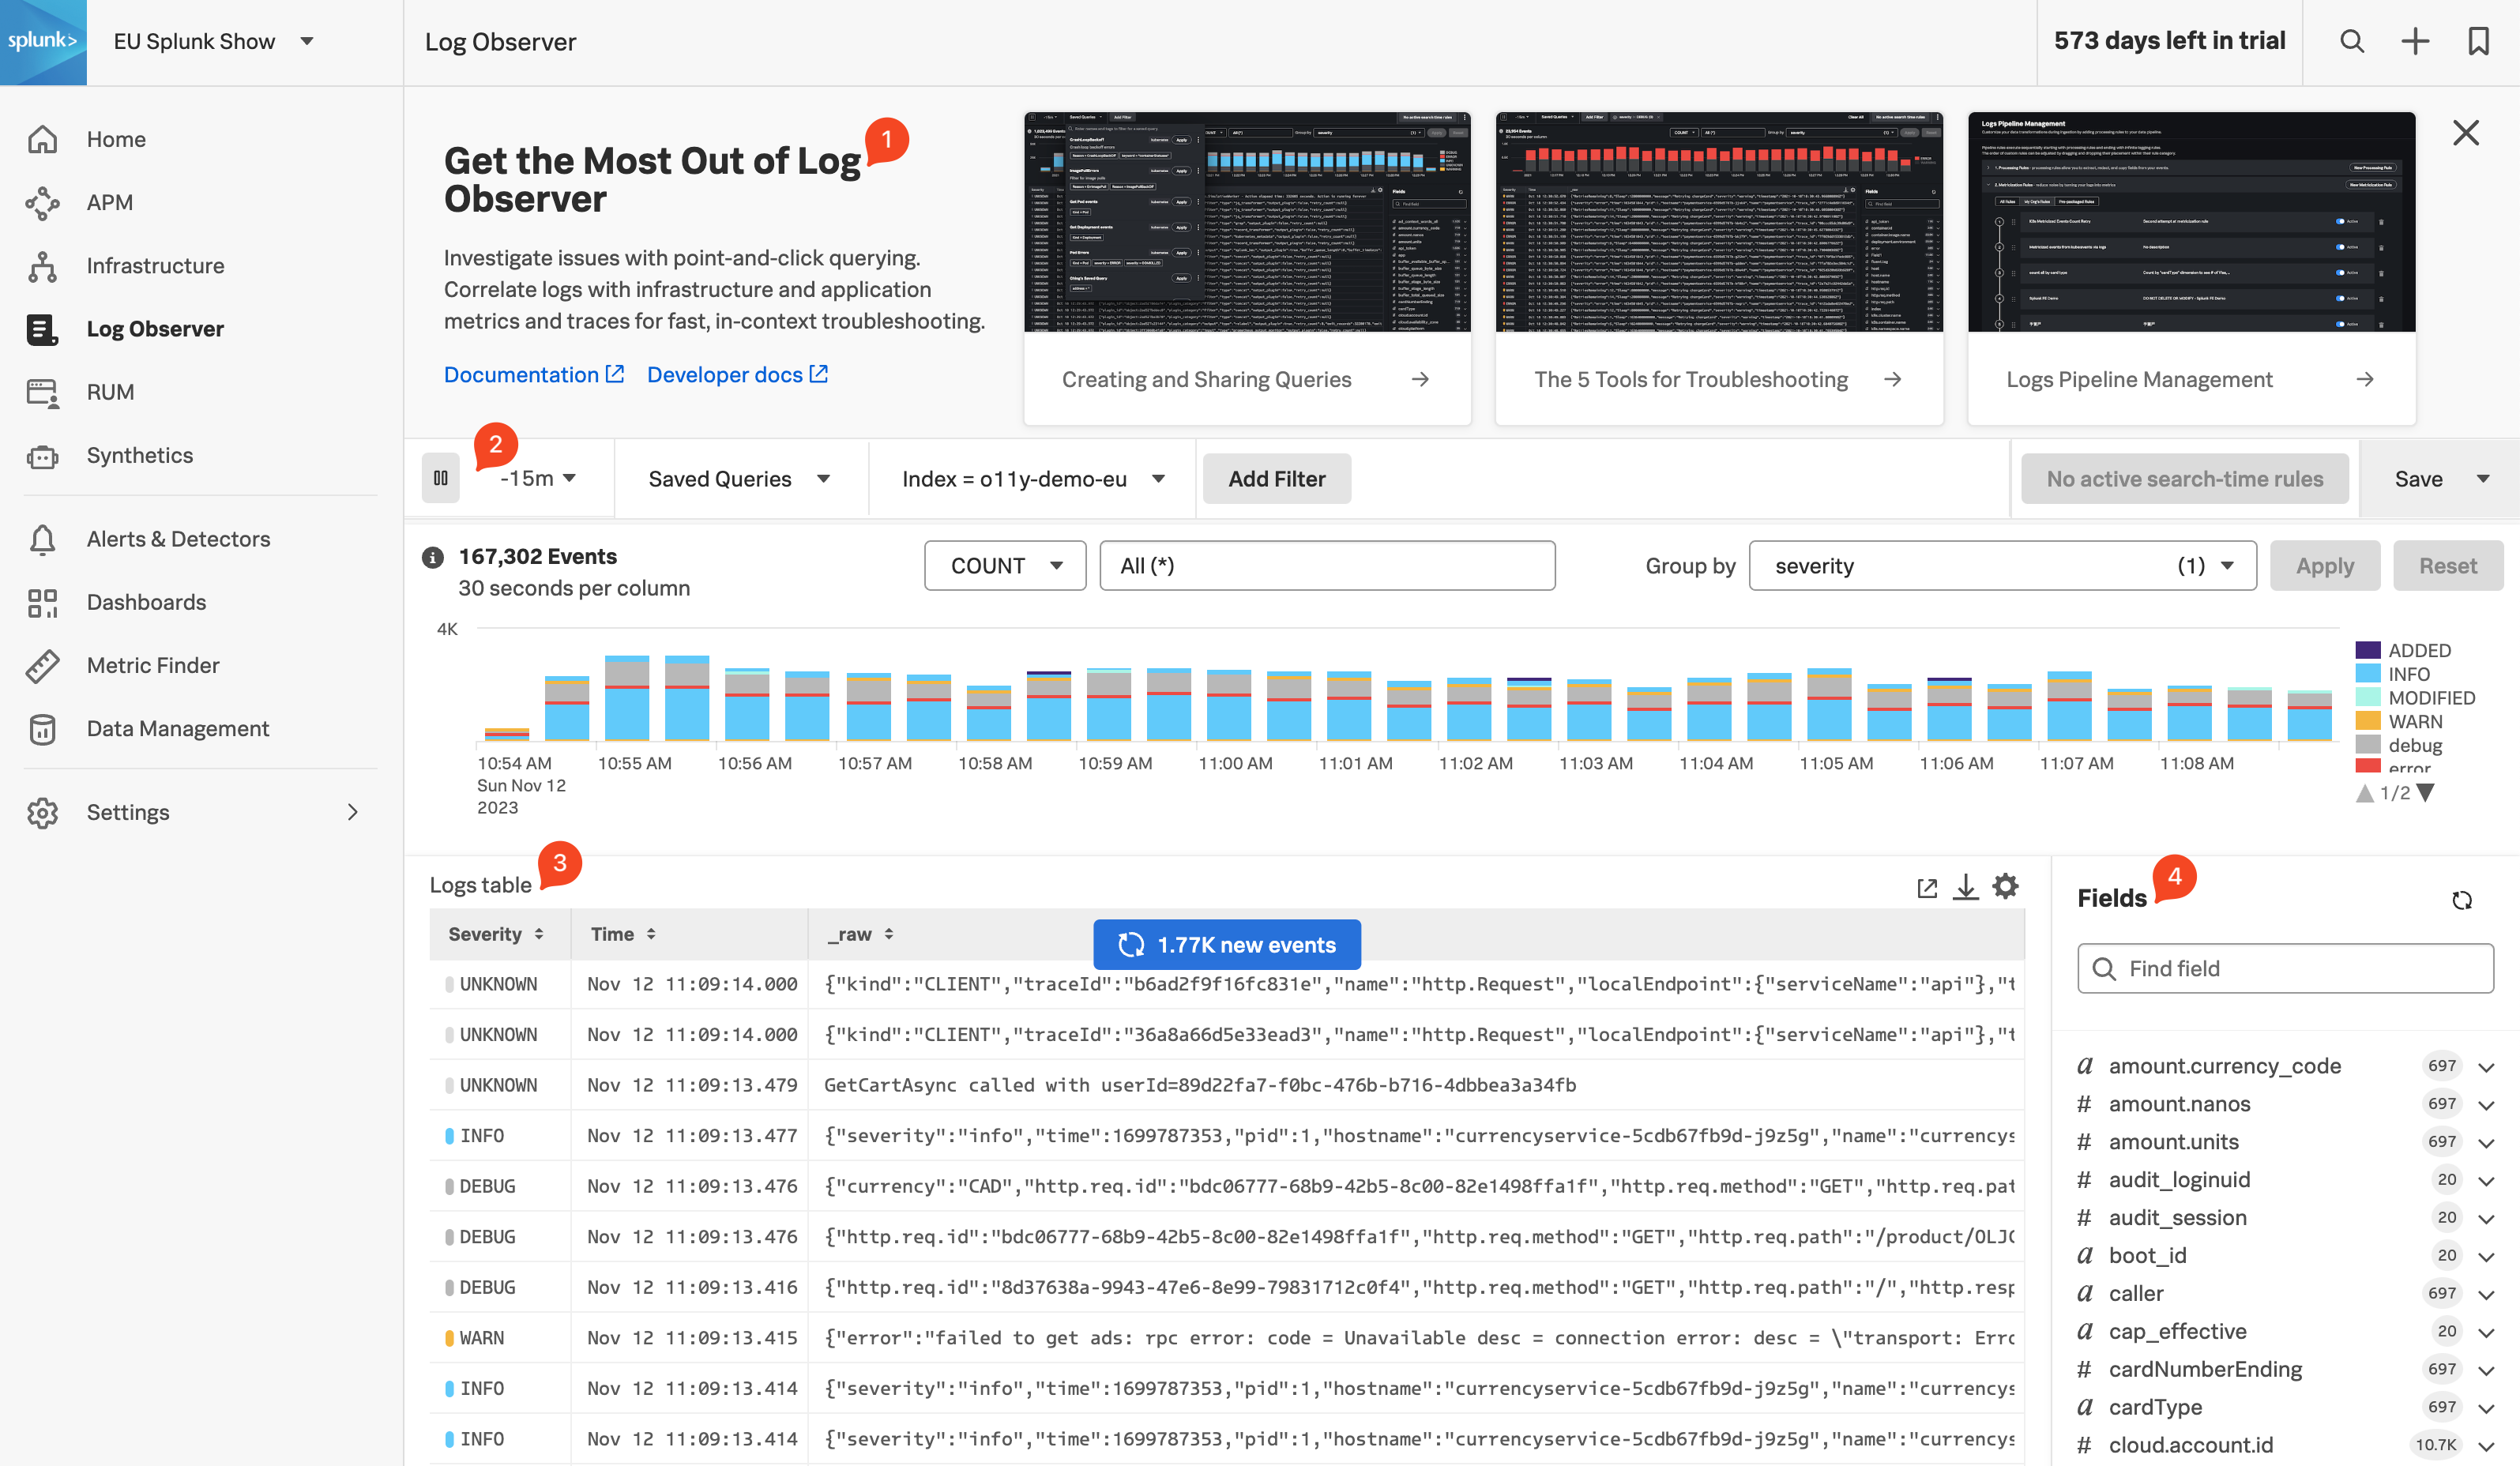
- Onboarding Pane: Training videos and links to documentation to get you started with Splunk Log Observer.
- Filter Bar: Filter on time, indexes, and fields and also Save Queries.
- Logs Table Pane: List of log entries that match the current filter criteria.
- Fields Pane: List of fields available in the currently selected index.
Splunk indexes
Generally, in Splunk, an “index” refers to a designated place where your data is stored. It’s like a folder or container for your data. Data within a Splunk index is organized and structured in a way that makes it easy to search and analyze. Different indexes can be created to store specific types of data. For example, you might have one index for web server logs, another for application logs, and so on.
Tip
If you have used Splunk Enterprise or Splunk Cloud before, you are probably used to starting investigations with logs. As you will see in the following exercise, you can do that with Splunk Observability Cloud as well. This workshop, however, will use all the OpenTelemetry signals for investigations.
Let’s run a little search exercise:
Exercise
Set the time frame to -15m.
Click on Add Filter in the filter bar then click on Fields in the dialog.
Type in cardType and select it.
Under Top values click on visa, then click on = to add it to the filter.

Click on one of the log entries in the Logs table to validate that the entry contains
cardType: "visa".Let’s find all the orders that have been shipped. Click on Clear All in the filter bar to remove the previous filter.
Click again on Add Filter in the filter bar, then select Keyword. Next just type
order:in the Enter Keyword… box and press enter.You should now only have log lines that contain the word “order:”. There are still a lot of log lines, so let’s filter some more.
Add another filter, this time select the Fields box, then type
severityin the Find a field… search box and select it.
Make sure you click the Exclude all logs with this fields at the bottom of the dialog box, as the order log line does not have a severity assigned. This will remove the others.
You may need to scroll down the page if you still have the onboarding content displayed at the top to see the Exclude all logs with this fields button.
You should now have a list of orders sold for the last 15 minutes.
Next, let’s check out Splunk Synthetics.