Synthetics Home Page
Click on Synthetics in the main menu. This will bring us to the Synthetics Home Page. It has 3 distinct sections that provide either useful information or allow you to pick or create a Synthetic Test.
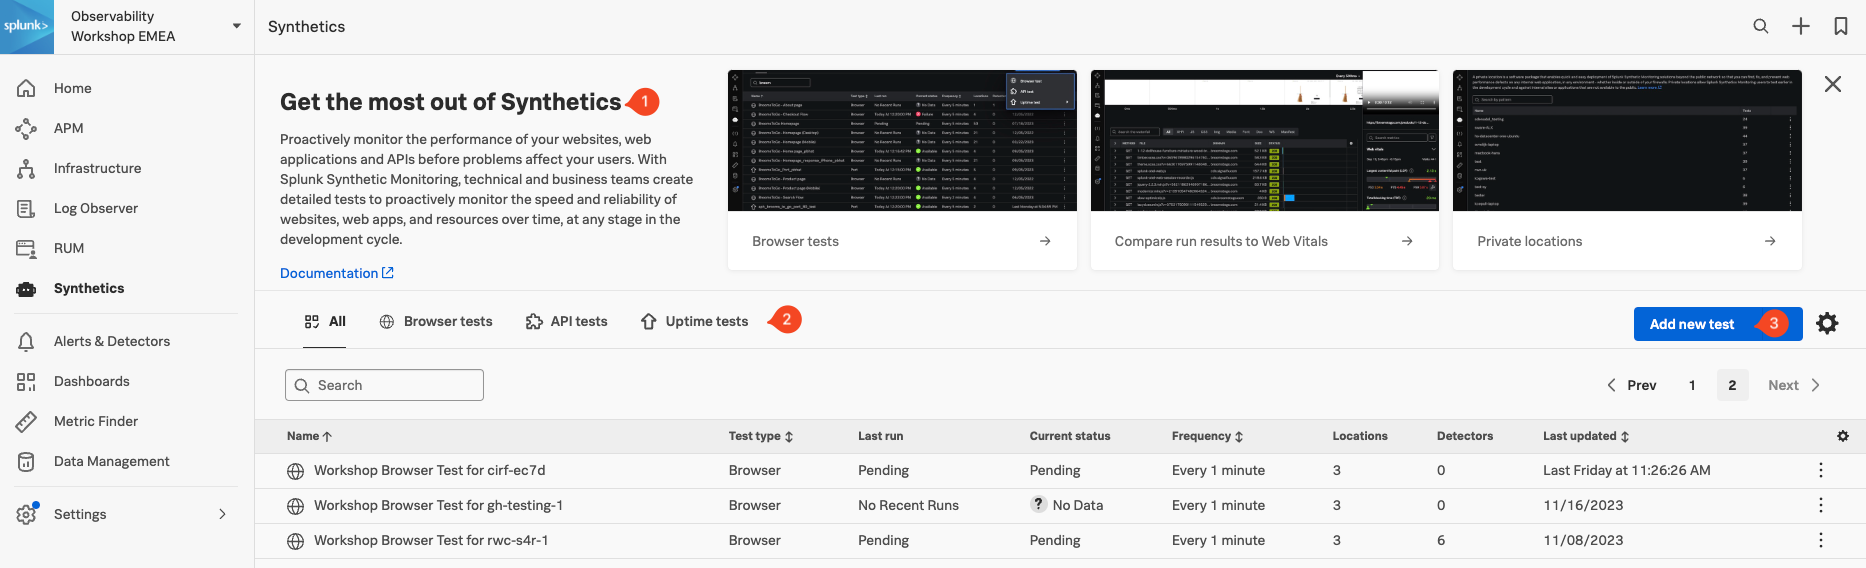
- Onboarding Pane: Training videos and links to documentation to get you started with Splunk Synthetics.
- Test Pane: List of all the tests that are configured (Browser, API and Uptime)
- Create Test Pane: Drop-down for creating new Synthetic tests.
As part of the workshop we have created a default browser test against the application we are running. You find it in the Test Pane (2). It will have the following name Workshop Browser Test for, followed by the name of your Workshop (your instructor should have provided that to you).
Info
Exercise
- In the Test Pane, click on the line that contains the name of your workshop. The result should look like this:
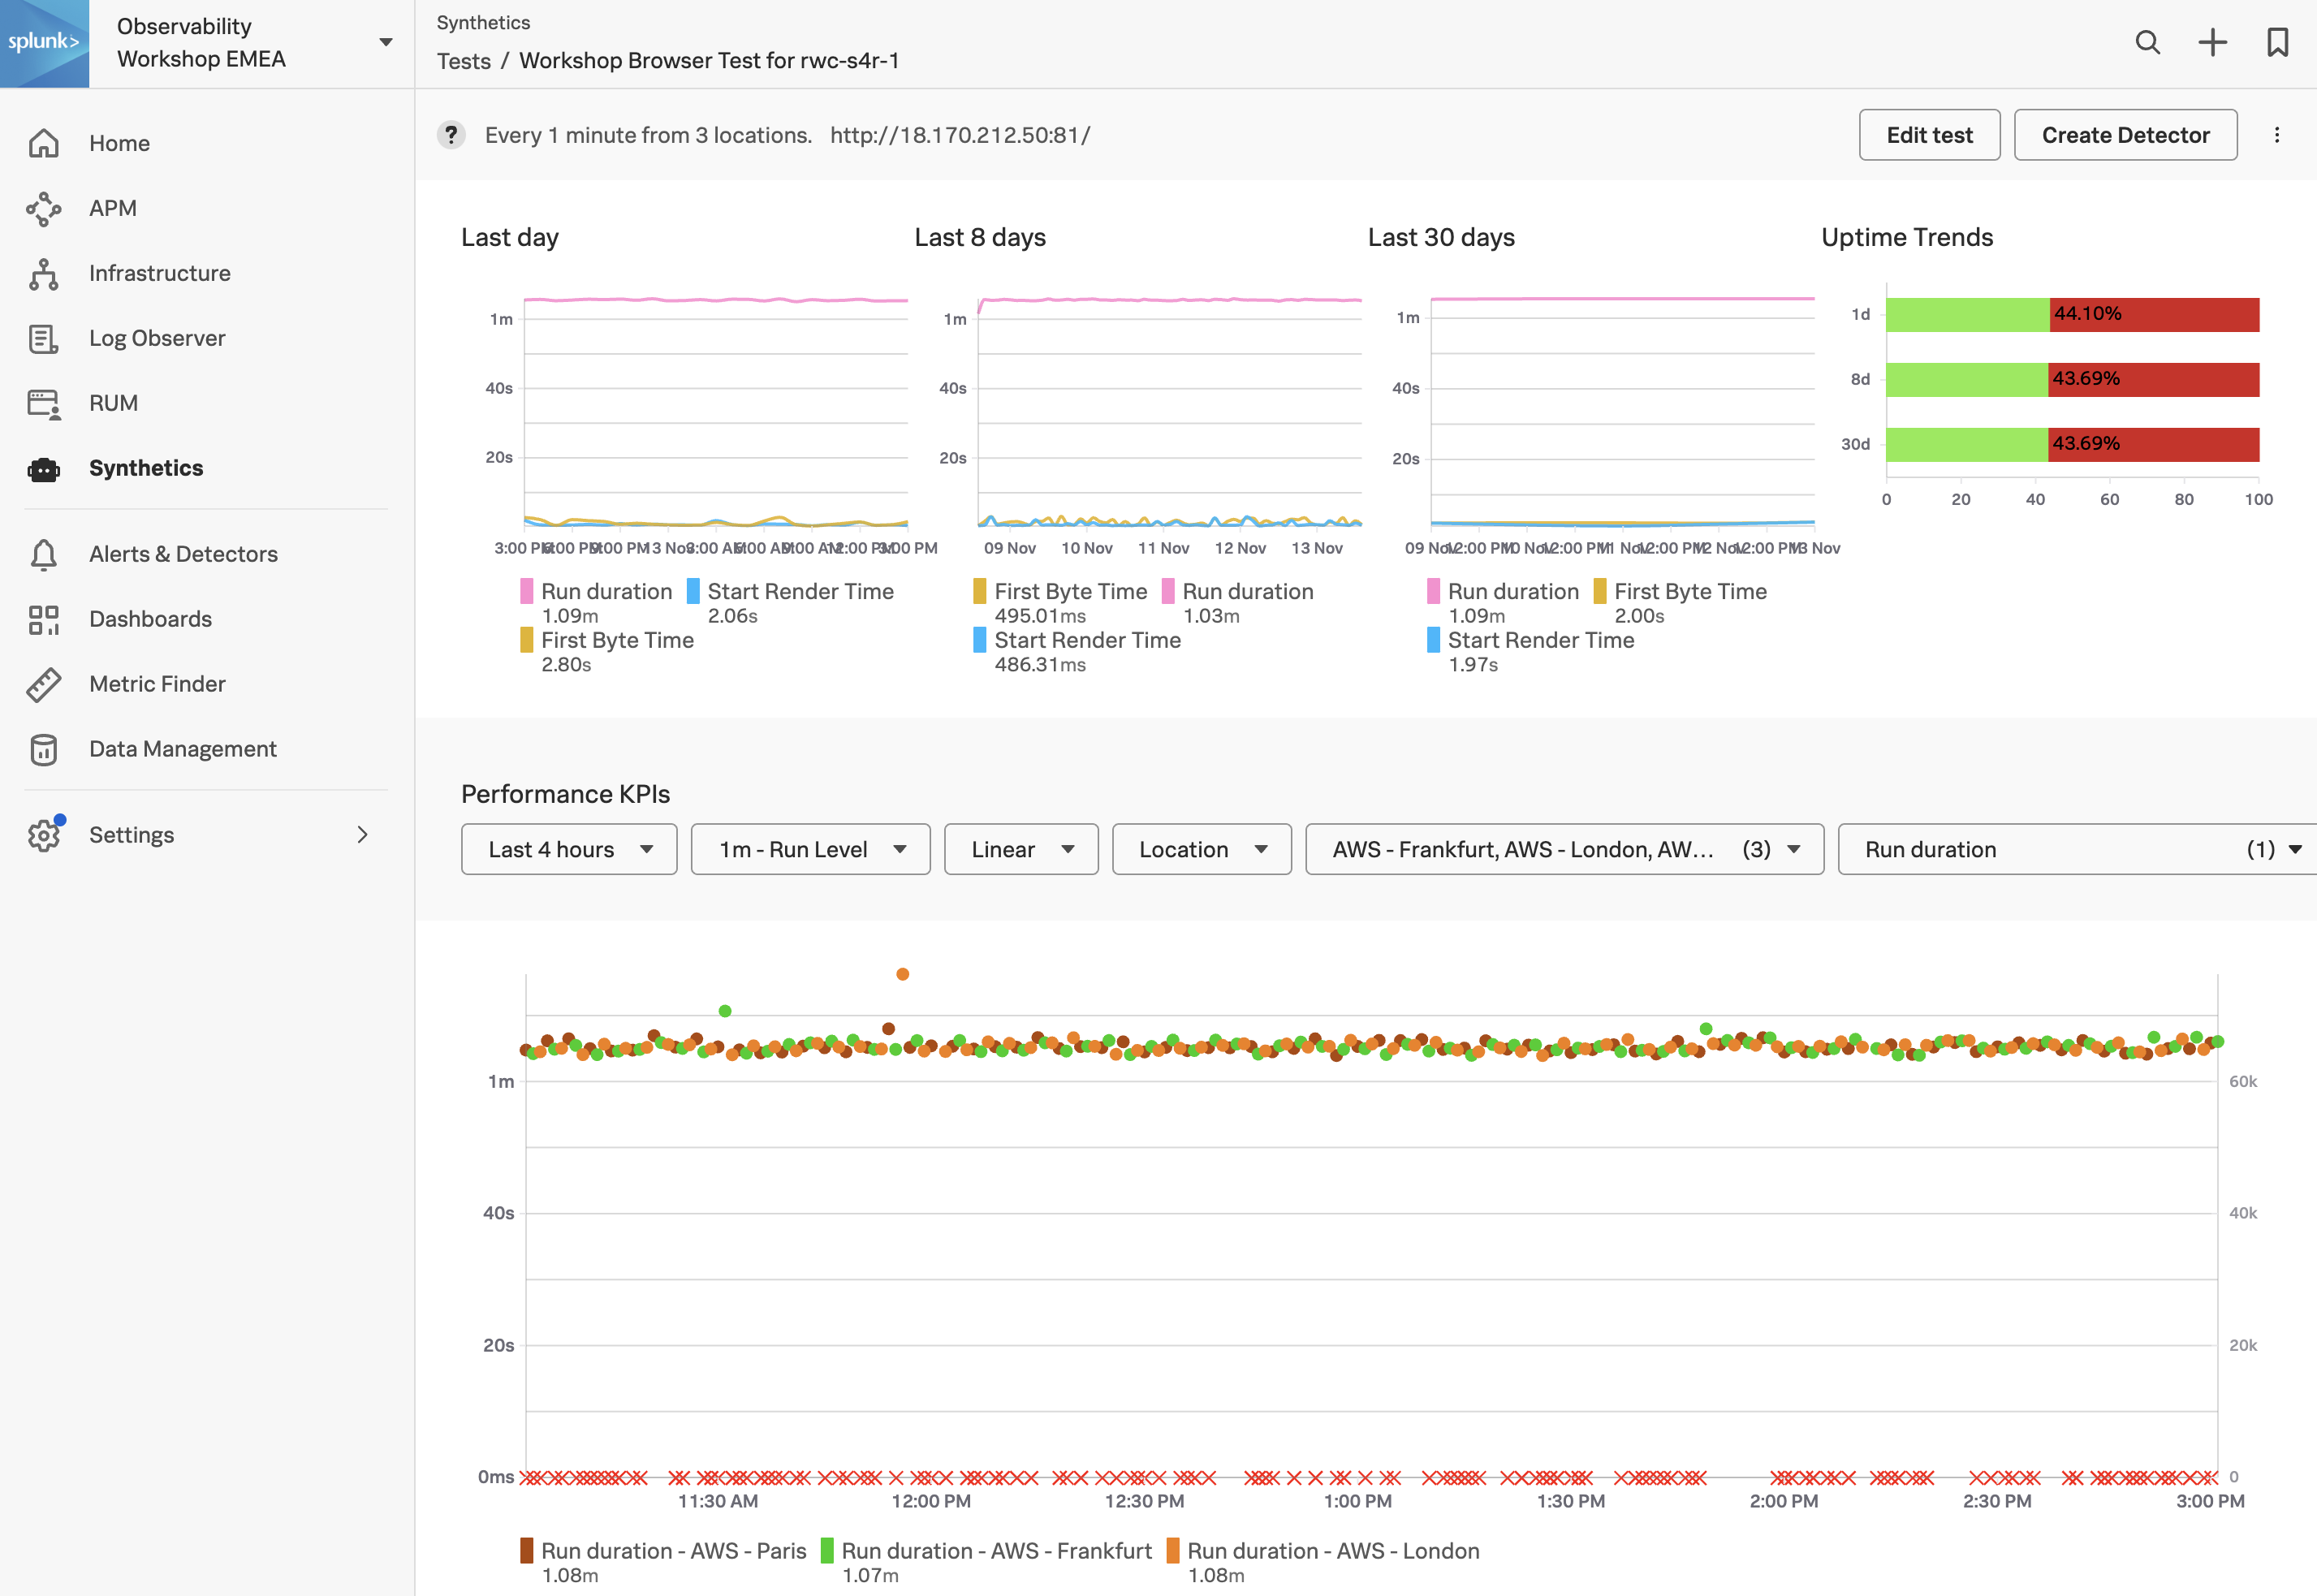
- Note, On the Synthetic Tests Page, the first pane will show the performance of your site for the last day, 8 days and 30 days. As shown in the screenshot above, only if a test started far enough in the past, the corresponding chart will contain valid data. For the workshop, this depends on when it was created.
- In the Performance KPI drop-down, change the time from the default 4 hours to the 1 last hour.
How often is the test run, and from where?
The test runs at a 1-minute round-robin interval from Frankfurt, London and Paris
Next, let’s examine the infrastructure our application is running on using Splunk Infrastructure Monitoring (IM).