Infrastructure Navigators
Click on Infrastructure in the main menu, the Infrastructure Home Page is made up of 4 distinct sections.
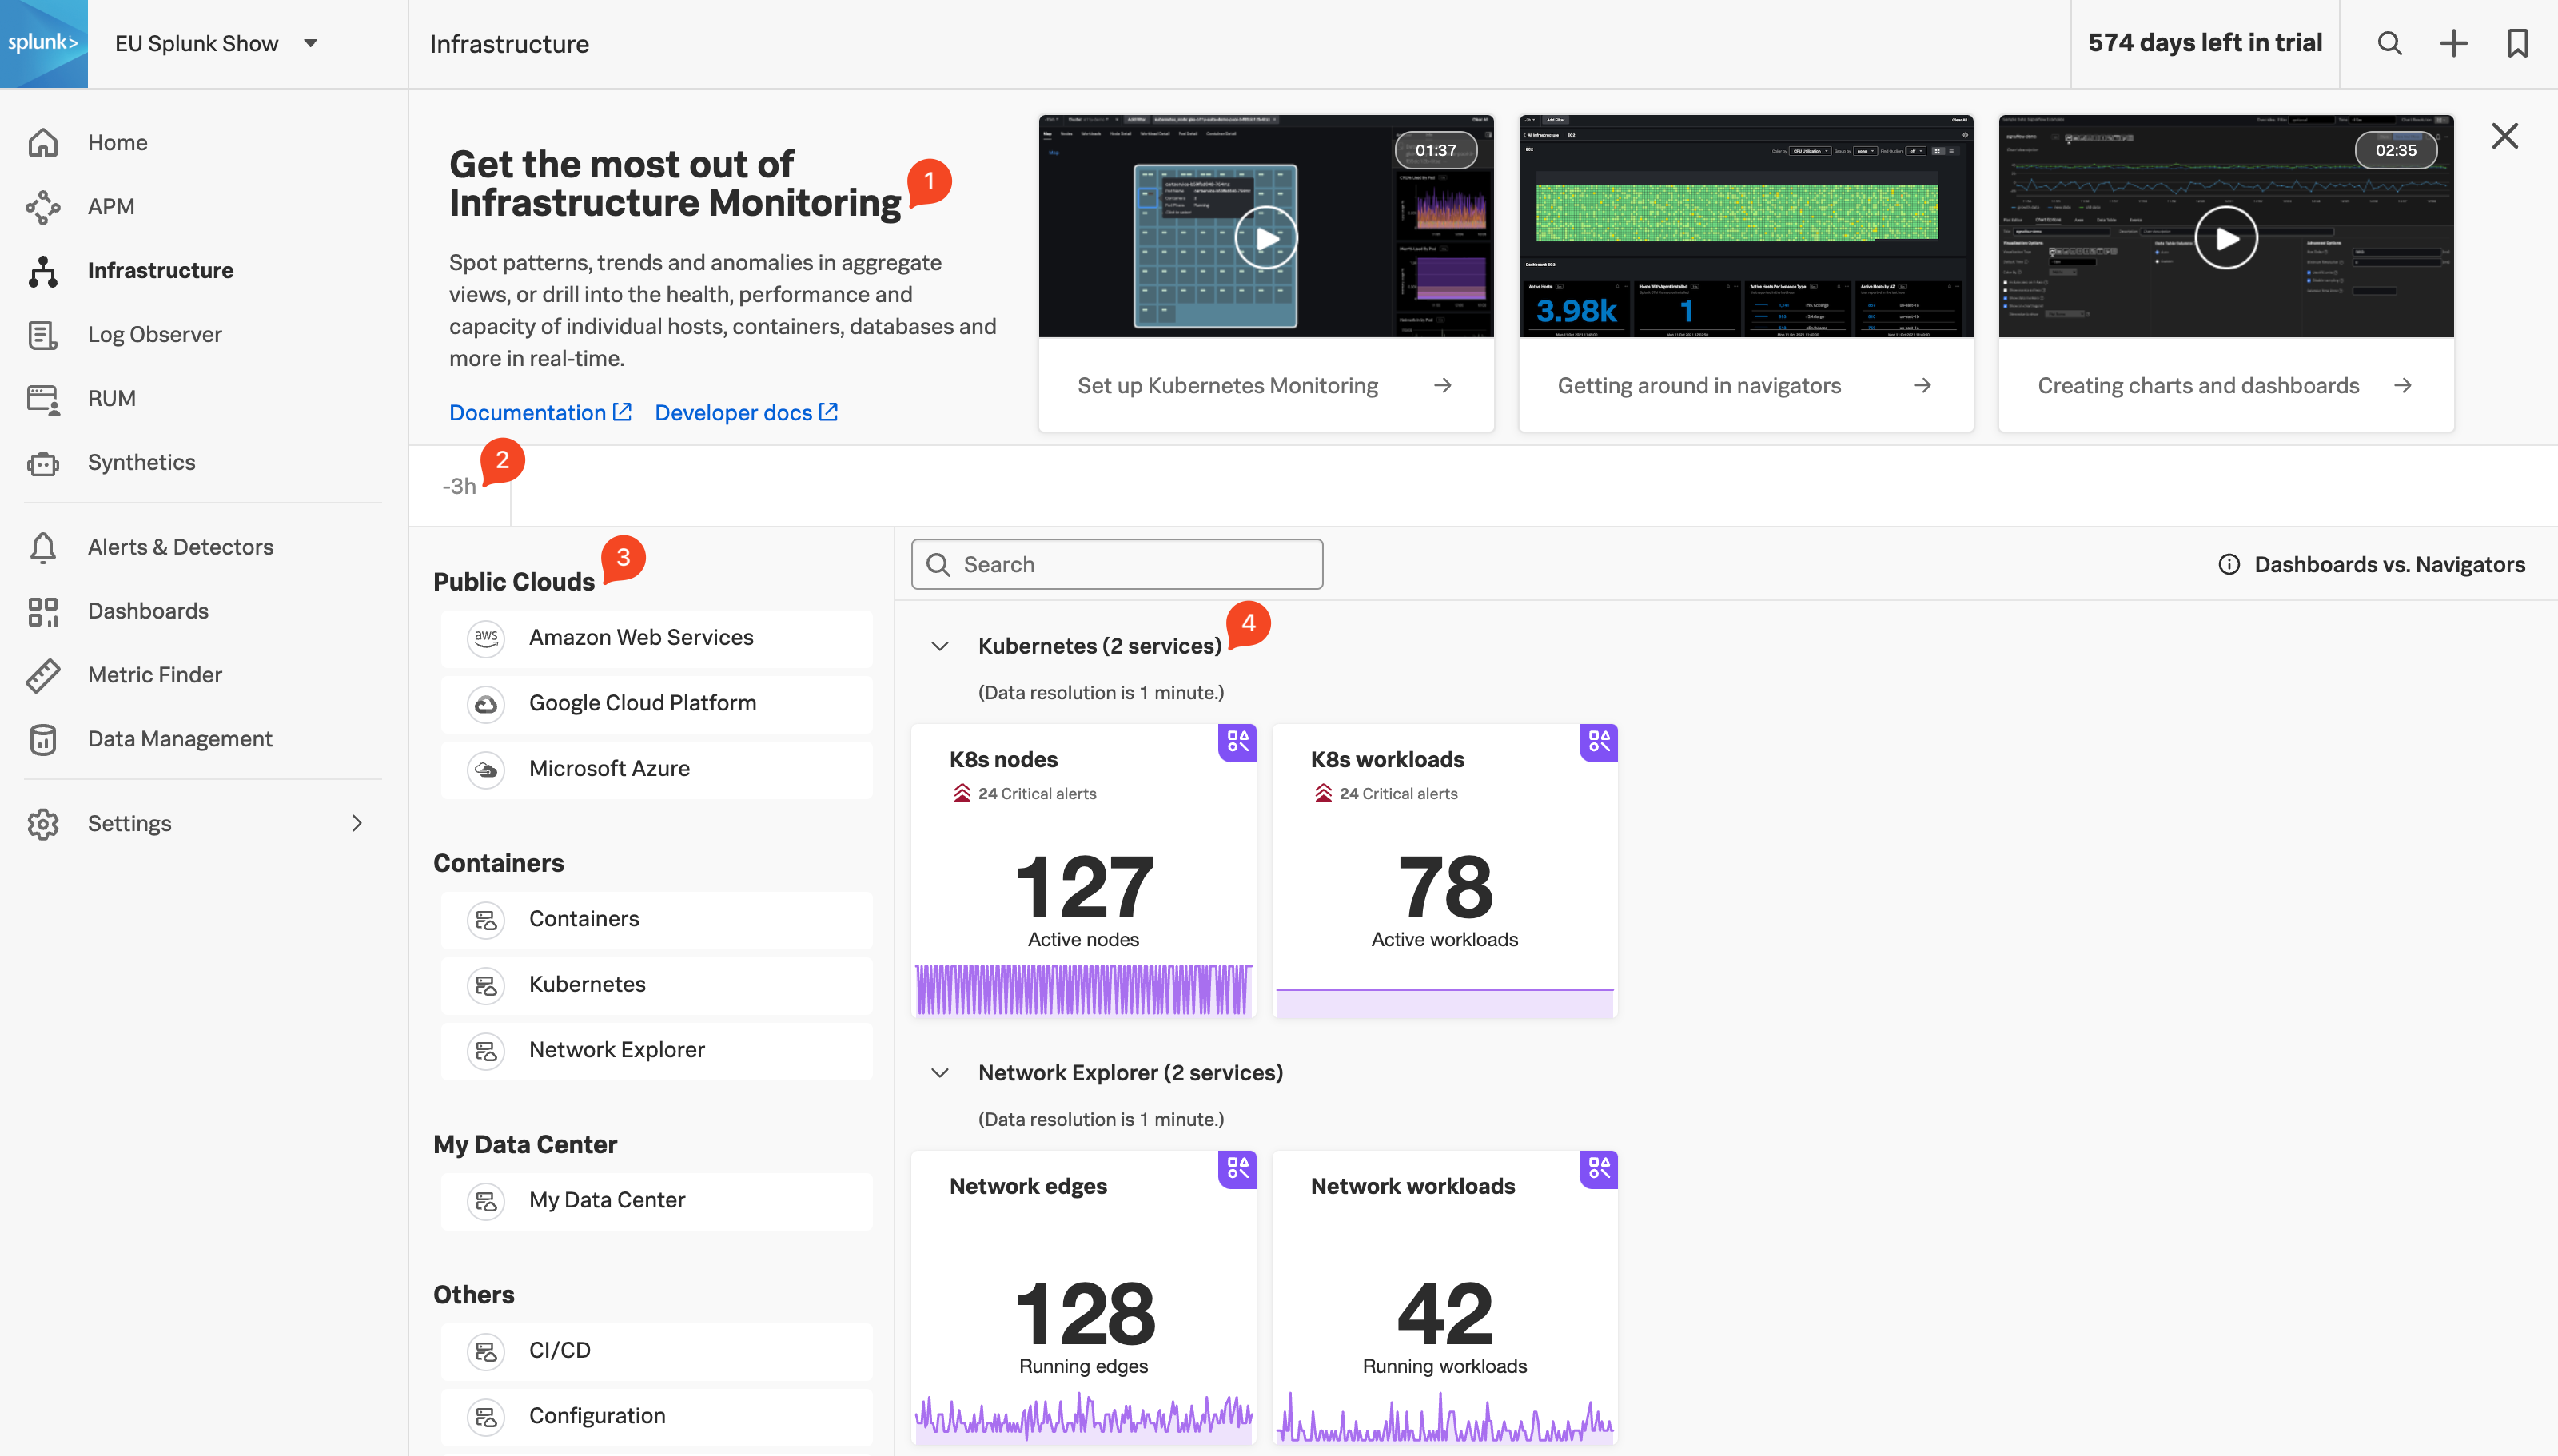
- Onboarding Pane: Training videos and links to documentation to get you started with Splunk Infrastructure Monitoring.
- Time & Filter Pane: Time window (not configurable at the top level)
- Integrations Pane: List of all the technologies that are sending metrics to Splunk Observability Cloud.
- Tile Pane: Total number of services being monitored broken down by integration.
Using the Infrastructure pane, we can select the infrastructure/technology we are interested in, let’s do that now.
Under the Containers section in the Integrations Pane (3), select Kubernetes as the technology you wish to examine.
This should show you two tiles, K8s Nodes and K8s Workloads.
The bottom part of each tile will have a history graph and the top part will show notifications for alerts that fired. Across all tiles, this additional information on each of the tiles will give you a good overview of the health of your infrastructure.
Click on the K8s Nodes tile.
You will be presented with one or more representations of a Kubernetes Cluster.
Click on the Add filters button. Type in
k8s.cluster.nameand click on the search result.From the list, select [NAME OF WORKSHOP]-k3s-cluster then click on the Apply Filter button.
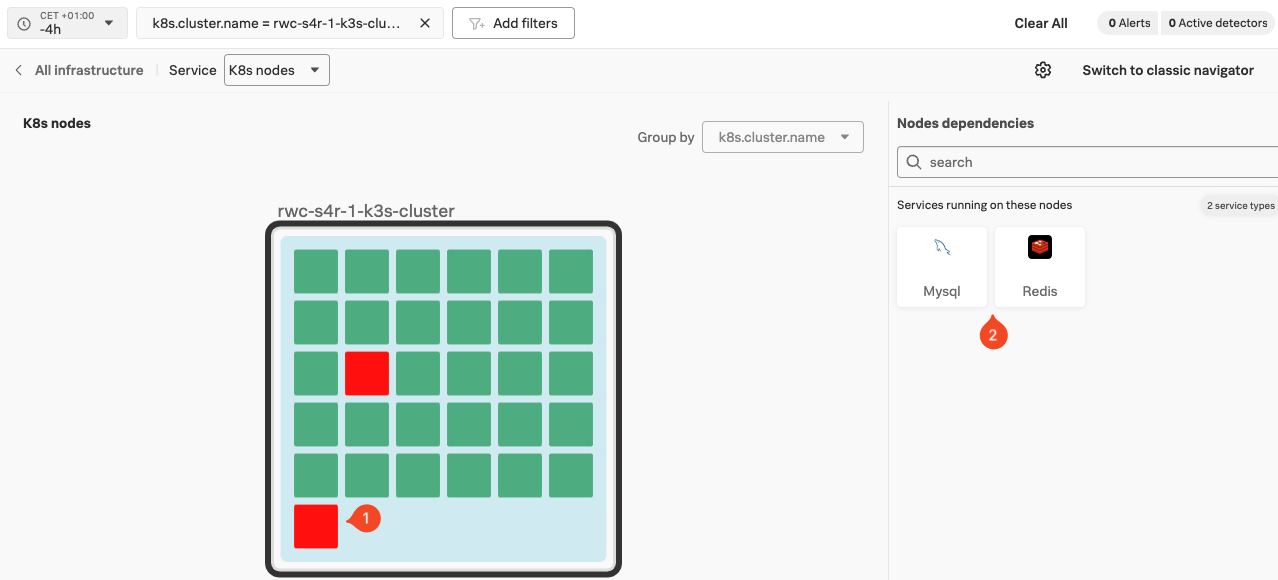
The Kubernetes Navigator uses color to indicate health. As you can see there are two pods or services that are unhealthy and in a Failed state (1). The rest are healthy and running. This is not uncommon in shared Kubernetes environments, so we replicated that for the workshop.
Note the tiles to the side, under Nodes dependencies (2), specifically the MySQL and Redis tiles. These are the two databases used by our e-commerce application.
The UI will show services that are running on the node you have selected if they have been configured to be monitored by the OpenTelemetry Collector.
- Click on the Redis tile and this will take you to the Redis instances navigator. Under REDIS INSTANCE click on redis-[NAME OF WORKSHOP].
- This will bring you to the Redis instance. This navigator will show charts with metric data from the active Redis instance from our e-commerce site.
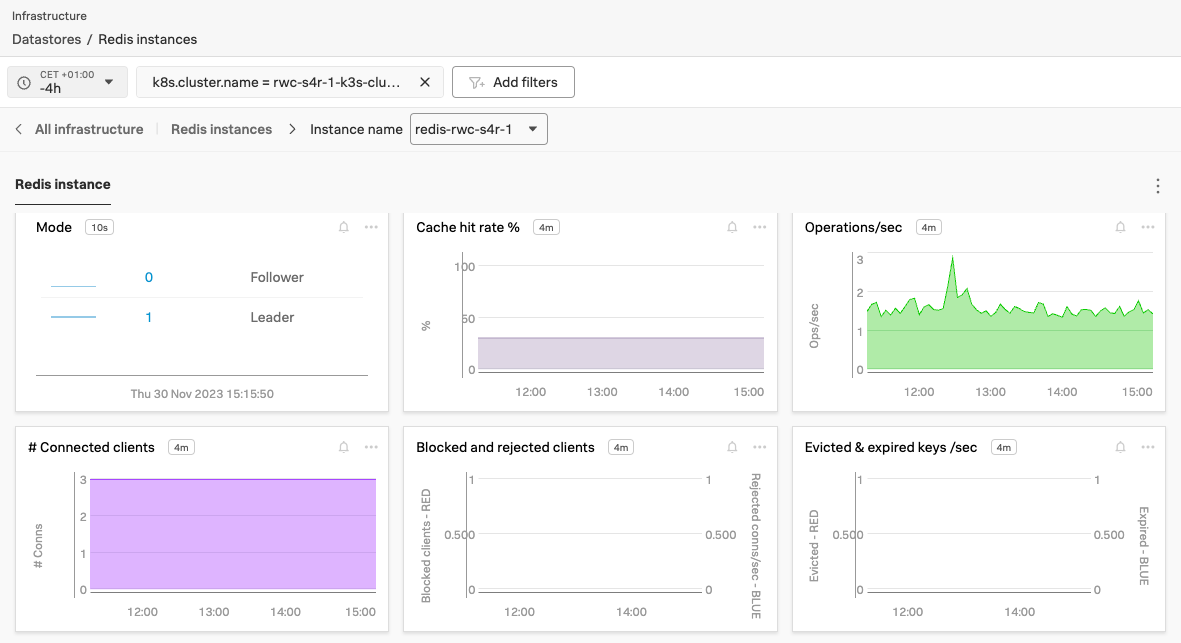
Can you name the Instance dependencies tile in this view?
Yes, there is one for Kubernetes.
- Click the tile, it will bring us back into the Kubernetes Navigator, this time at the Pod level showing the Pod that runs the Redis Service.
- To return to the Cluster level, simply click on the link Cluster (1) at the top of the screen.

This completes the tour of Splunk Observability Cloud.
Here, have some virtual 💶 and let’s go and look at our e-commerce site, the ‘Online Boutique’ and do some shopping.