2. Tag Spotlight
Make sure you are on the Custom Events tab by selecting it.
Have a look at the Custom Event Latency chart. The metrics shown here show the application latency. The comparison metrics to the side show the latency compared to 1 hour ago (which is selected in the top filter bar).
Click on the see all link under the chart title.
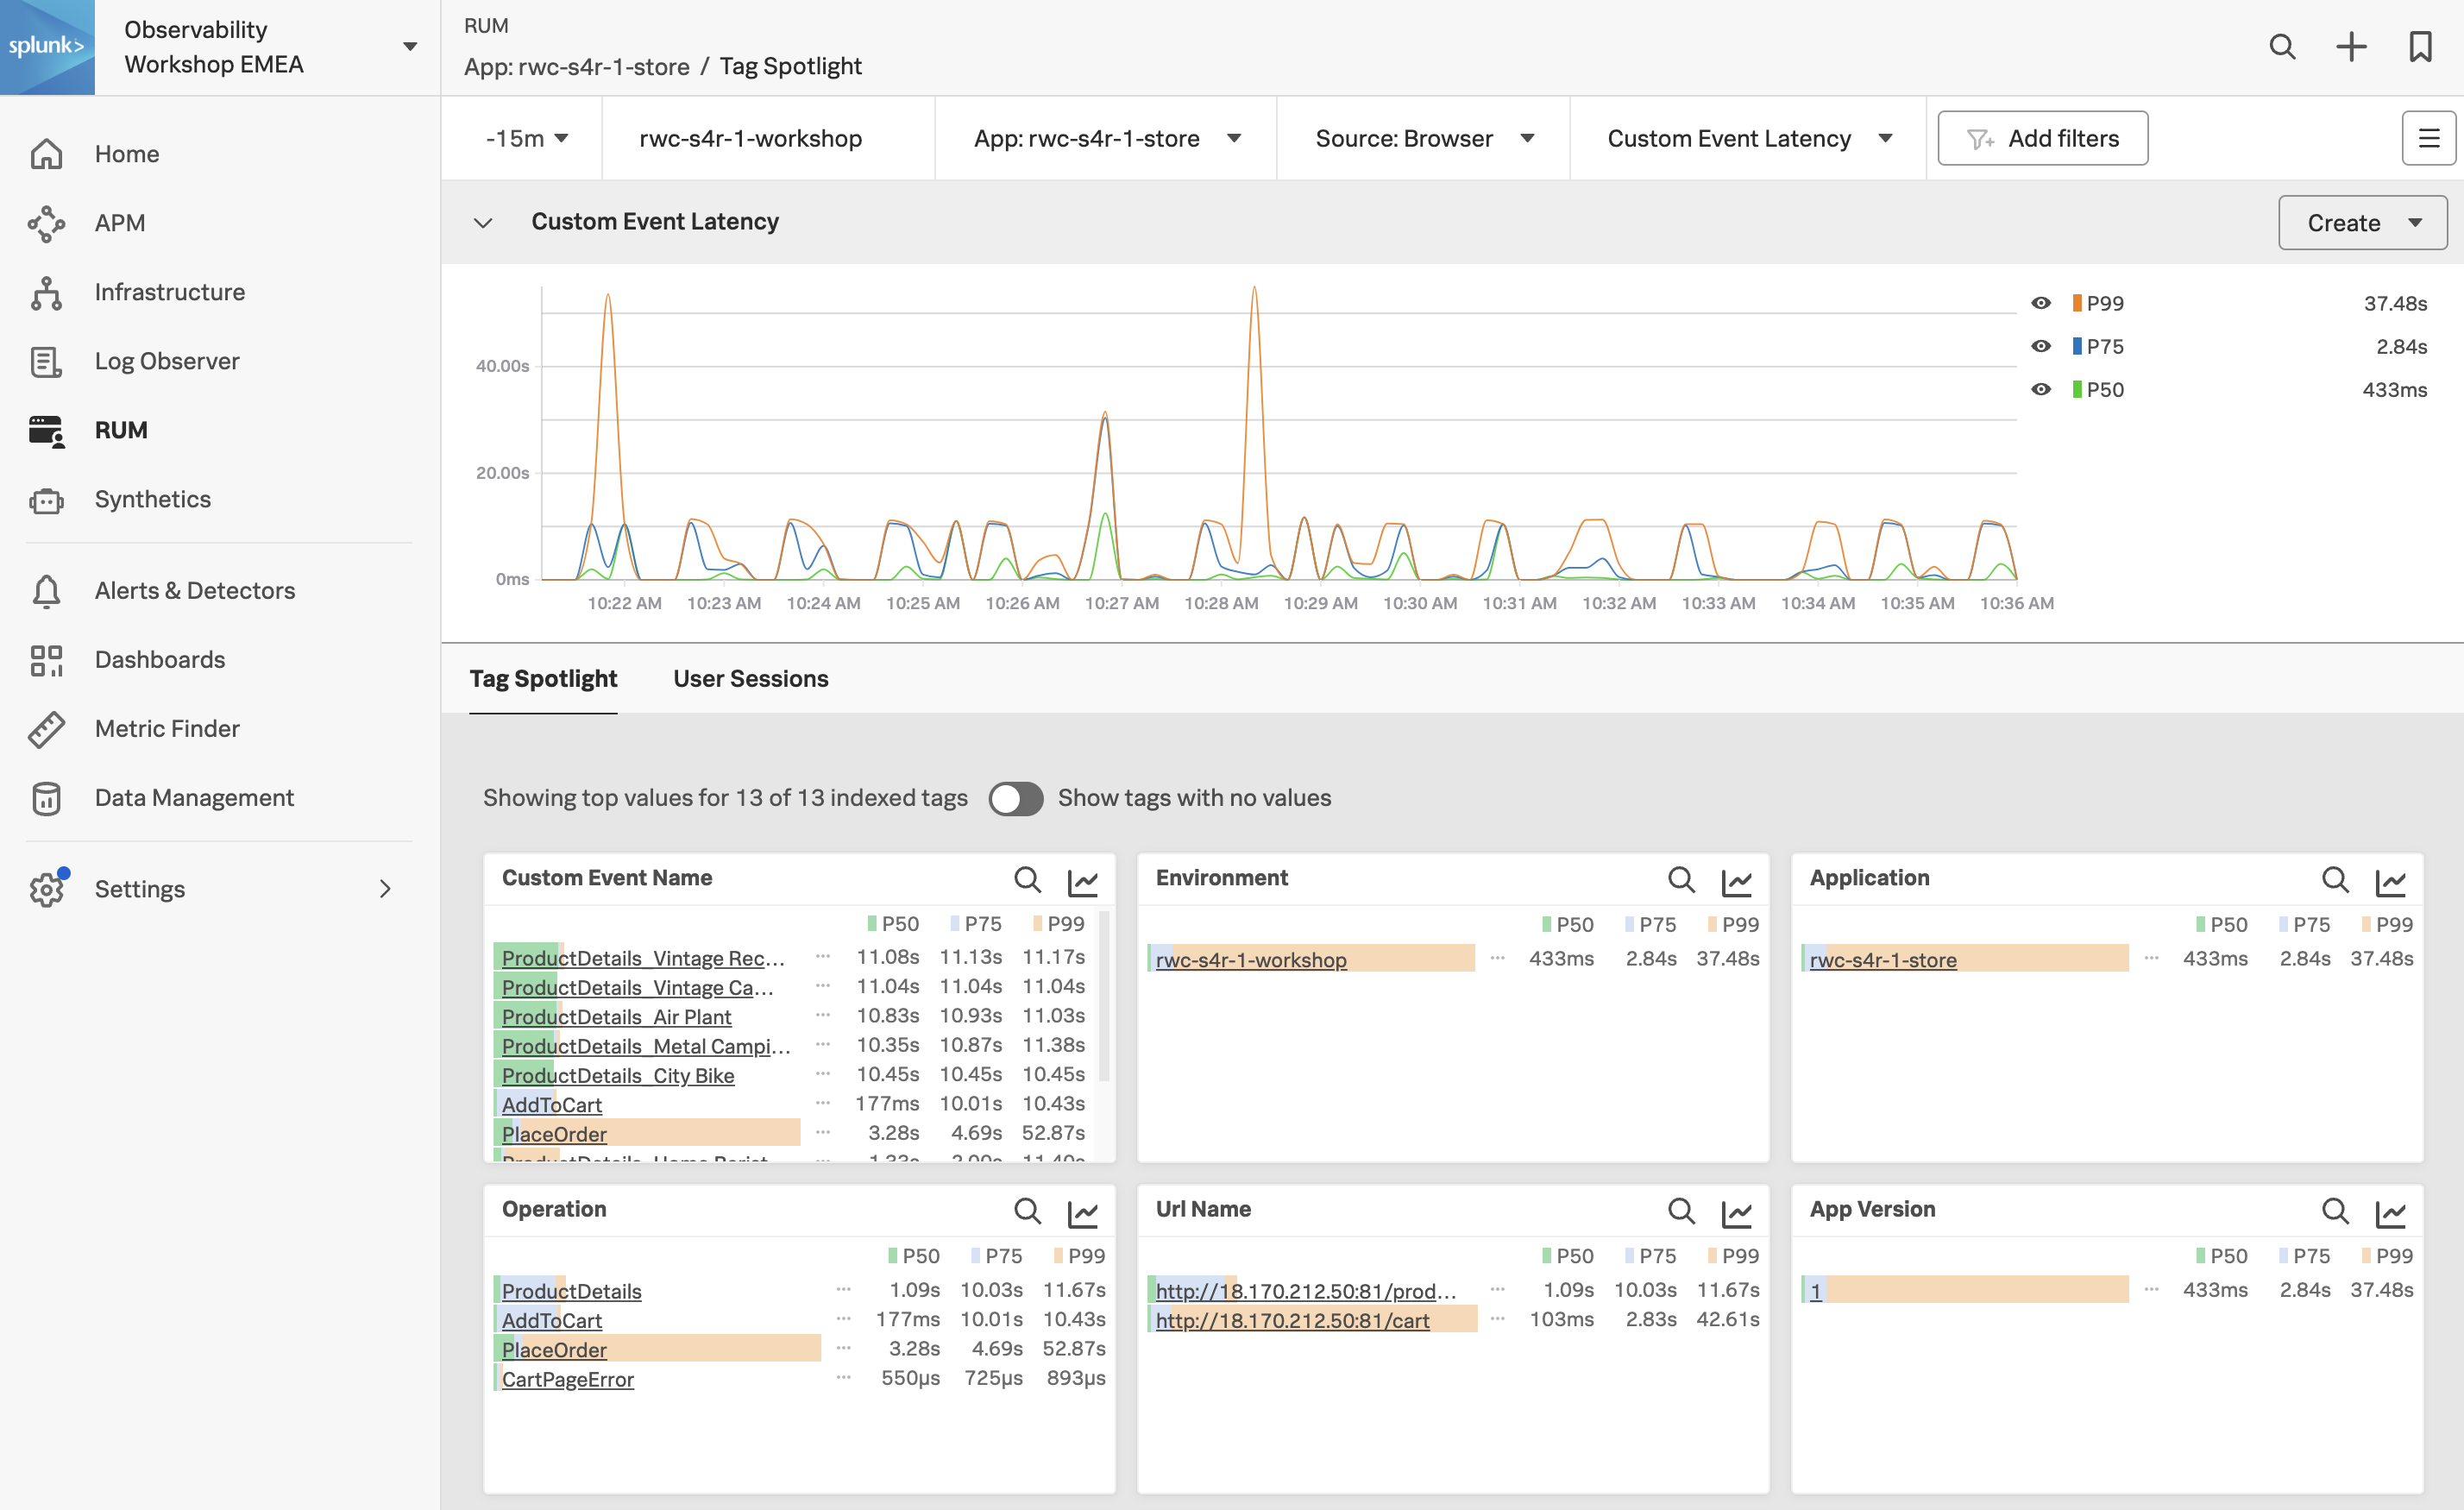
In this dashboard view, you are presented with all the tags associated with the RUM data. Tags are key-value pairs that are used to identify the data. In this case, the tags are automatically generated by the OpenTelemetry instrumentation. The tags are used to filter the data and to create the charts and tables. The Tag Spotlight view allows you to drill down into a user session.
- Change the timeframe to Last 1 hour.
- Click Add Filters, select OS Version, click != and select Synthetics and RUMLoadGen then click the Apply Filter button.
- Find the Custom Event Name chart, locate PlaceOrder in the list, click on it and select Add to filter.
- Notice the large spikes in the graph across the top.
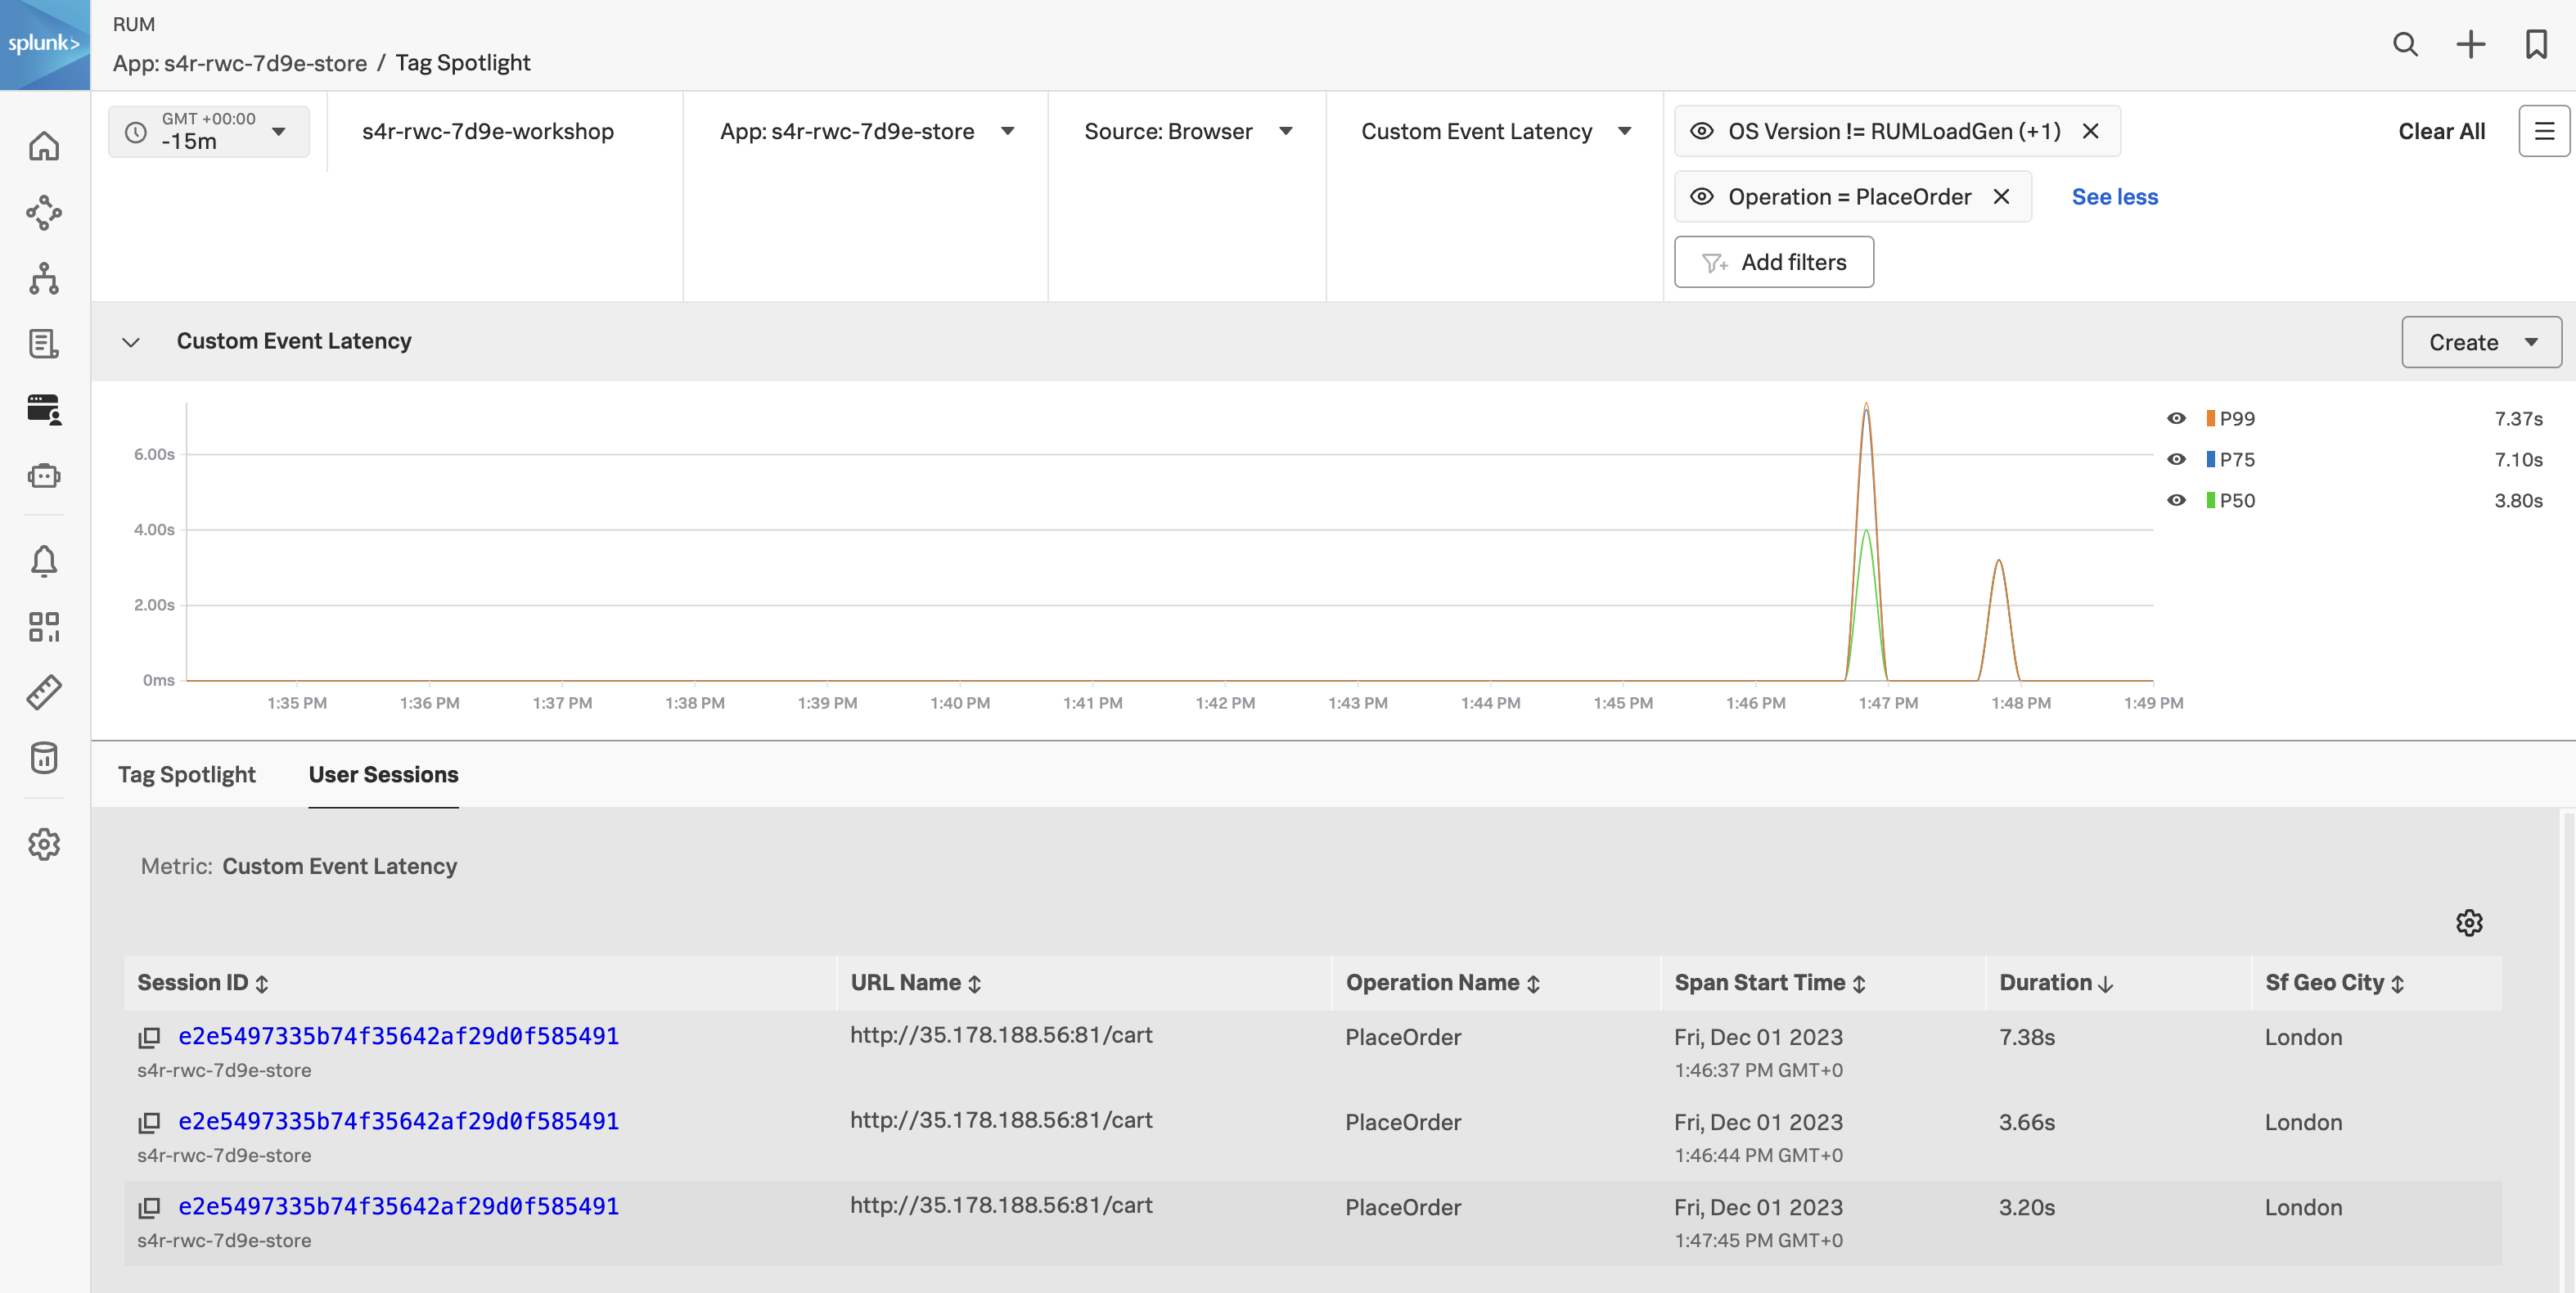
- Click on the User Sessions tab.
- Click on the Duration heading twice to sort the sessions by duration (longest at the top).
- Click on the above the table and select Sf Geo City from the list of additional columns and click Save
We now have a User Session table that is sorted by longest duration descending and includes the cities of all the users that have been shopping on the site. We could apply more filters to further narrow down the data e.g. OS version, browser version, etc.