1. APM Explore
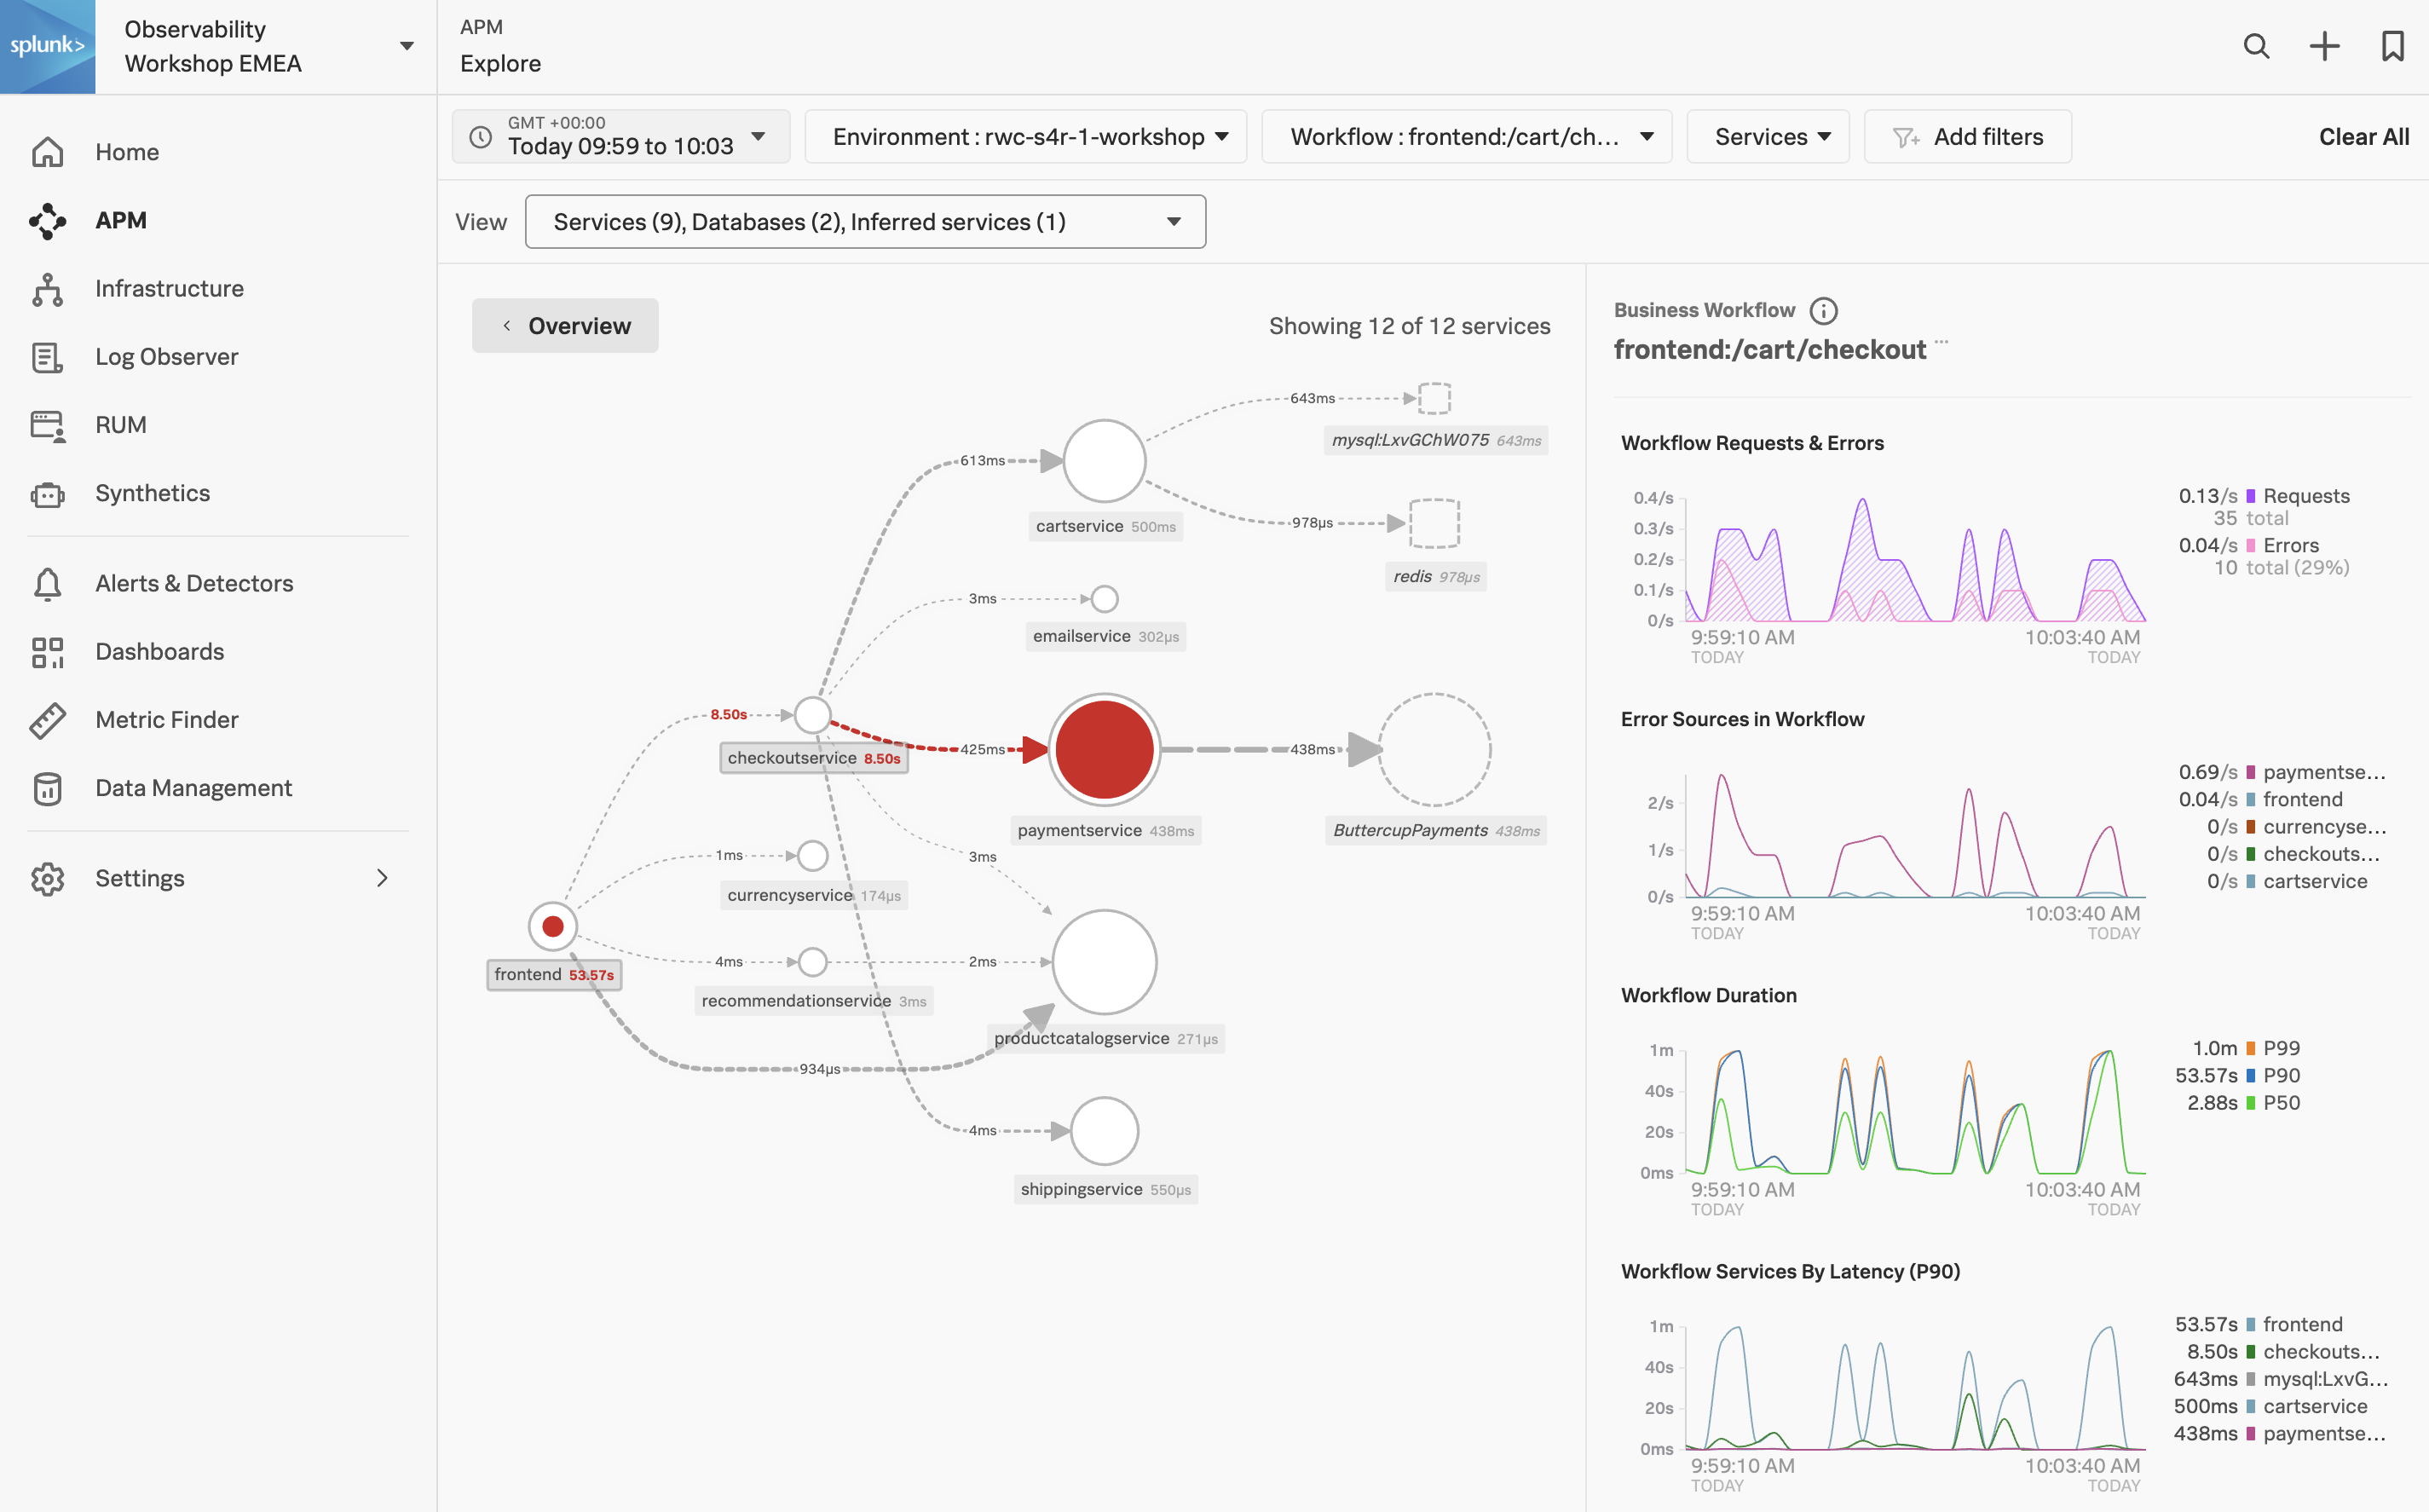
The APM Service Map displays the dependencies and connections among your instrumented and inferred services in APM. The map is dynamically generated based on your selections in the time range, environment, workflow, service, and tag filters.
When we clicked on the APM link in the RUM waterfall, filters were automatically added to the service map view to show the services that were involved in that WorkFlow Name (frontend:/cart/checkout).
You can see the services involved in the workflow in the Service Map. In the side pane, under Business Workflow, charts for the selected workflow are displayed. The Service Map and Business Workflow charts are synchronized. When you select a service in the Service Map, the charts in the Business Workflow pane are updated to show metrics for the selected service.
Exercise
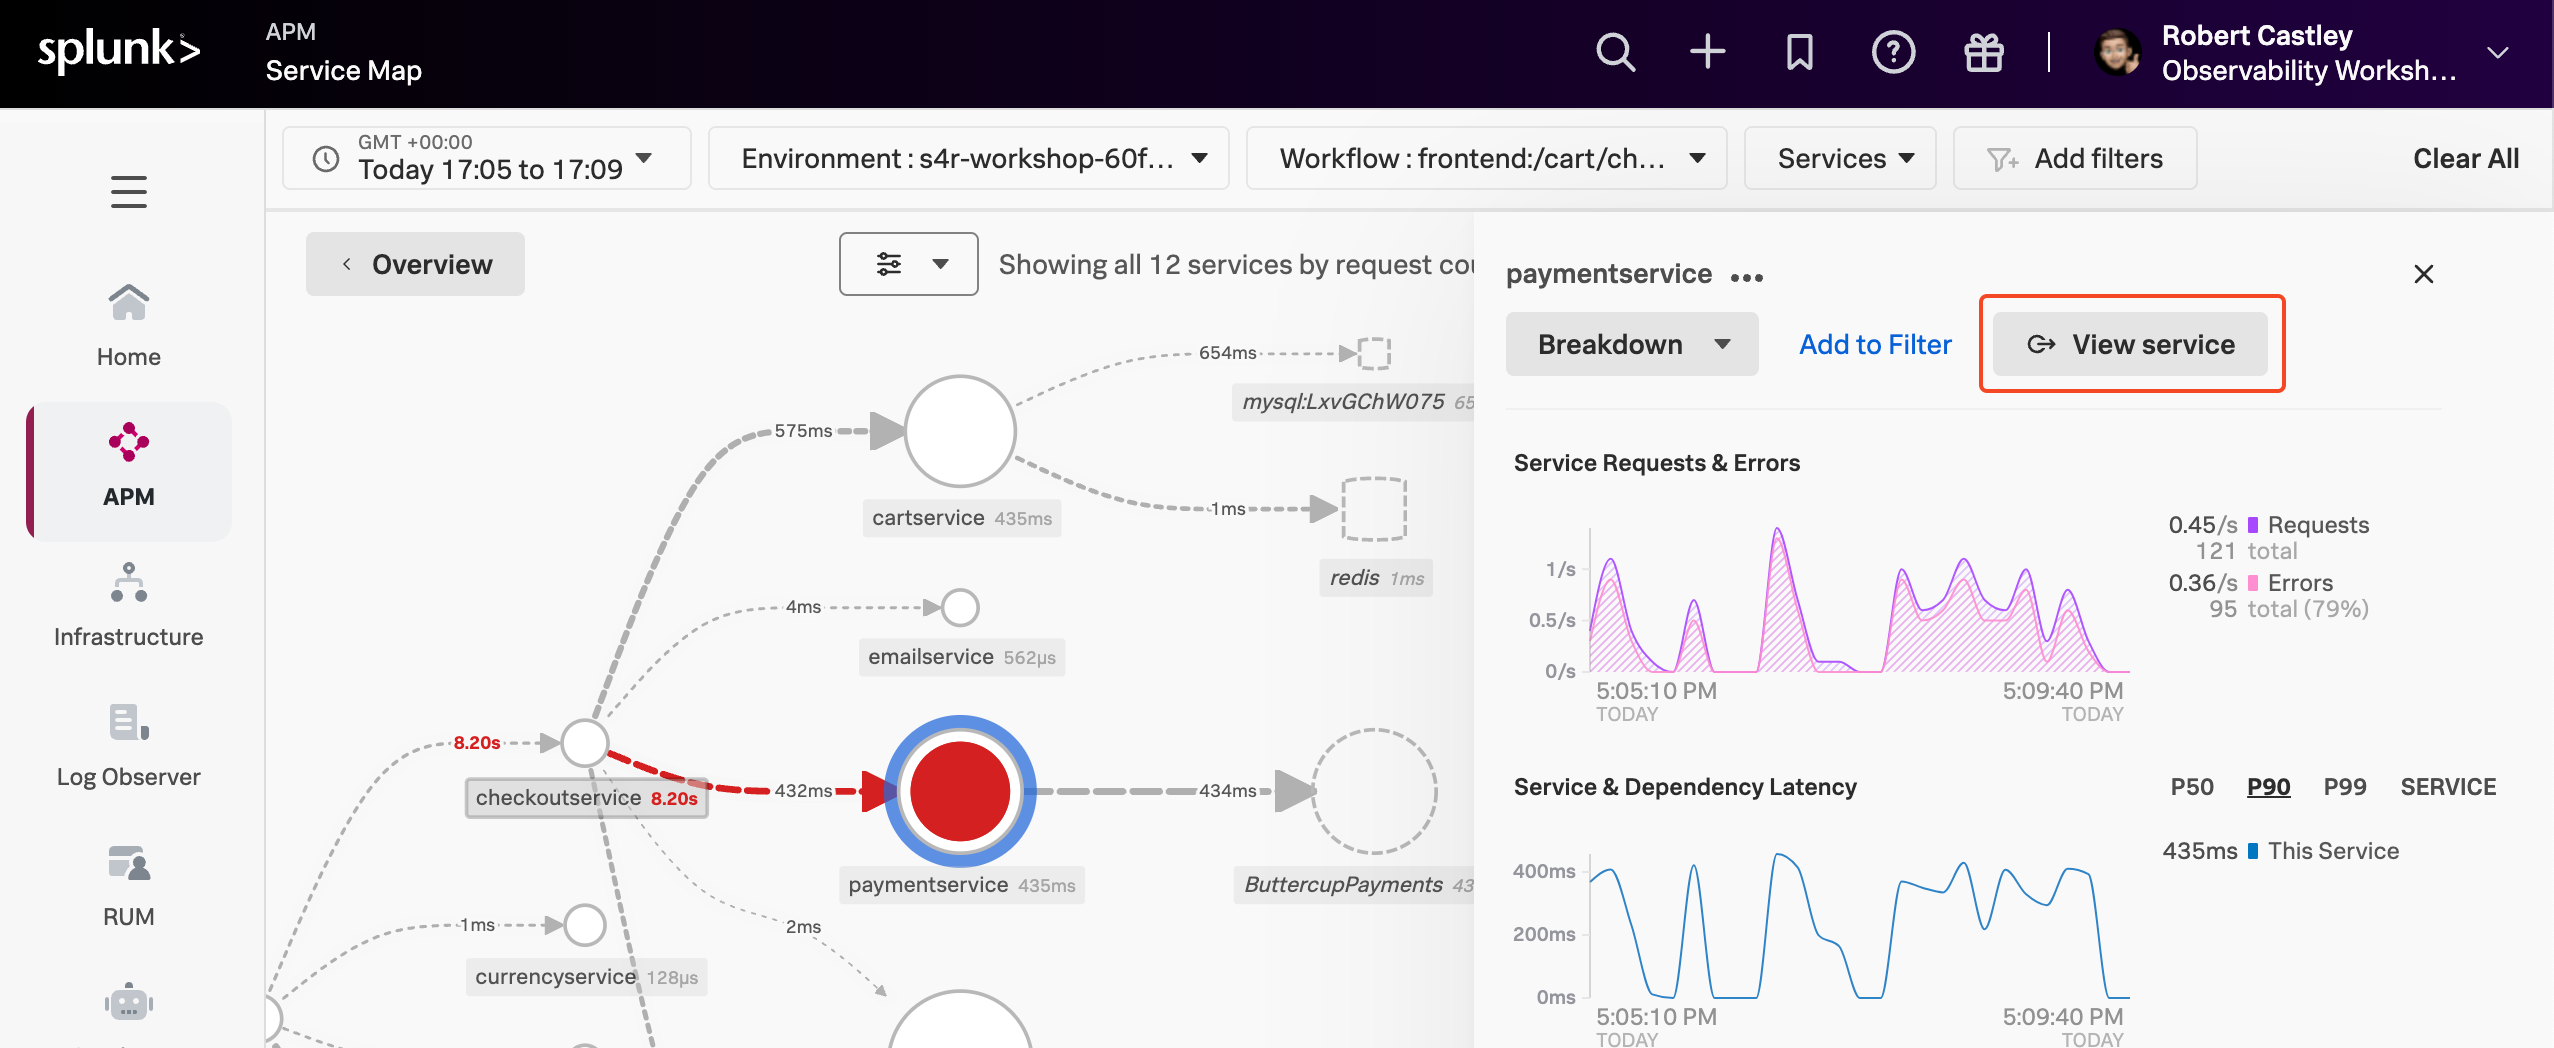
- Click on the paymentservice in the Service Map.
Splunk APM also provides built-in Service Centric Views to help you see problems occurring in real time and quickly determine whether the problem is associated with a service, a specific endpoint, or the underlying infrastructure. Let’s have a closer look.
Exercise
- In the right hand pane, click on paymentservice in blue.