3. APM Tag Spotlight
Exercise
- To view the tags for the paymentservice click on the paymentservice and then click on Tag Spotlight in the right-hand side functions pane (you may need to scroll down depending upon your screen resolution).
- Once in Tag Spotlight ensure the toggle Show tags with no values is off.
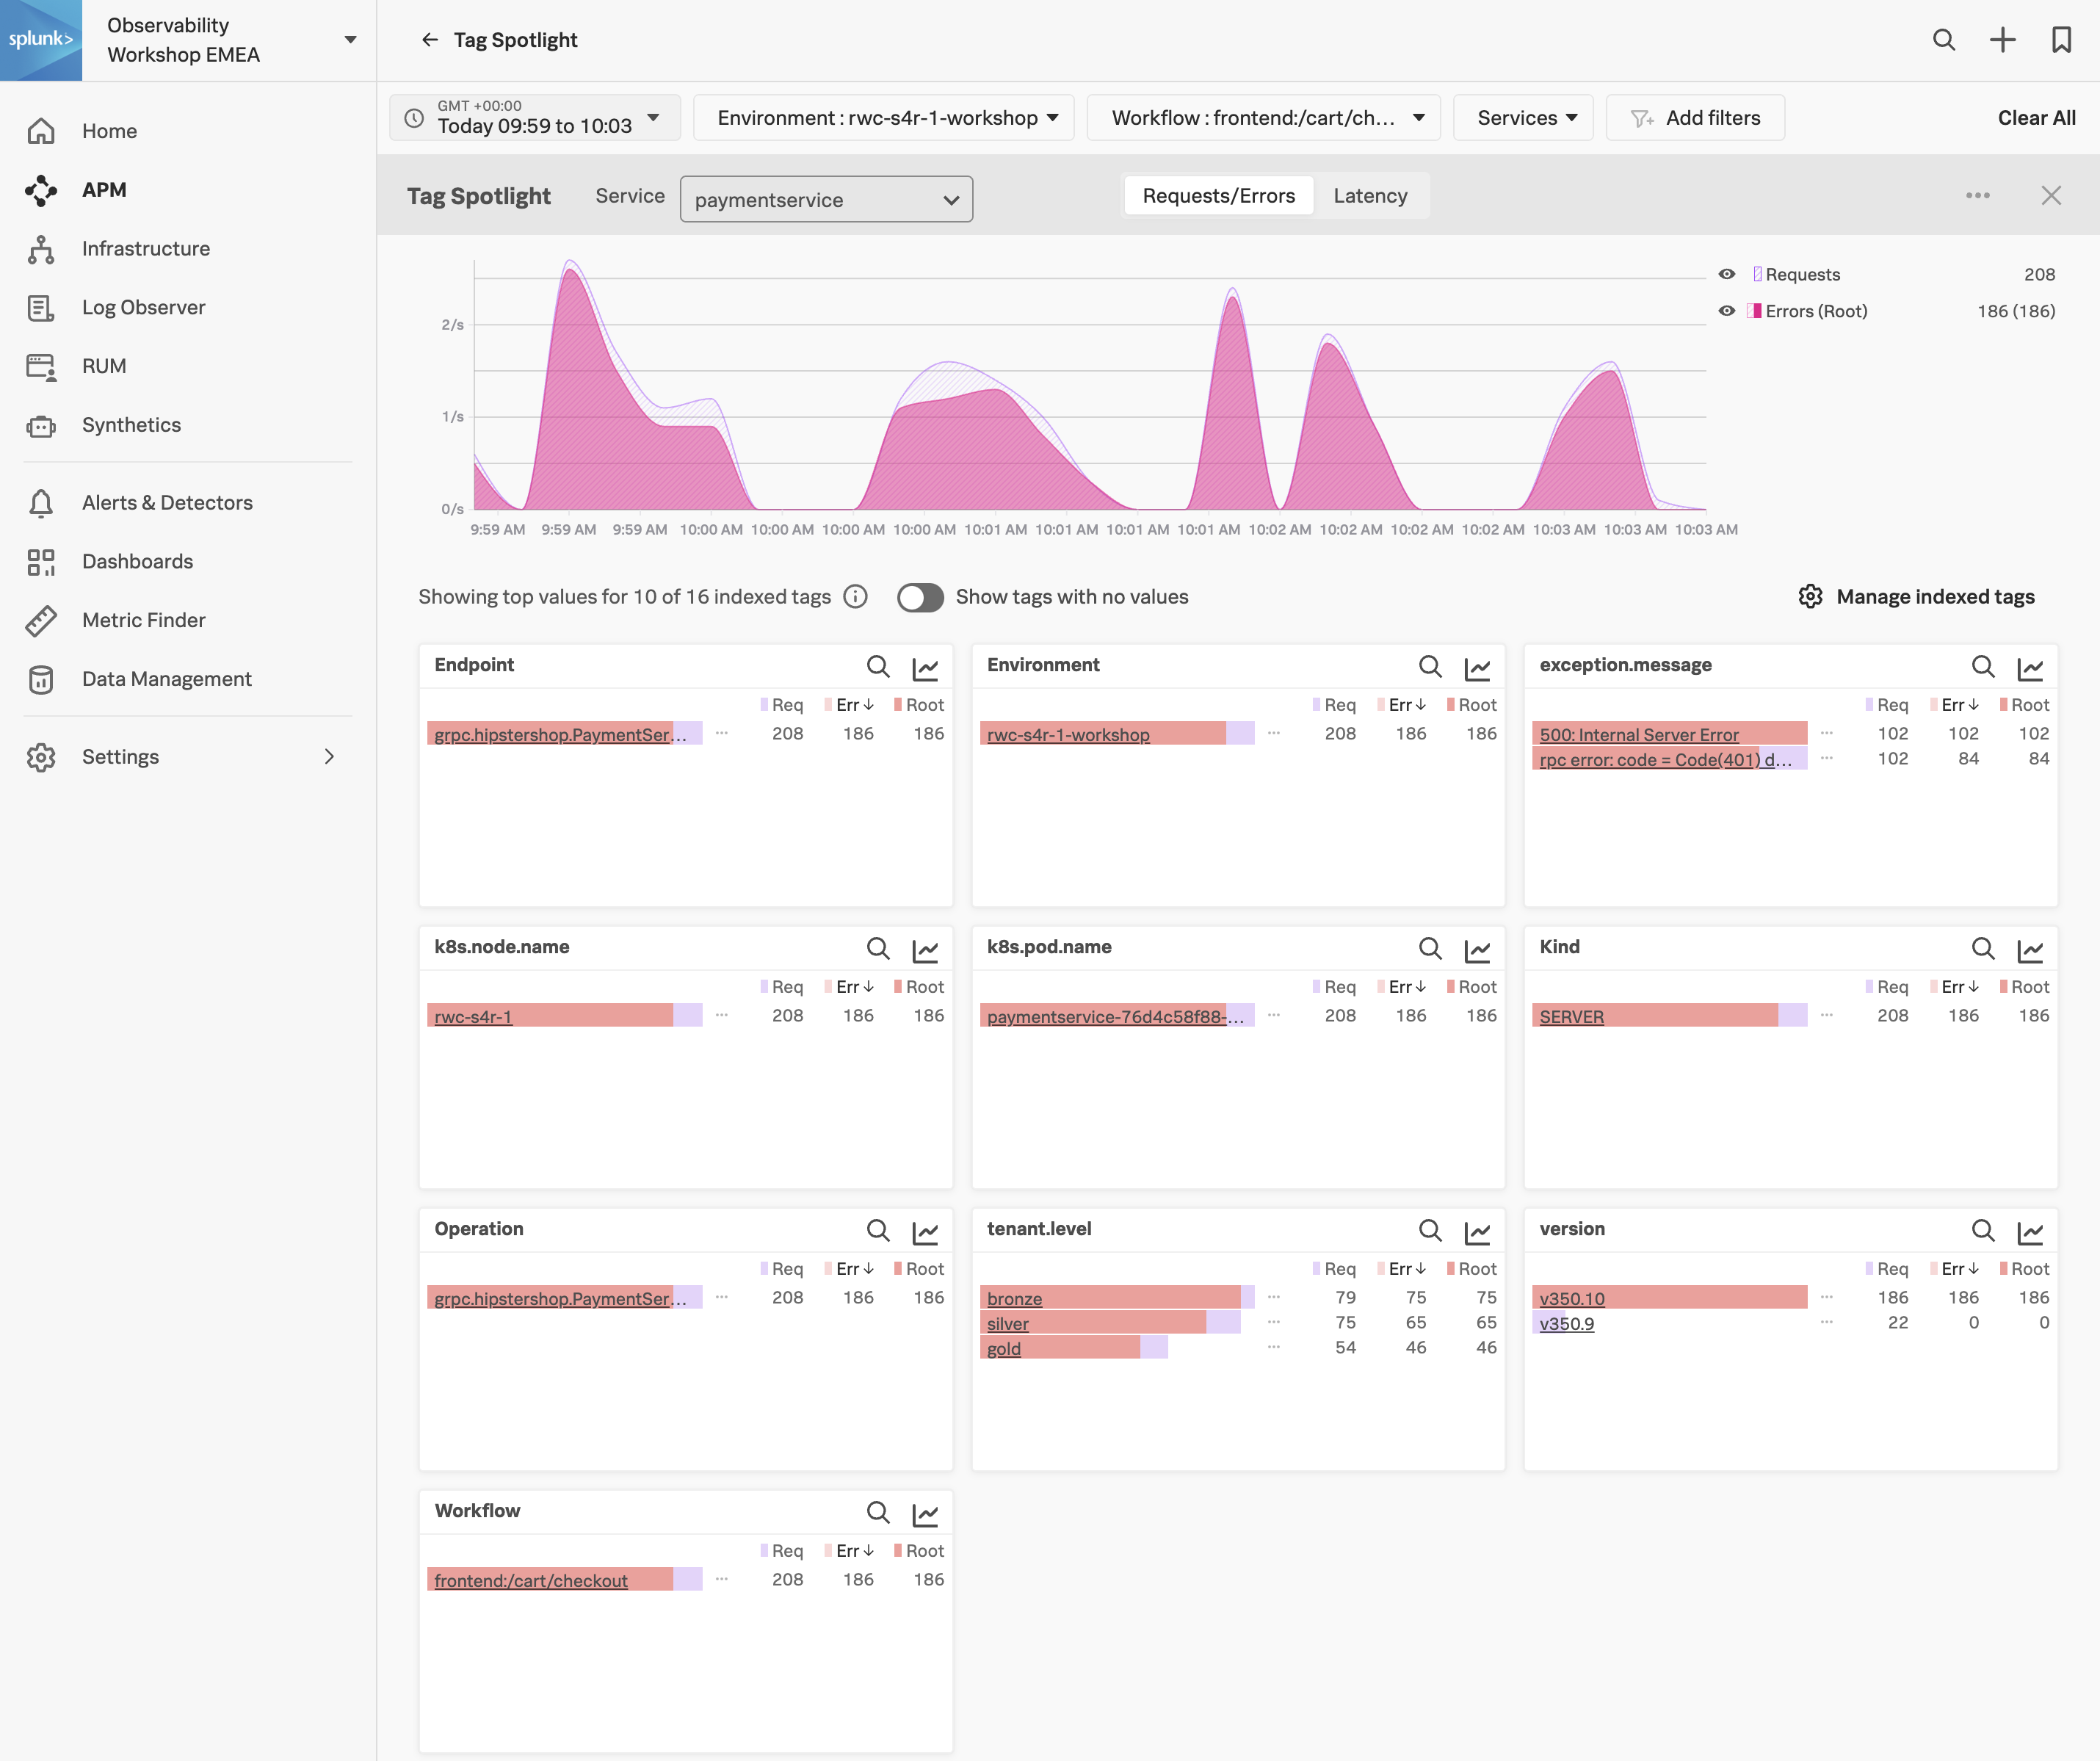
There are two views available in Tag Spotlight. The default is Request/Errors and the other is Latency.
Request/Error charts display the total number of requests, errors, and root cause errors. The Latency charts display p50, p90, and p99 latency. These values are based on Troubleshooting MetricSets (TMS), which Splunk APM generates for every indexed span tag. These are known as RED metrics (request, error, and duration).
Exercise
Which chart exposes the tag that identifies what the problem is?
The version chart. The number of requests against v350.10 matches the number of errors.
- Now that we have identified the version of the paymentservice that is causing the issue, let’s see if we can find out more information about the error. Click on ← Tag Spotlight at the top of the page to get back to the Service Map.