5. APM Trace Analyzer
As Splunk APM provides a NoSample™ end-to-end visibility of every service Splunk APM captures every trace. For this workshop, the Order Confirmation ID is available as a tag. This means that we can use this to search for the exact trace of the poor user experience you encountered earlier in the workshop.
Splunk Observability Cloud provides several tools for exploring application monitoring data. Trace Analyzer is suited to scenarios where you have high-cardinality, high-granularity searches and explorations to research unknown or new issues.
- With the outer box of the paymentservice selected, in the right-hand pane, click on Traces.
- To ensure we are using Trace Analyzer make sure the button Switch to Classic View is showing. If it is not, click on Switch to Trace Analyzer.
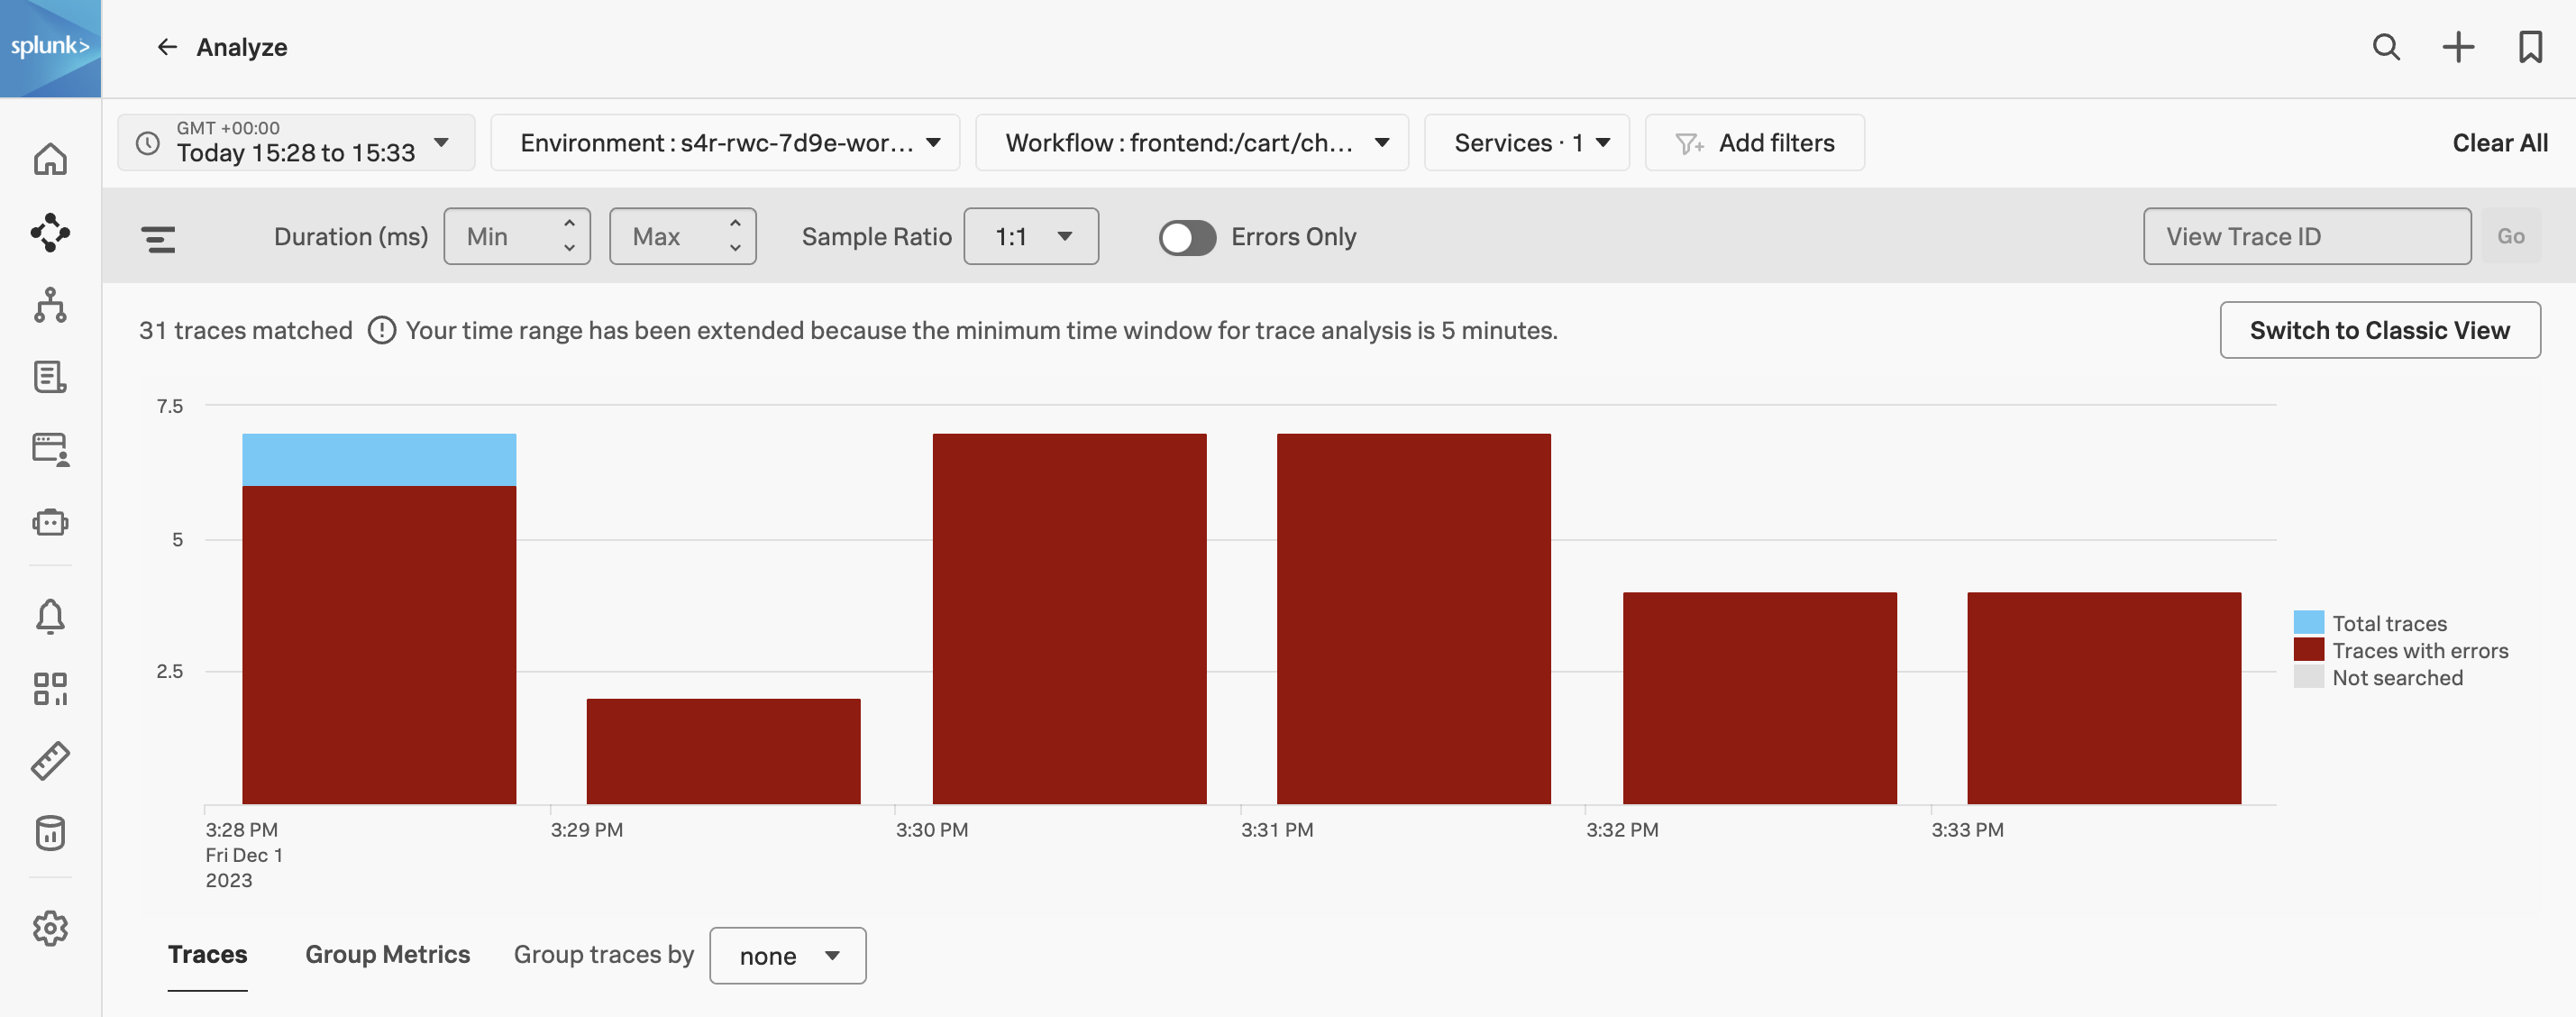
- In the time picker select Last 1 hour.
- Note, that most of our traces have errors (red) and there are only a limited amount of traces that are error-free (blue).
- Make sure the Sample Ratio is set to
1:1and not1:10. - Click on Add filters, type in
orderIdand select orderId from the list. - Paste in your Order Confirmation ID from when you went shopping earlier in the workshop and hit enter. If you didn’t capture one, please ask your instructor for one.
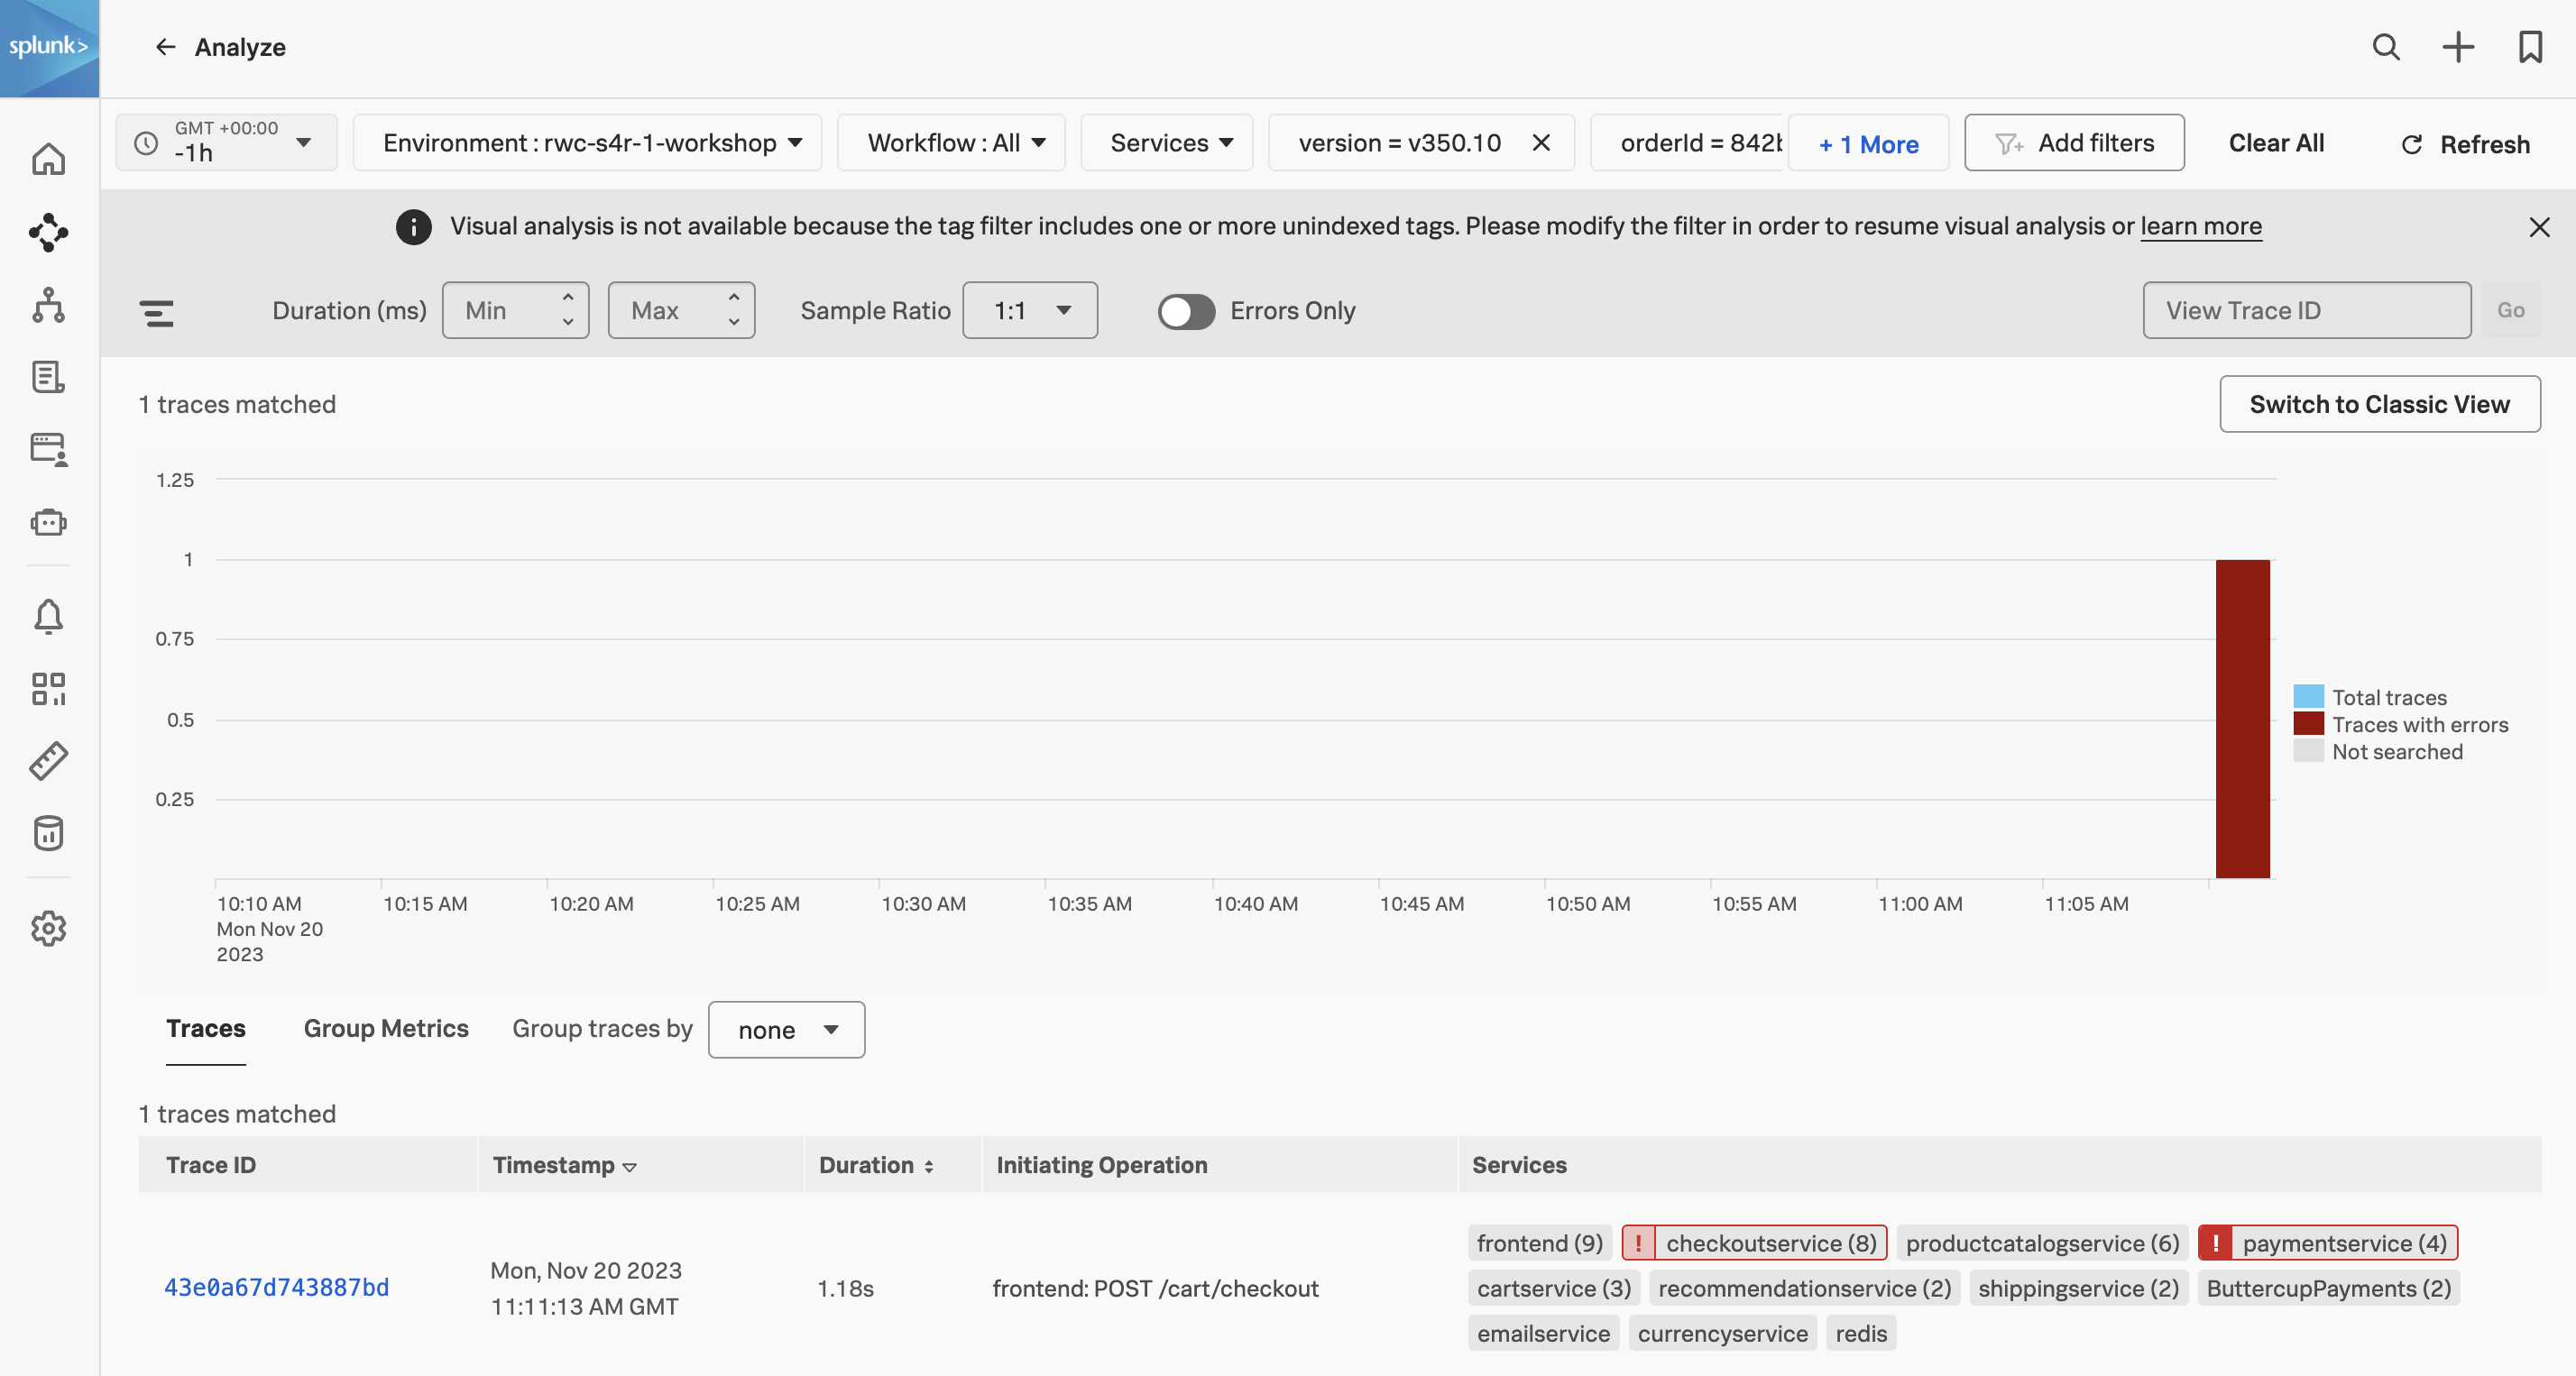
We have now filtered down to the exact trace where you encountered a poor user experience with a very long checkout wait. A secondary benefit to viewing this trace is that the trace will be accessible for up to 13 months. This will allow developers to come back to this issue at a later stage and still view this trace for example.
- Click on the trace in the list.
Next, we will walk through the trace waterfall.