6. APM Waterfall
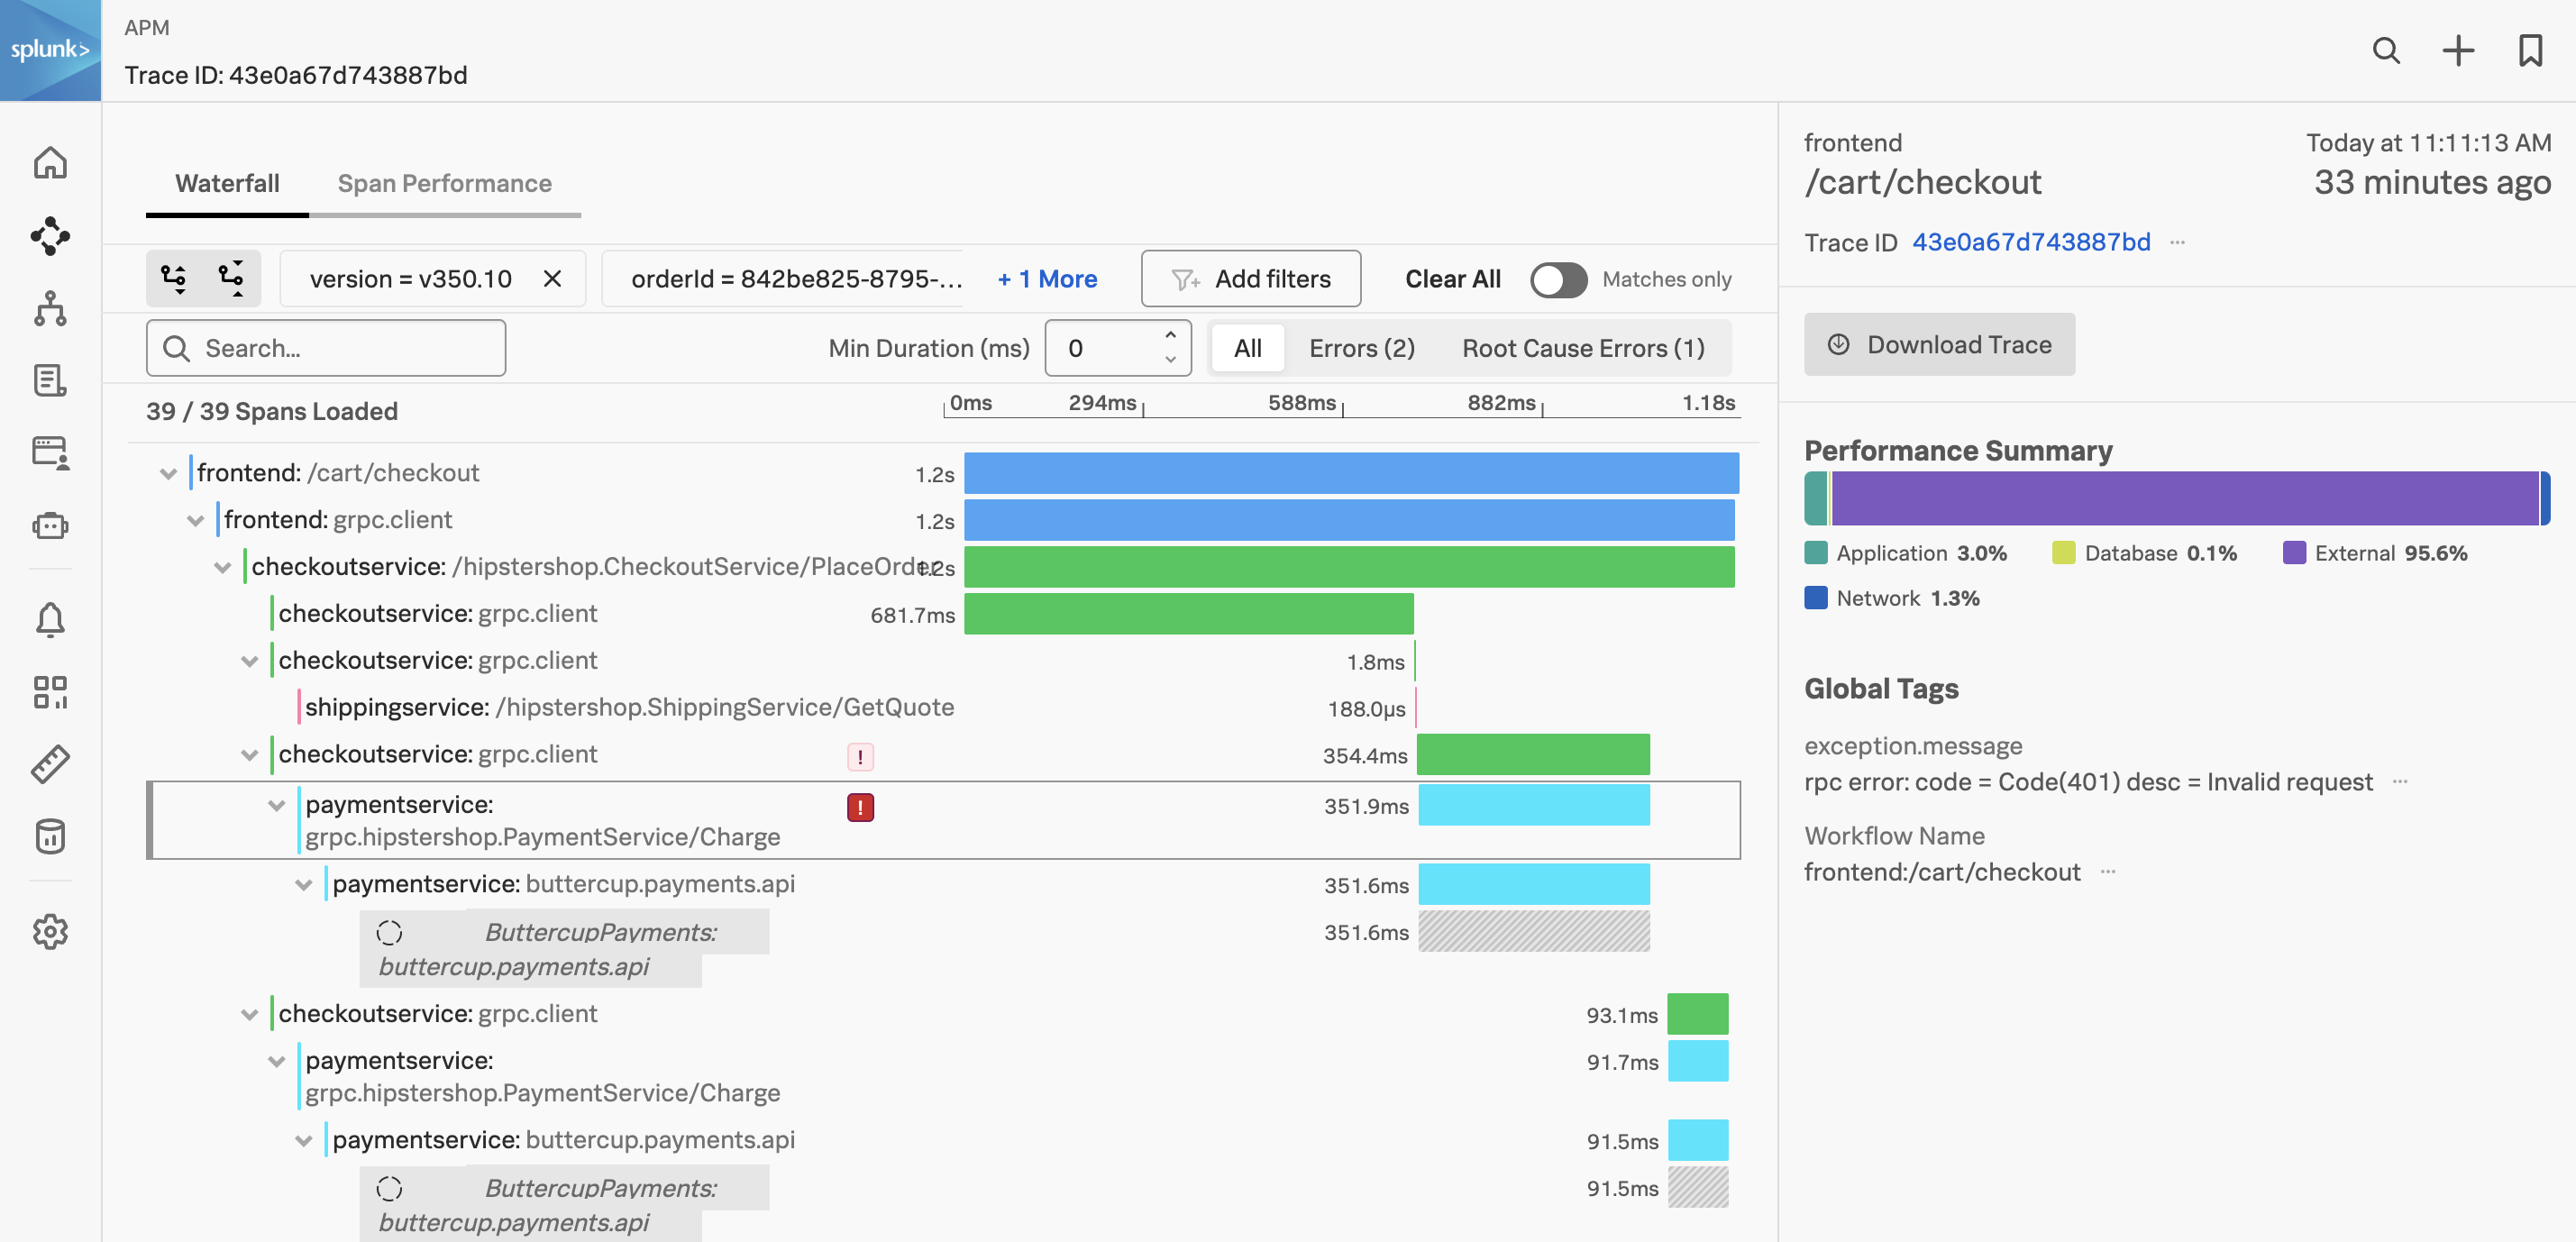
We have arrived at the Trace Waterfall from the Trace Analyzer. A trace is a collection of spans that share the same trace ID, representing a unique transaction handled by your application and its constituent services.
Each span in Splunk APM captures a single operation. Splunk APM considers a span to be an error span if the operation that the span captures results in an error.
Exercise
- Click on the ! next to any of the
paymentservice:grpc.hipstershop.PaymentService/Chargespans in the waterfall.
What is the error message and version being reported in the span metadata?
Invalid request and v350.10.
Related Content relies on specific metadata that allow APM, Infrastructure Monitoring, and Log Observer to pass filters around Observability Cloud. For related logs to work, you need to have the following metadata in your logs:
service.namedeployment.environmenthost.nametrace_idspan_id
Exercise
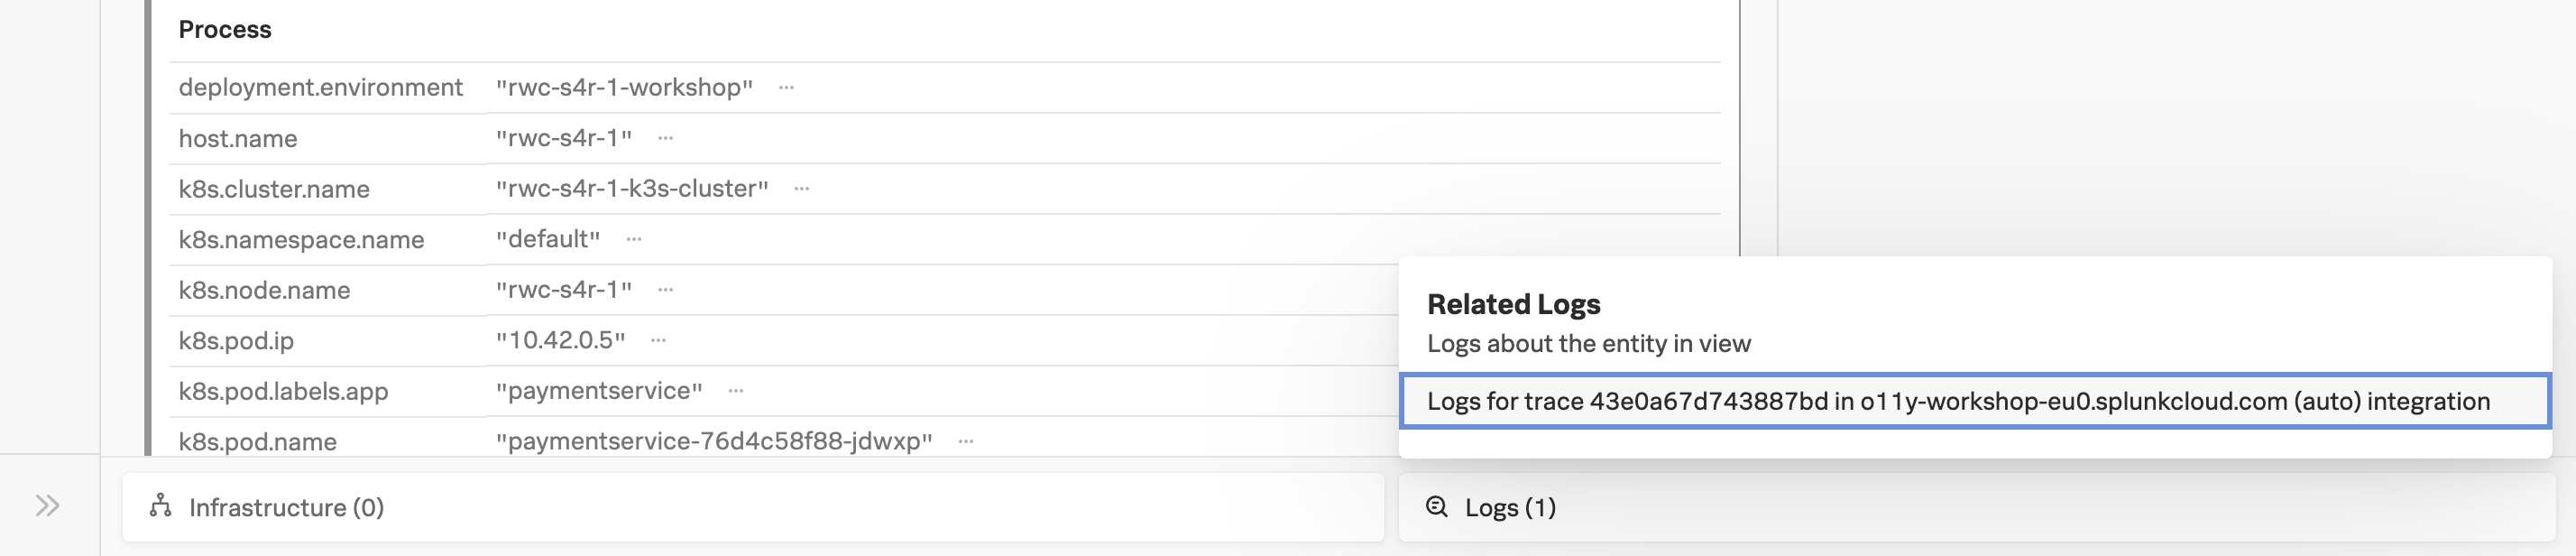
- At the very bottom of the Trace Waterfall click on the word Logs (1). This highlights that there are Related Logs for this trace.
- Click on the Logs for trace XXX entry in the pop-up, this will open the logs for the complete trace in Log Observer.