1. Log Filtering
Log Observer (LO), can be used in multiple ways. In the quick tour, you used the LO no-code interface to search for specific entries in the logs. This section, however, assumes you have arrived in LO from a trace in APM using the Related Content link.
The advantage of this is, as it was with the link between RUM & APM, that you are looking at your logs within the context of your previous actions. In this case, the context is the time frame (1), which matches that of the trace and the filter (2) which is set to the trace_id.
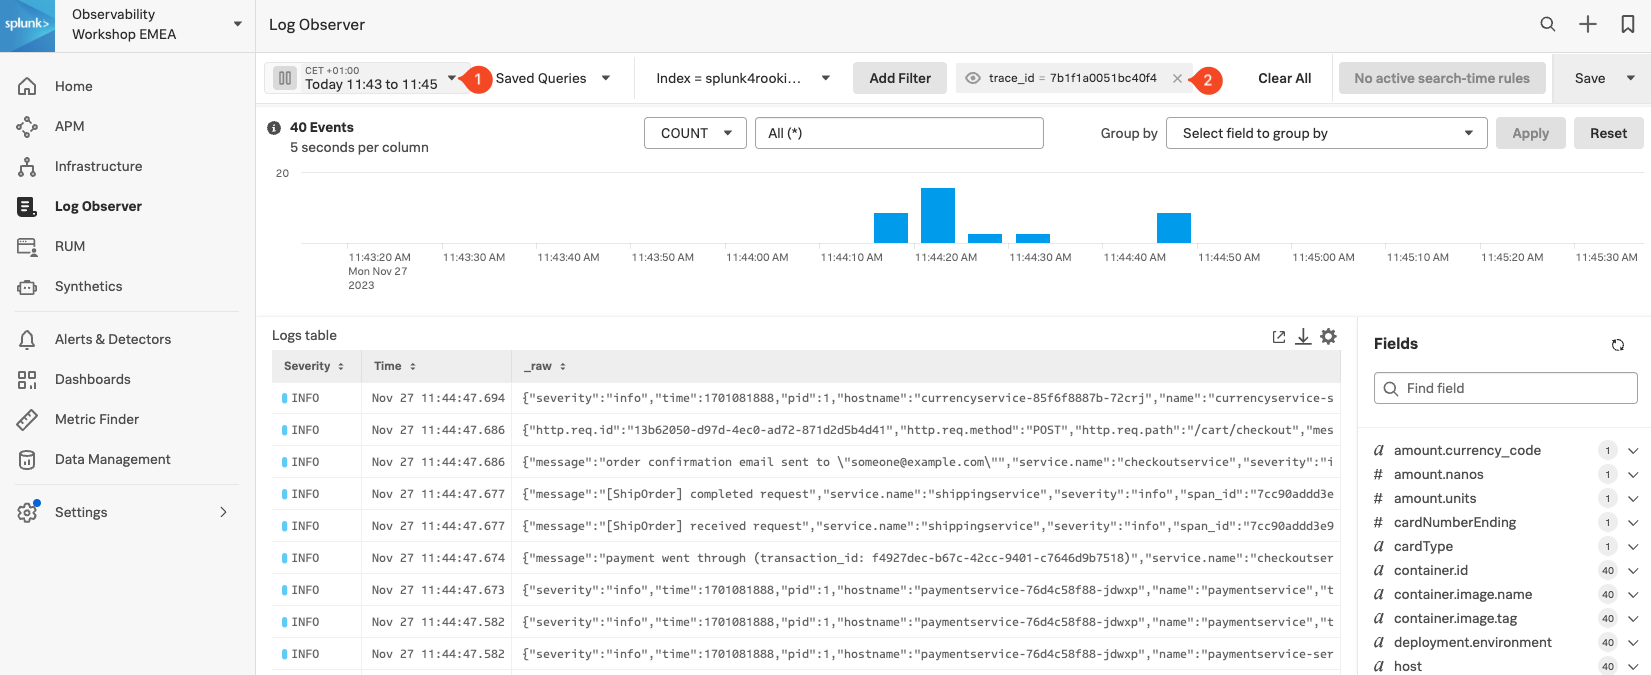
This view will include all the log lines from all applications or services that participated in the back-end transaction started by the end-user interaction with the Online Boutique.
Even in a small application such as our Online Boutique, the sheer amount of logs found can make it hard to see the specific log lines that matter to the actual incident we are investigating.
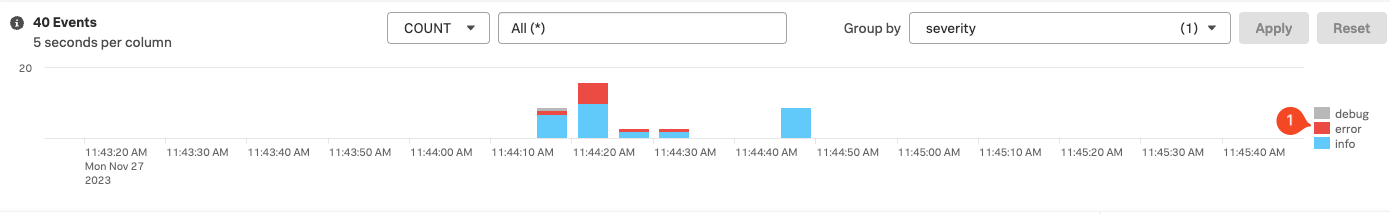
We need to focus on just the Error messages in the logs:
- Click on the Group By drop-down box and use the filter to find Severity.
- Once selected click the Apply button (notice that the chart legend changes to show debug, error and info).
- Selecting just the error logs can be done by either clicking on the word error (1) in the legend, followed by selecting Add to filter.
- You could also add the service name,
sf_service=paymentservice, to the filter if there are error lines for multiple services, but in our case, this is not necessary.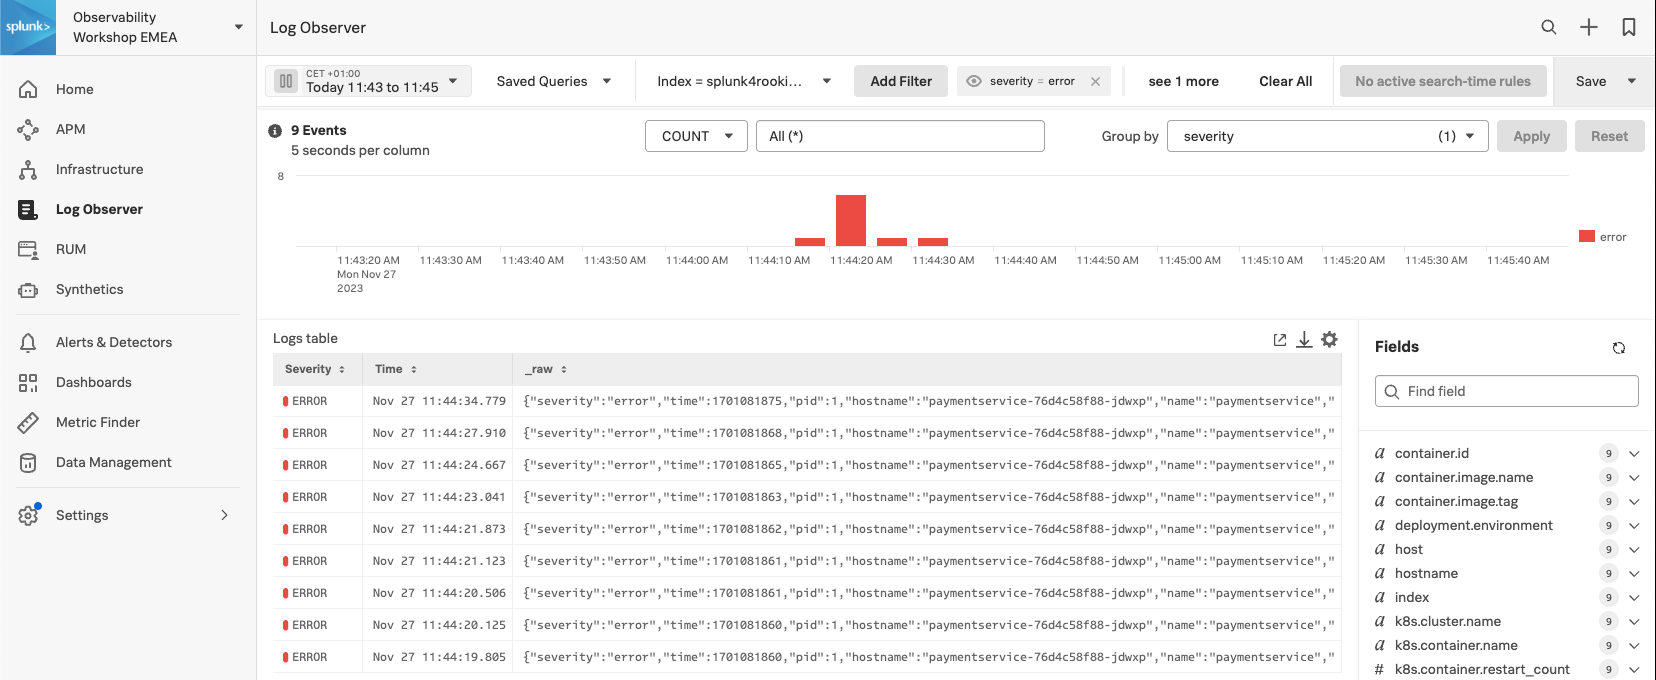
Next, we will look at log entries in detail.