4. Log View Chart
The next chart type that can be used with logs is the Log View chart type. This chart will allow us to see log messages based on predefined filters.
As with the previous Log Timeline chart, we will add a version of this chart to our Customer Health Service Dashboard:
Exercise
- After the previous exercise make sure you are still in Log Observer.
- The filters should be the same as the previous exercise, with the time picker set to the Last 15 minutes and filtering on severity=error,
sf_service=paymentserviceandsf_environment=[WORKSHOPNAME]. - Make sure we have the header with just the fields we wanted.
- Click again on Save and then Save to Dashboard.
- This will again provide you with the Chart creation dialog.
- For the Chart name use Log View.
- This time Click Select Dashboard and search for the Dashboard you created in the previous exercise. You can start by typing your initials in the search box (1).
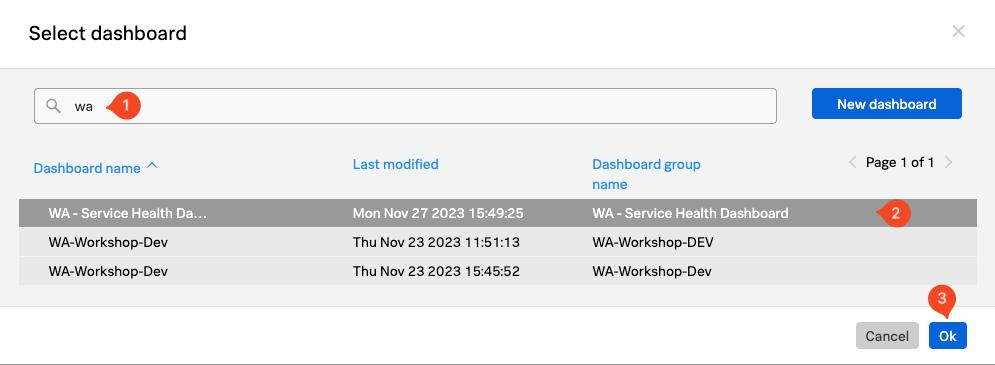
- Click on your dashboard name to highlight it (2) and click OK (3).
- This will return you to the create chart dialog.
- Ensure Log View is selected as the Chart Type.

- To see your dashboard click Save and go to dashboard.
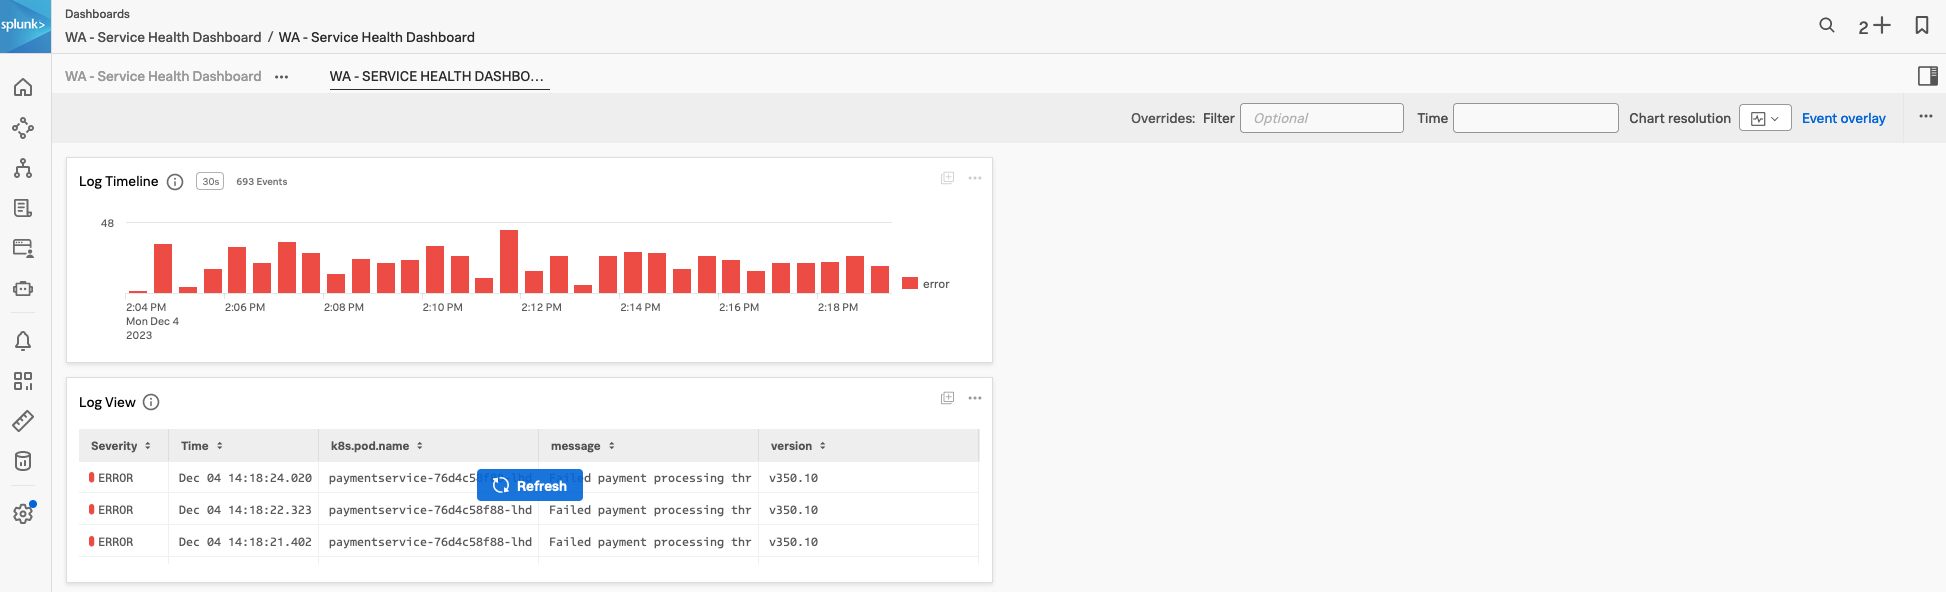
- The result should be similar to the dashboard below:
- As the last step in this exercise, let us add your dashboard to your workshop team page, this will make it easy to find later in the workshop.
- At the top of the page, click on the … to the left of your dashboard name (1).
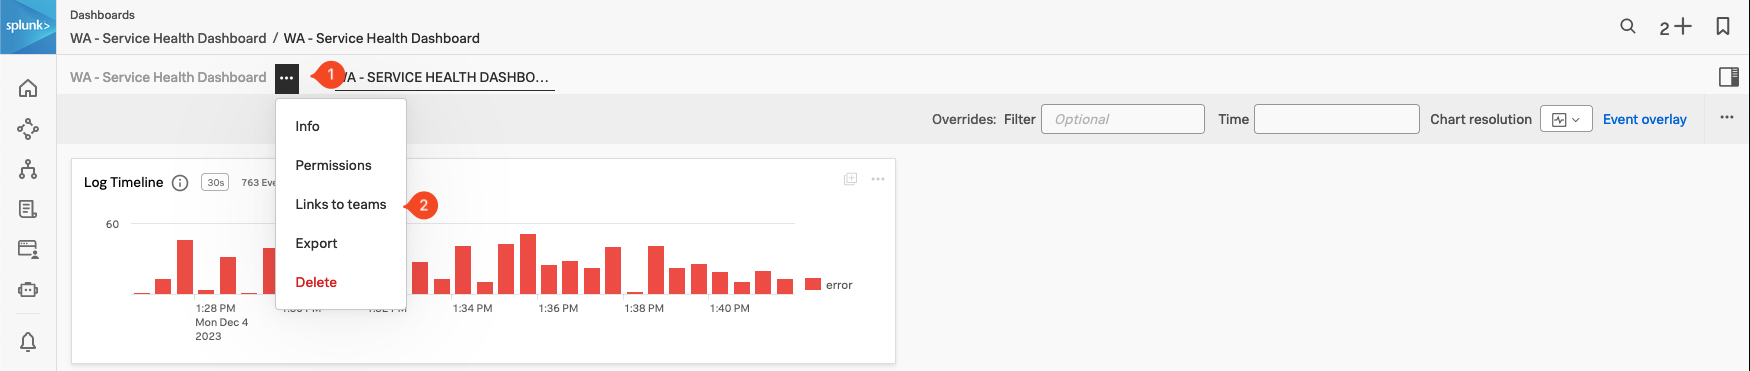
- Select Link to teams from the drop-down (2).
- In the following Link to teams dialog box, find the Workshop team that your instructor will have provided for you and click Done.
In the next session, we will look at Splunk Synthetics and see how we can automate the testing of web-based applications.