Troubleshoot Game Startup
10 minutesLet’s use Splunk Observability Cloud to determine why the game started so slowly.
View your application in Splunk Observability Cloud
Note: when the application is deployed for the first time, it may take a few minutes for the data to appear.
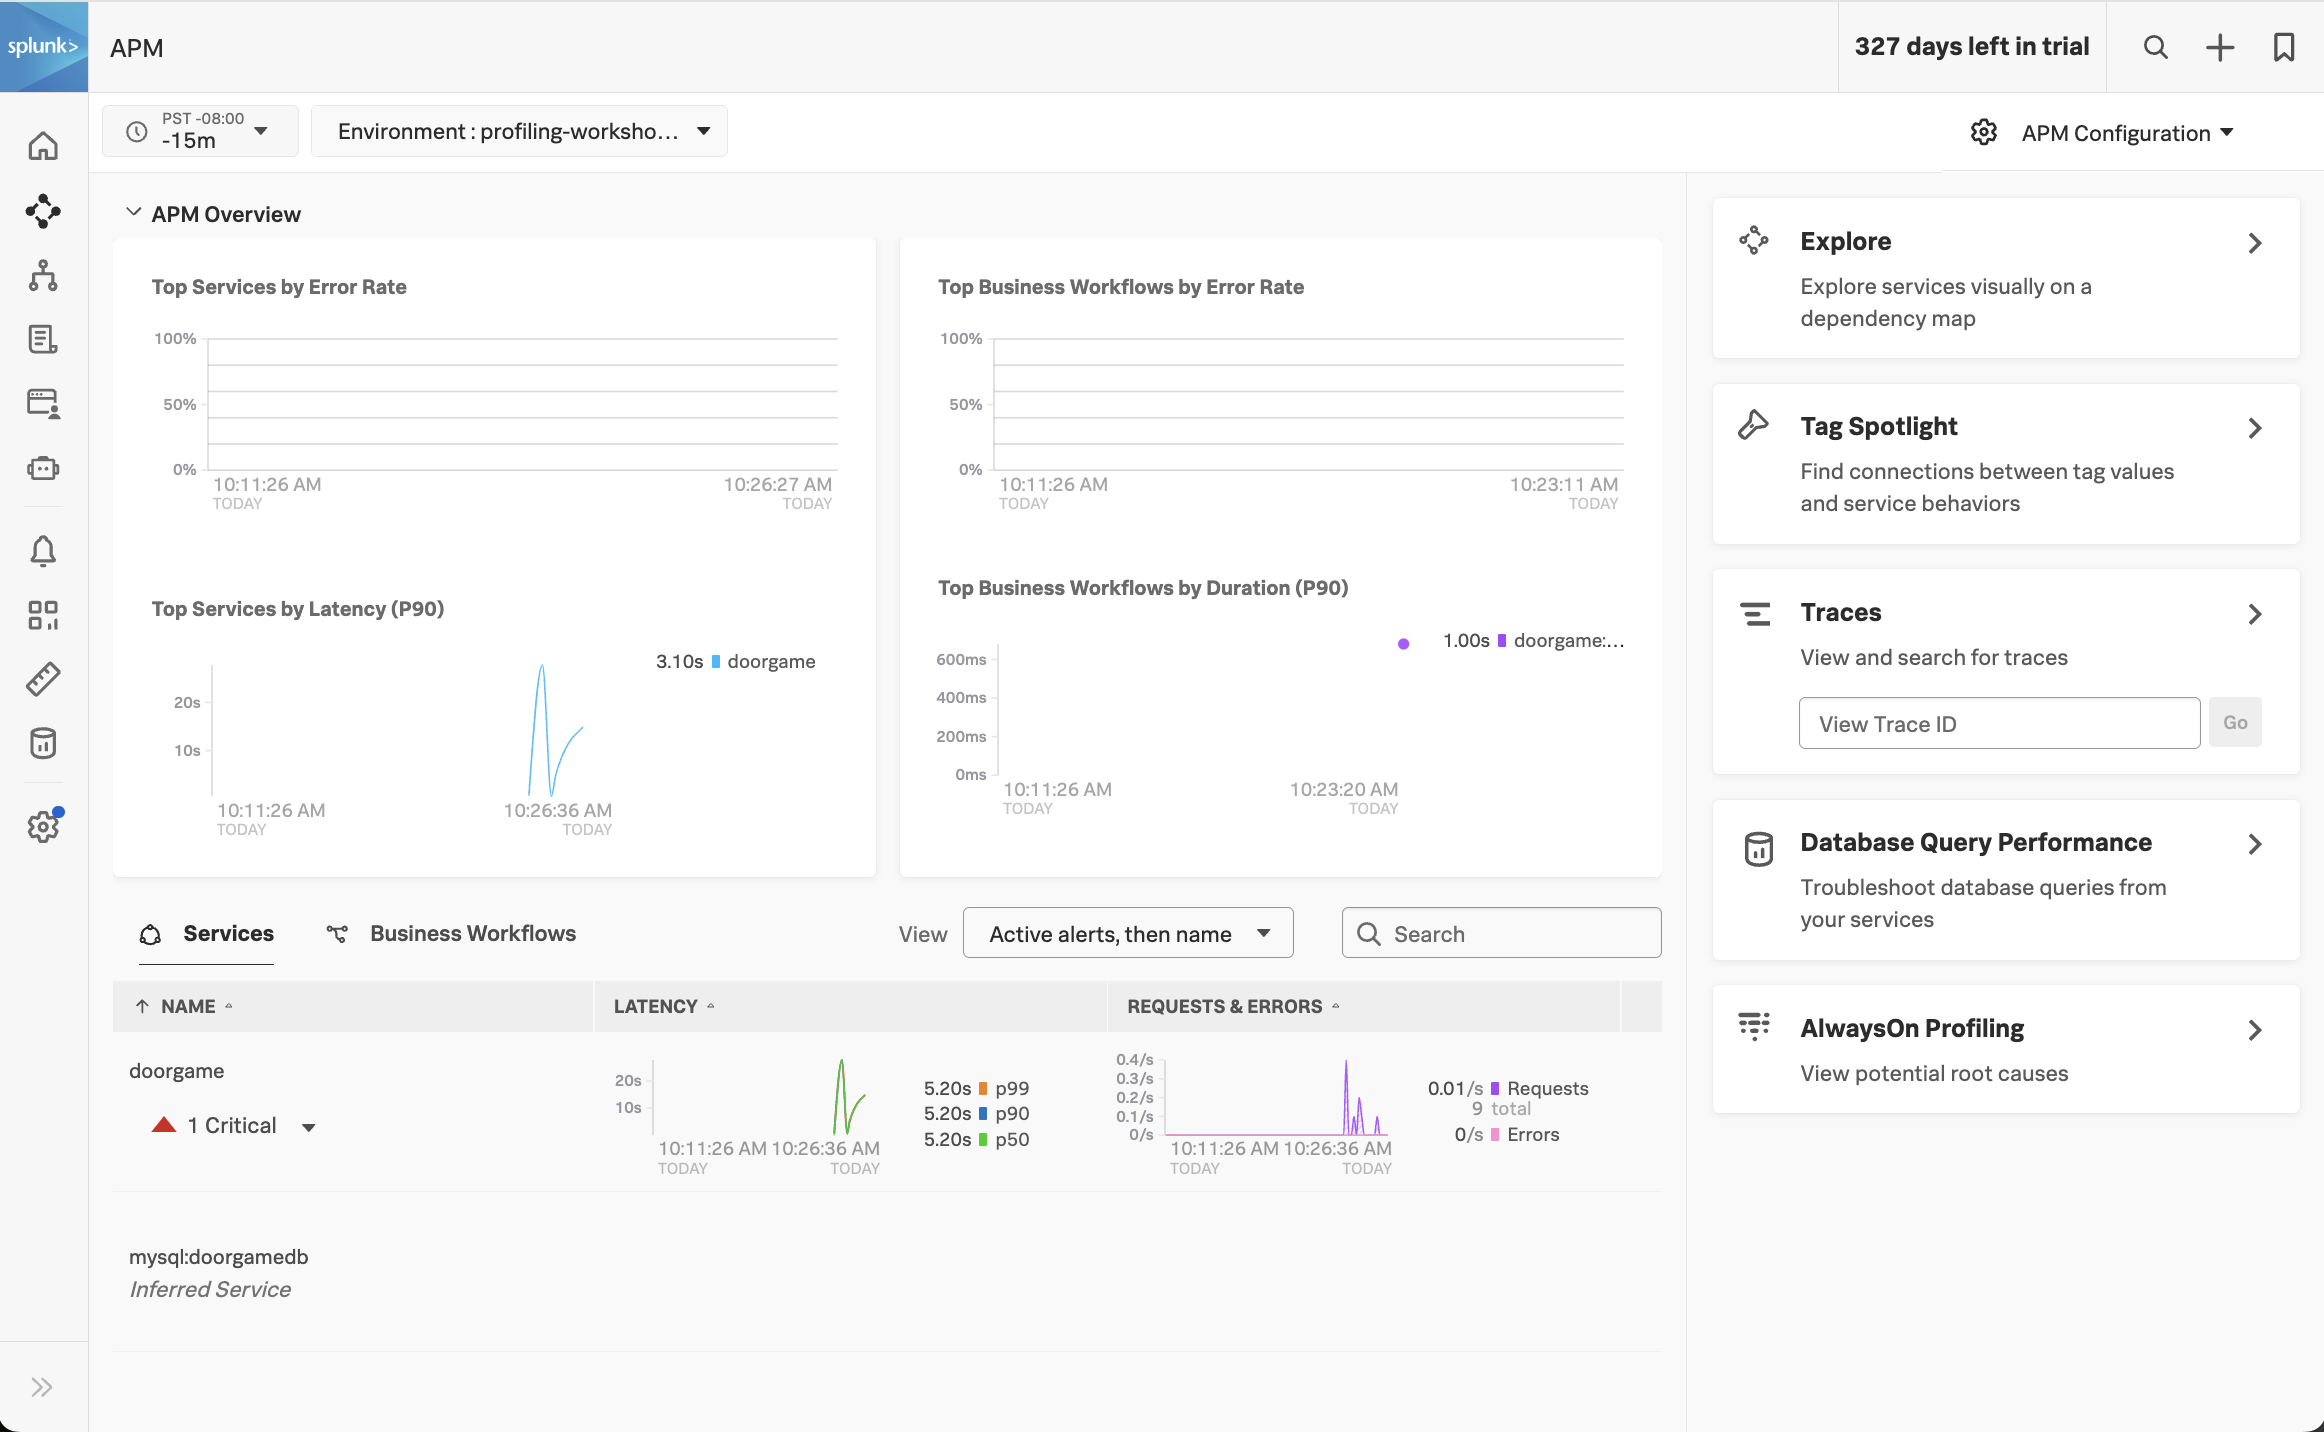
Navigate to APM, then use the Environment dropdown to select your environment (i.e. profiling-workshop-name).
If everything was deployed correctly, you should see doorgame displayed in the list of services:
Click on Explore on the right-hand side to view the service map. We should the doorgame application on the service map:
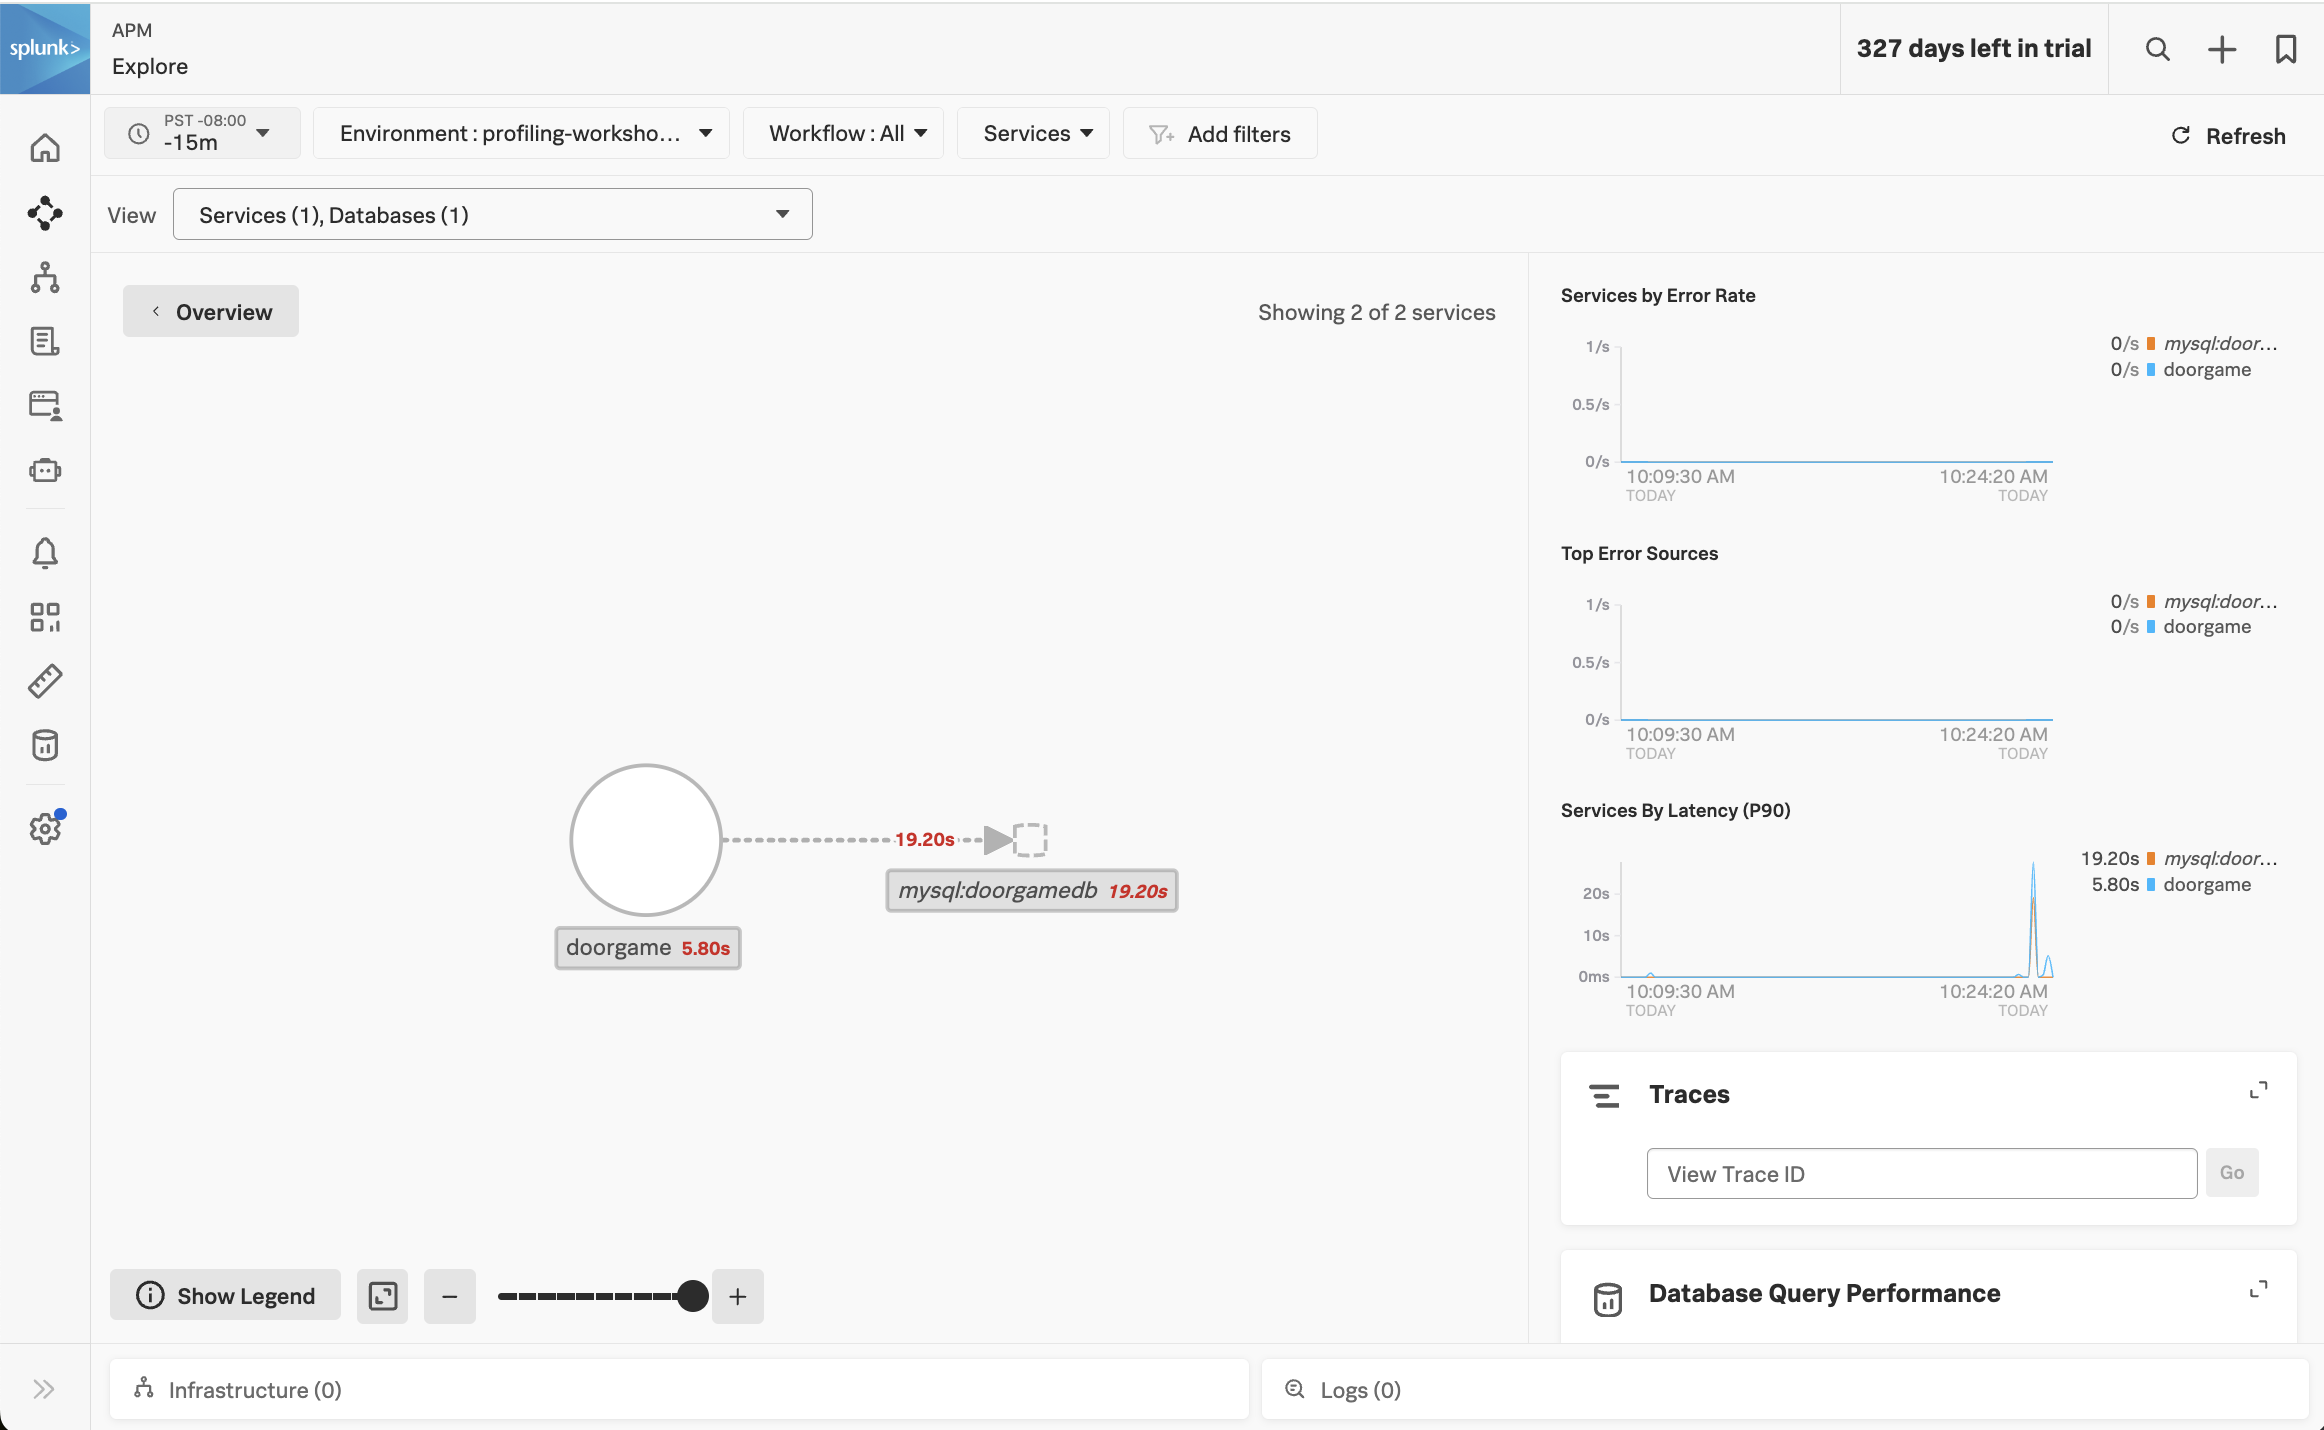
Notice how the majority of the time is being spent in the MySQL database. We can get more details by clicking on Database Query Performance on the right-hand side.
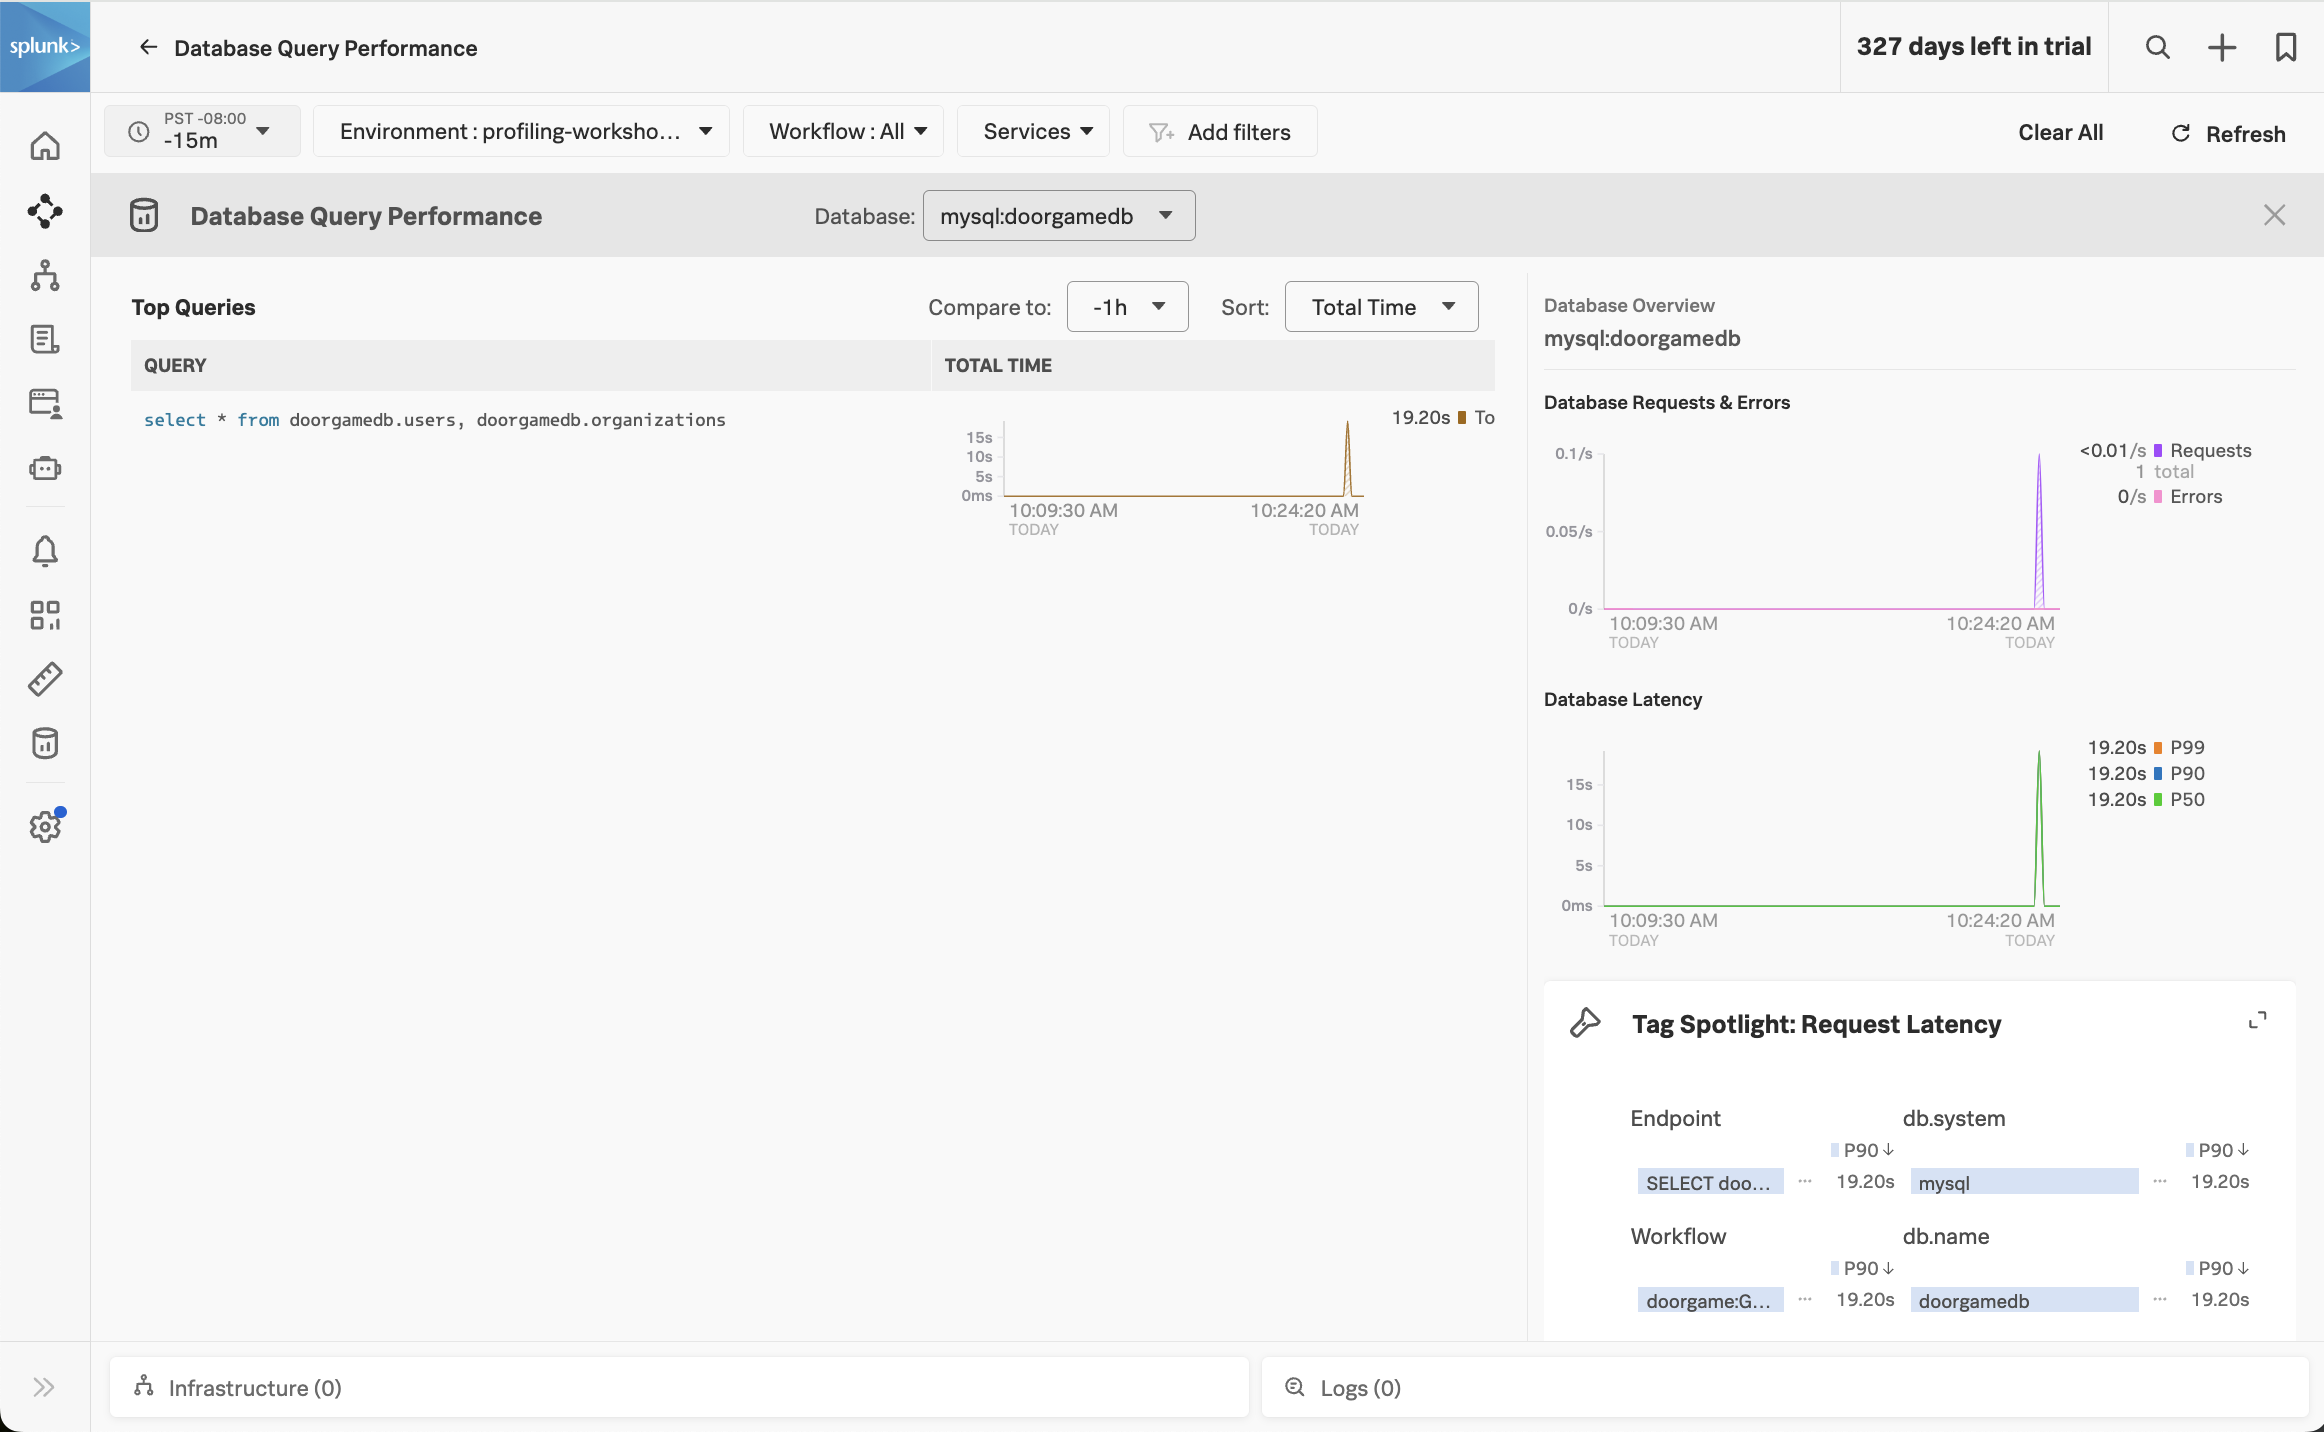
This view shows the SQL queries that took the most amount of time. Ensure that the Compare to dropdown is set to None, so we can focus on current performance.
We can see that one query in particular is taking a long time:
select * from doorgamedb.users, doorgamedb.organizations(do you notice anything unusual about this query?)
Let’s troubleshoot further by clicking on one of the spikes in the latency graph. This brings up a list of example traces that include this slow query:
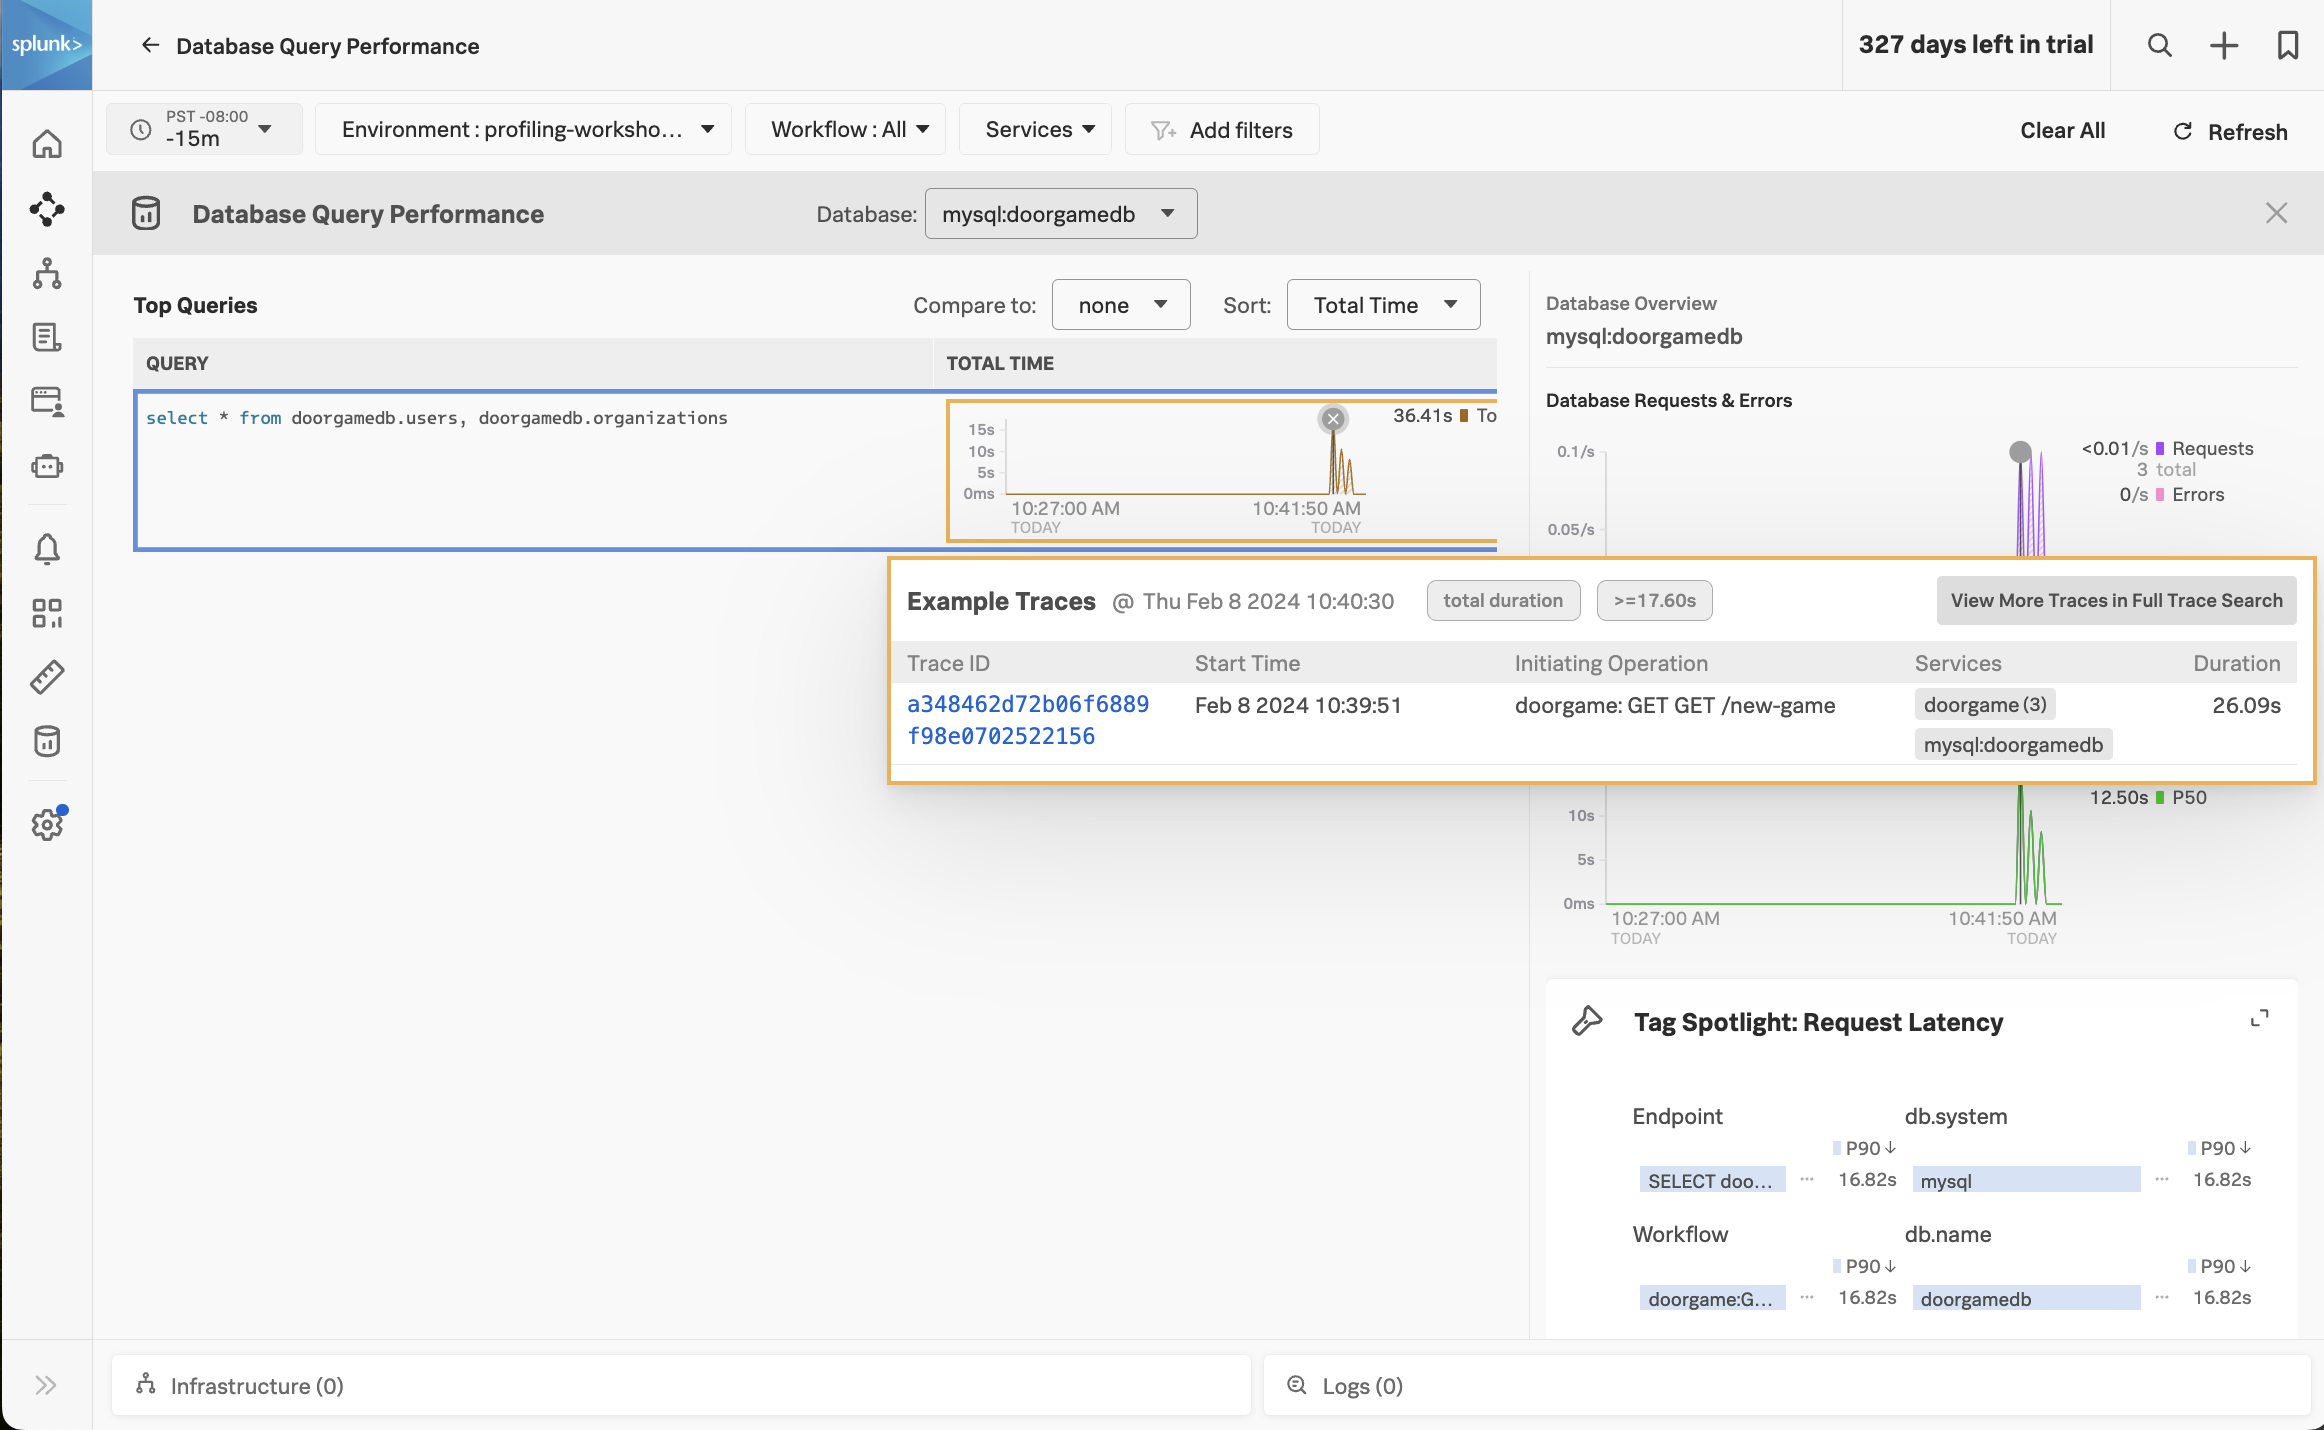
Click on one of the traces to see the details:
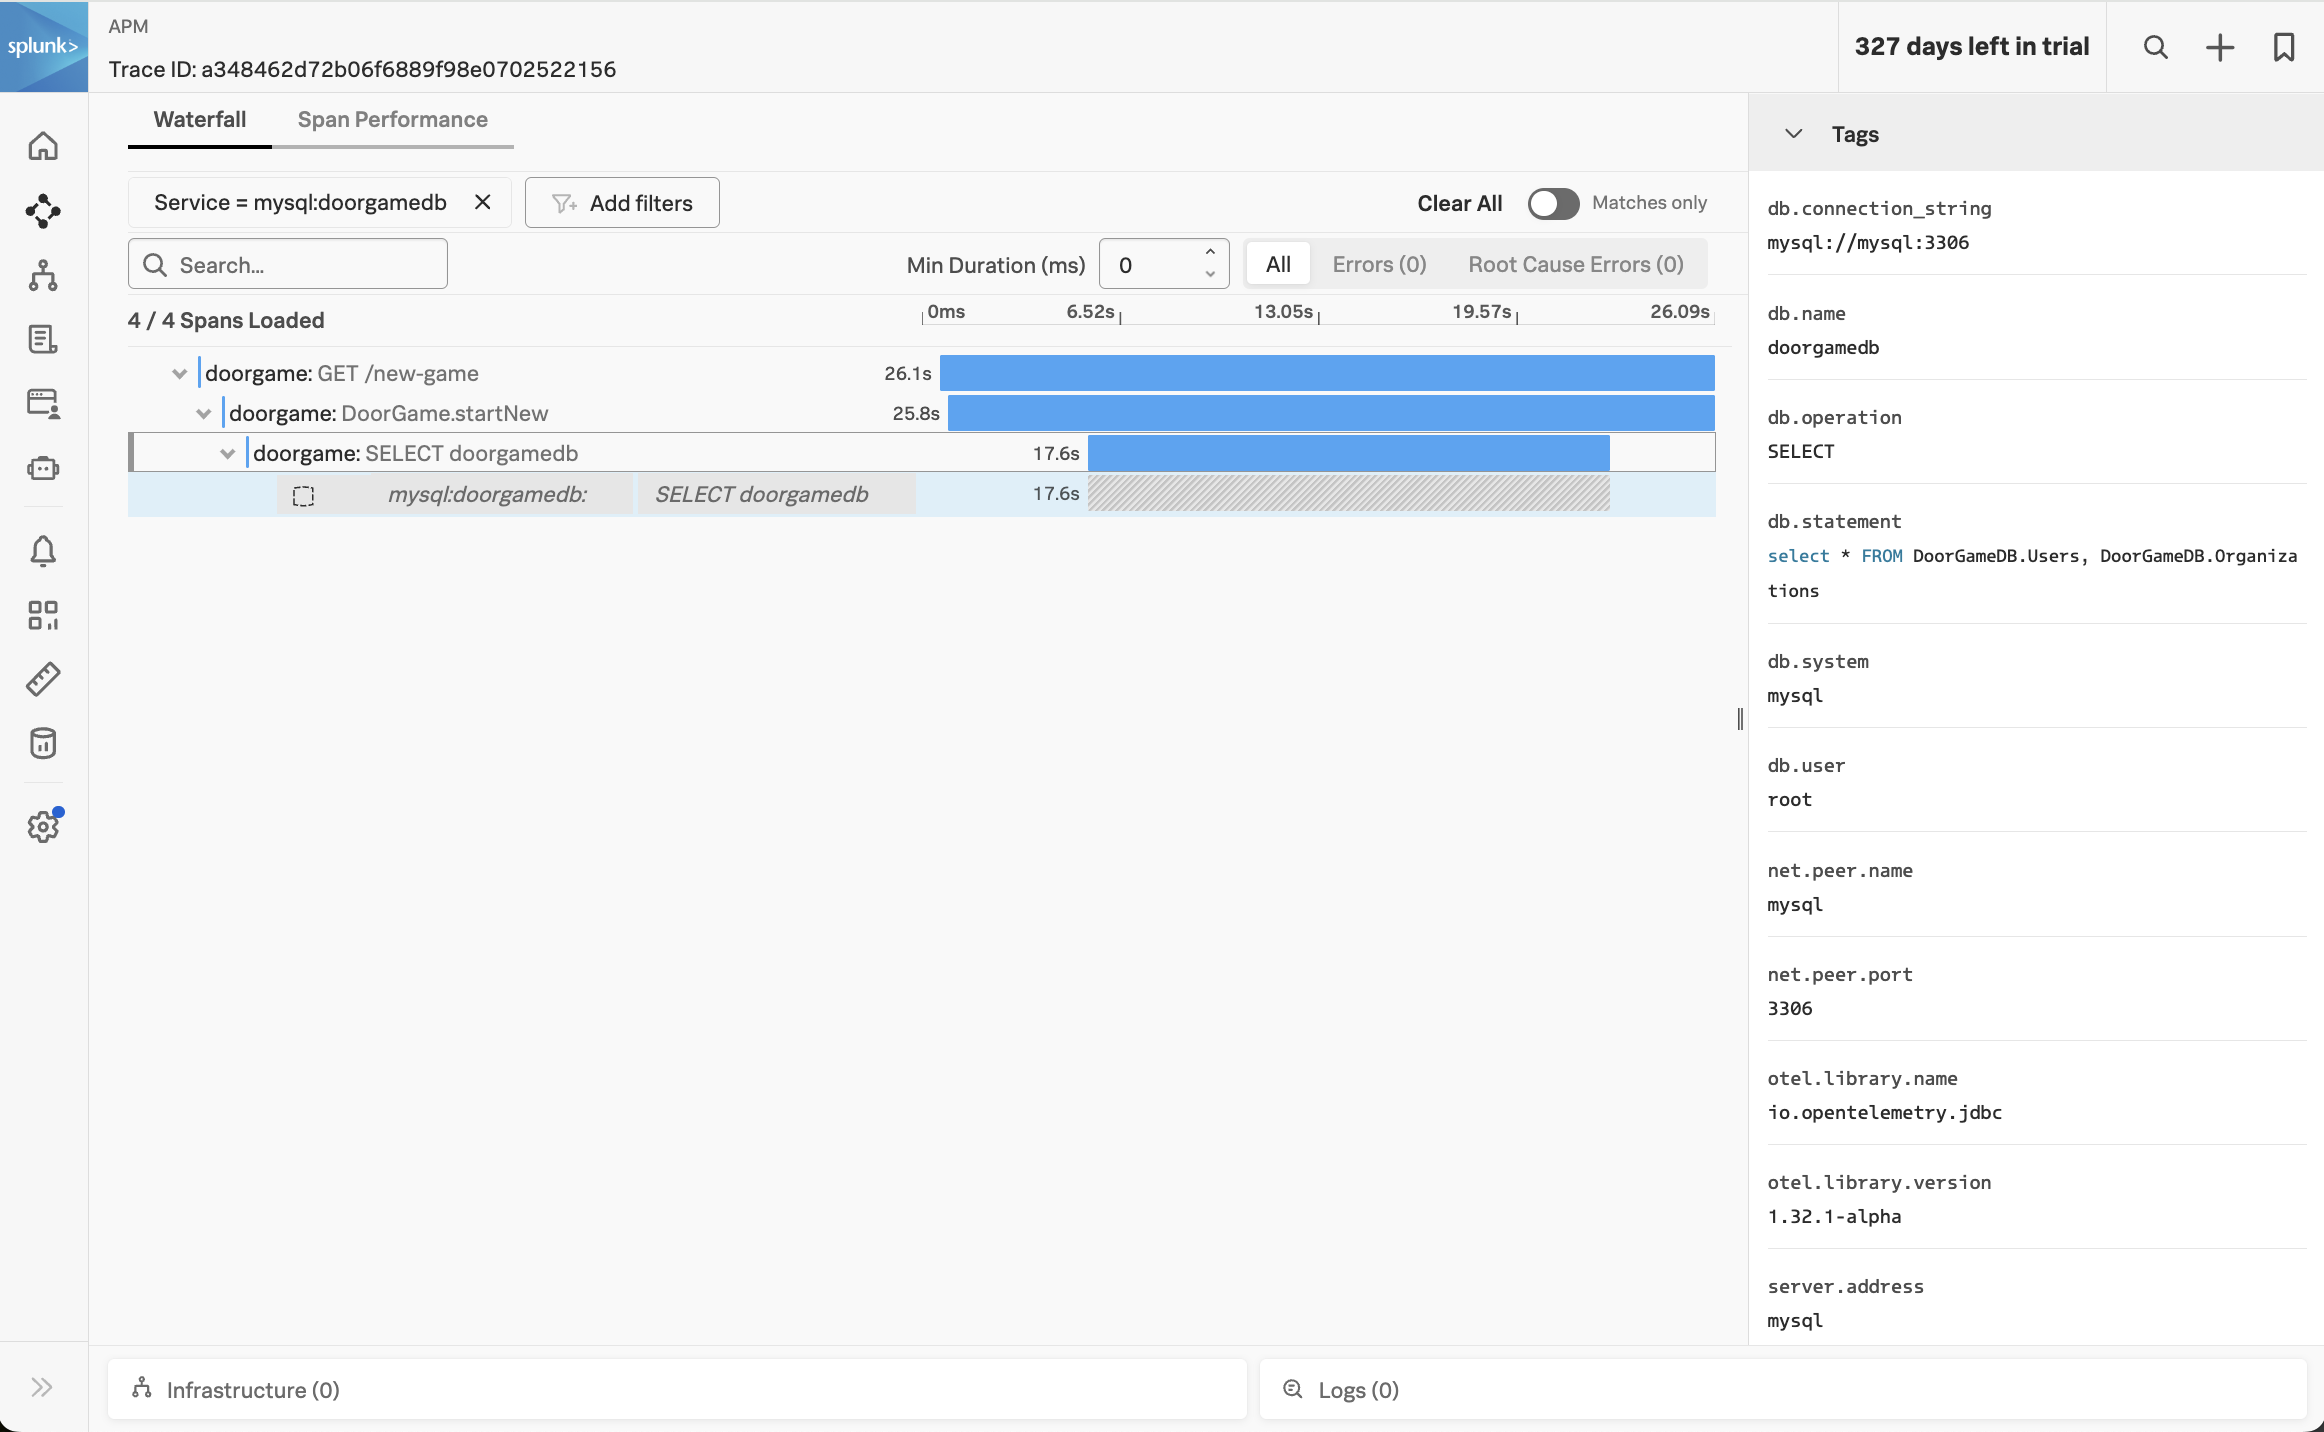
In the trace, we can see that the DoorGame.startNew operation took 25.8 seconds, and 17.6 seconds of this was associated with the slow SQL query we found earlier.
What did we accomplish?
To recap what we’ve done so far:
- We’ve deployed our application and are able to access it successfully.
- The application is sending traces to Splunk Observability Cloud successfully.
- We started troubleshooting the slow application startup time, and found a slow SQL query that seems to be the root cause.
To troubleshoot further, it would be helpful to get deeper diagnostic data that tells us what’s happening inside our JVM, from both a memory (i.e. JVM heap) and CPU perspective. We’ll tackle that in the next section of the workshop.