RUM Landing Page
- Visit the RUM landing page and and check the overview of the performance of all your RUM enabled applications with the Application Summary Dashboard (Both Mobile and Web based)
1. Visit the RUM Landing Page
Login into Splunk Observability. From the left side menu bar select RUM  . This will bring you to your the RUM Landing Page.
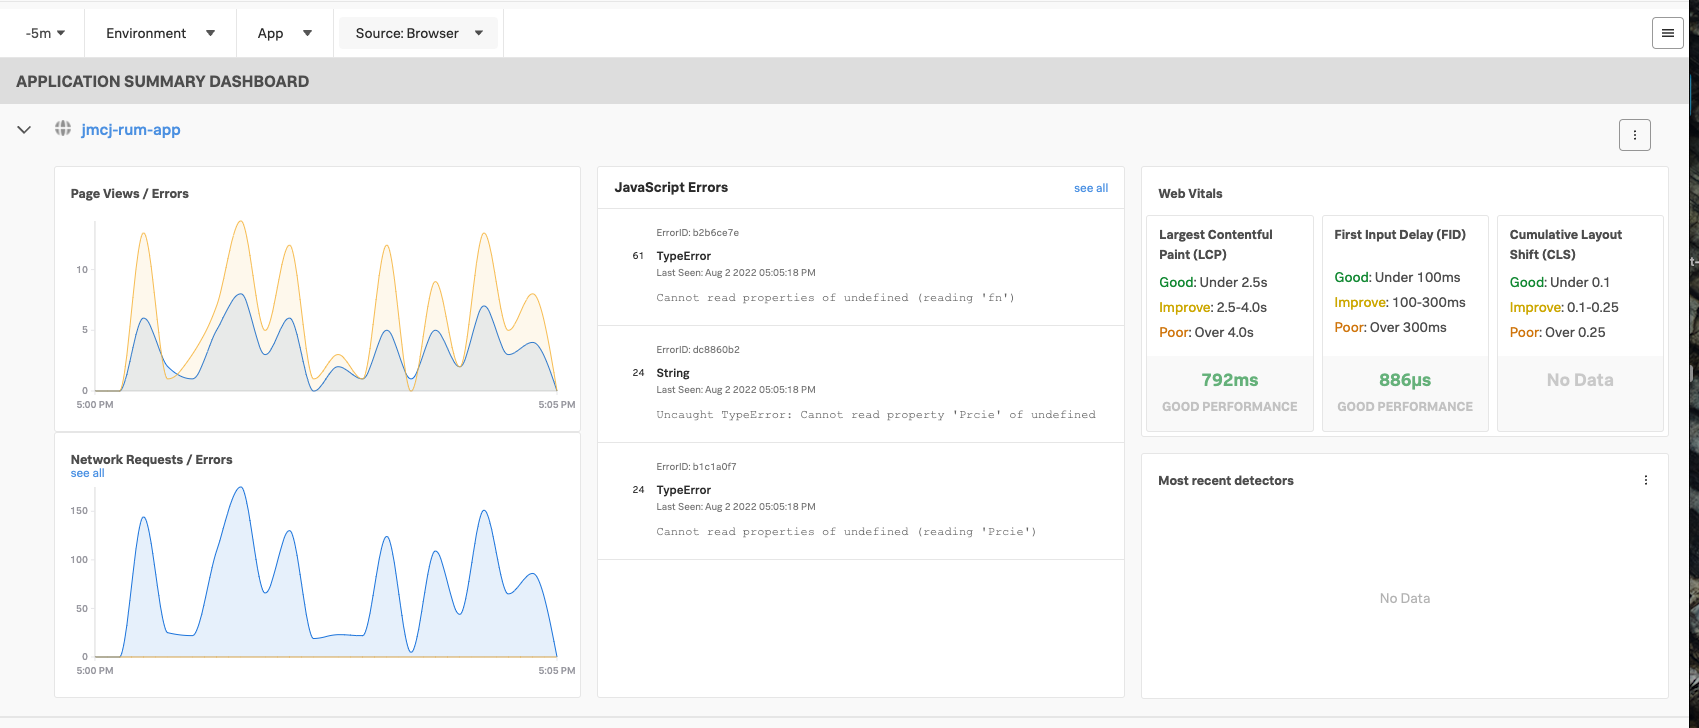
The goal of this page is to give you in a single page, a clear indication of the health, performance and potential errors found in your application(s) and allow you to dive deeper into the information about your User Sessions collected from your web page/App. You will have a pane for each of your active RUM applications. (The view below is the default expanded view)
If you have multiple applications, (which will be the case when every attendee is using their own ec2 instance for the RUM workshop), the pane view may be automatically reduced by collapsing the panes as shown below:
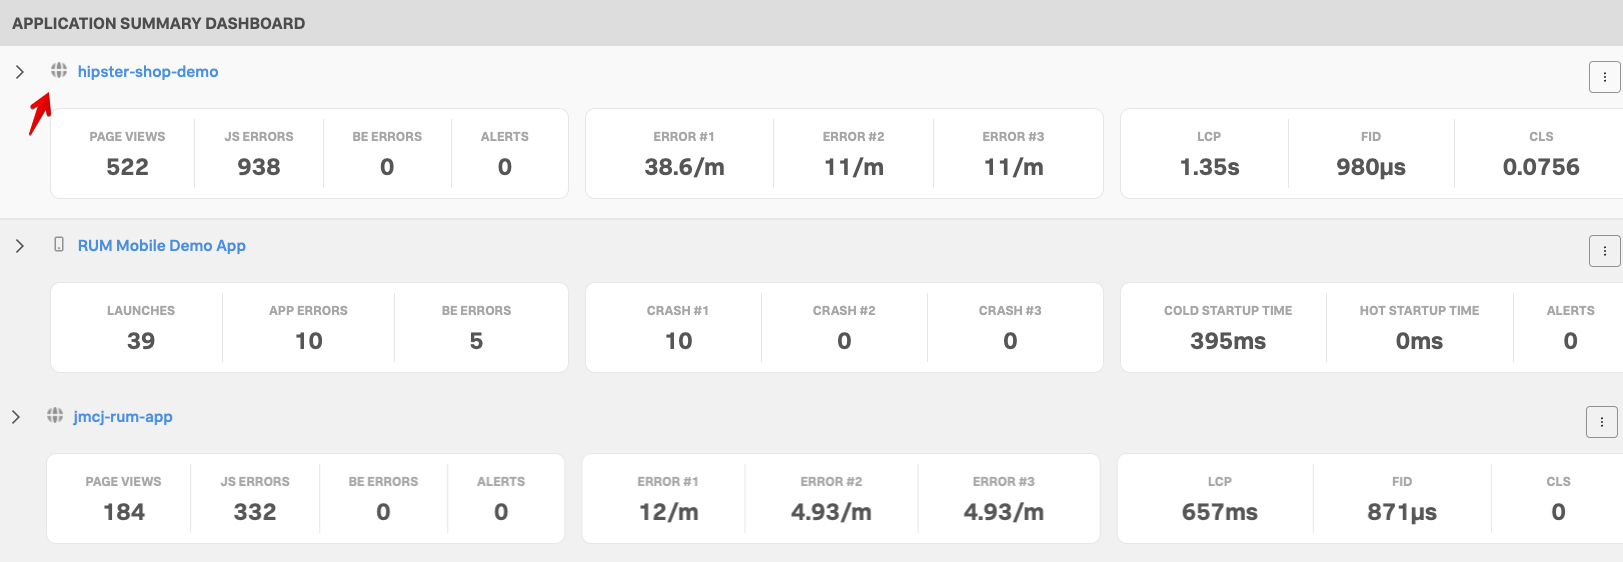
You can expanded a condensed RUM Application Summary View to the full dashboard by clicking on the small browser  or Mobile
  icon. (Depending on the type of application: Mobile or Browser based) on the left in front of the applications name, highlighted by the red arrow.
First find the right application to use for the workshop:
If you are participating in a stand alone RUM workshop, the workshop leader will tell you the name of the application to use, in the case of a combined workshop, it will follow the naming convention we used for IM and APM and use the ec2 node name as a unique id like jmcj-store as shown as the last app in the screenshot above.
2. Configure the RUM Application Summary Dashboard Header Section
RUM Application Summary Dashboard consists of 6 major sections. The first is the selection header, where you can set/filter a number of options:
- A drop down for the Time Window you’re reviewing (You are looking at the past 15 minutes by default)
- A drop down to select the Environment1 you want to look at. This allows you to focus on just the subset of applications belonging to that environment, or Select all to view all available.
- A drop down list with the various Apps being monitored. You can use the one provided by the workshop host or select your own. This will focus you on just one application.
- A drop down to select the Source, Browser or Mobile applications to view. For the Workshop leave All selected.
- A hamburger menu located at the right of the header allowing you to configure some settings of your Splunk RUM application. (We will visit this in a later section).

For the workshop lets do a deeper dive into the Application Summary screen in the next section: Check Health Browser Application
A common application deployment pattern is to have multiple, distinct application environments that don’t interact directly with each other but that are all being monitored by Splunk APM or RUM: for instance, quality assurance (QA) and production environments, or multiple distinct deployments in different datacenters, regions or cloud providers.
A deployment environment is a distinct deployment of your system or application that allows you to set up configurations that don’t overlap with configurations in other deployments of the same application. Separate deployment environments are often used for different stages of the development process, such as development, staging, and production. ↩︎