Check Browser Applications health at a glance
- Get familiar with the UI and options available from this landing page
- Identify Page Views/JavaScript Errors and Request/Errors in a single viewCheck the Web Vitals metrics and any Detector that has fired for in relation to your Browser Application
Application Summary Dashboard
1.Header Bar
As seen in the previous section the RUM Application Summary Dashboard consists of 5 major sections.The first section is the selection header, where you can collapse the Pane via the  Browser icon or the > in front of the application name, which is jmcj-store in the example below. It also provides access to the Application Overview page if you click the link with your application name which is jmcj-store in the example below.
Further, you can also open the Application Overview or App Health Dashboard via the triple dot  menu on the right.

For now, let’s look at the high level information we get on the application summary dashboard.
The RUM Application Summary Dashboard is focused on providing you with at a glance highlights of the status of your application.
2. Page Views / JavaScript Errors & Network Requests / Errors
The first section shows Page Views / JavaScript Errors, & Network Requests and Errors charts show the quantity and trend of these issues in your application. This could be Javascript errors, or failed network calls to back end services.
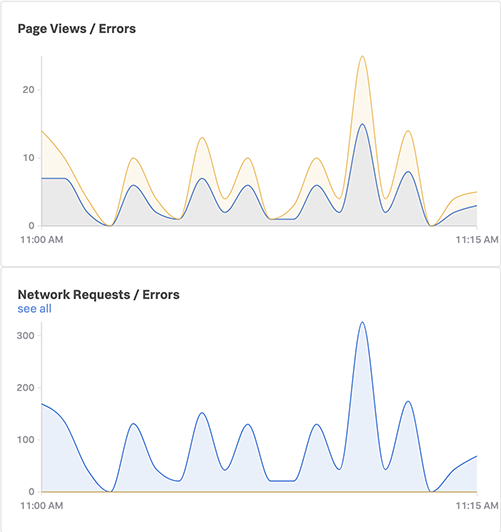
In the example above you can see that there are no failed network calls in the Network chart, but in the Page View chart you can see that a number of pages do experience some errors. These are often not visible for regular users, but can seriously impact the performance of your web site.
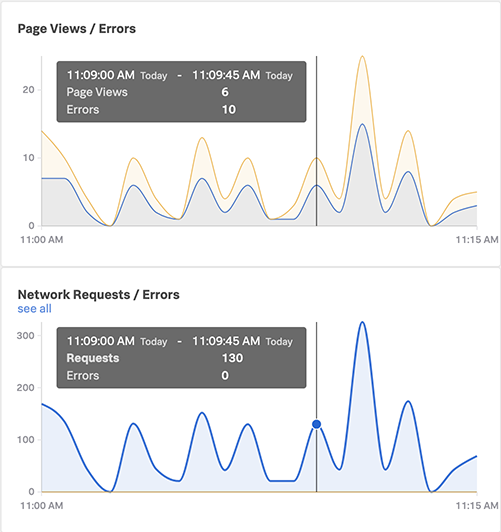
You can see the count of the Page Views / Network Requests / Errors by hovering over the charts.
3. JavaScript Errors
With the second section of the RUM Application Summary Dashboard we are showing you an overview of the JavaScript errors occurring in your application, along with a count of each error.
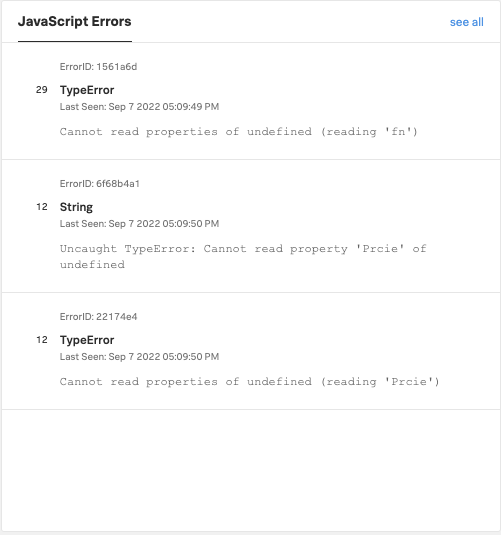
In the example above you can see there are three JavaScript errors, one that appears 29 times in the selected time slot, and the other two each appear 12 times.
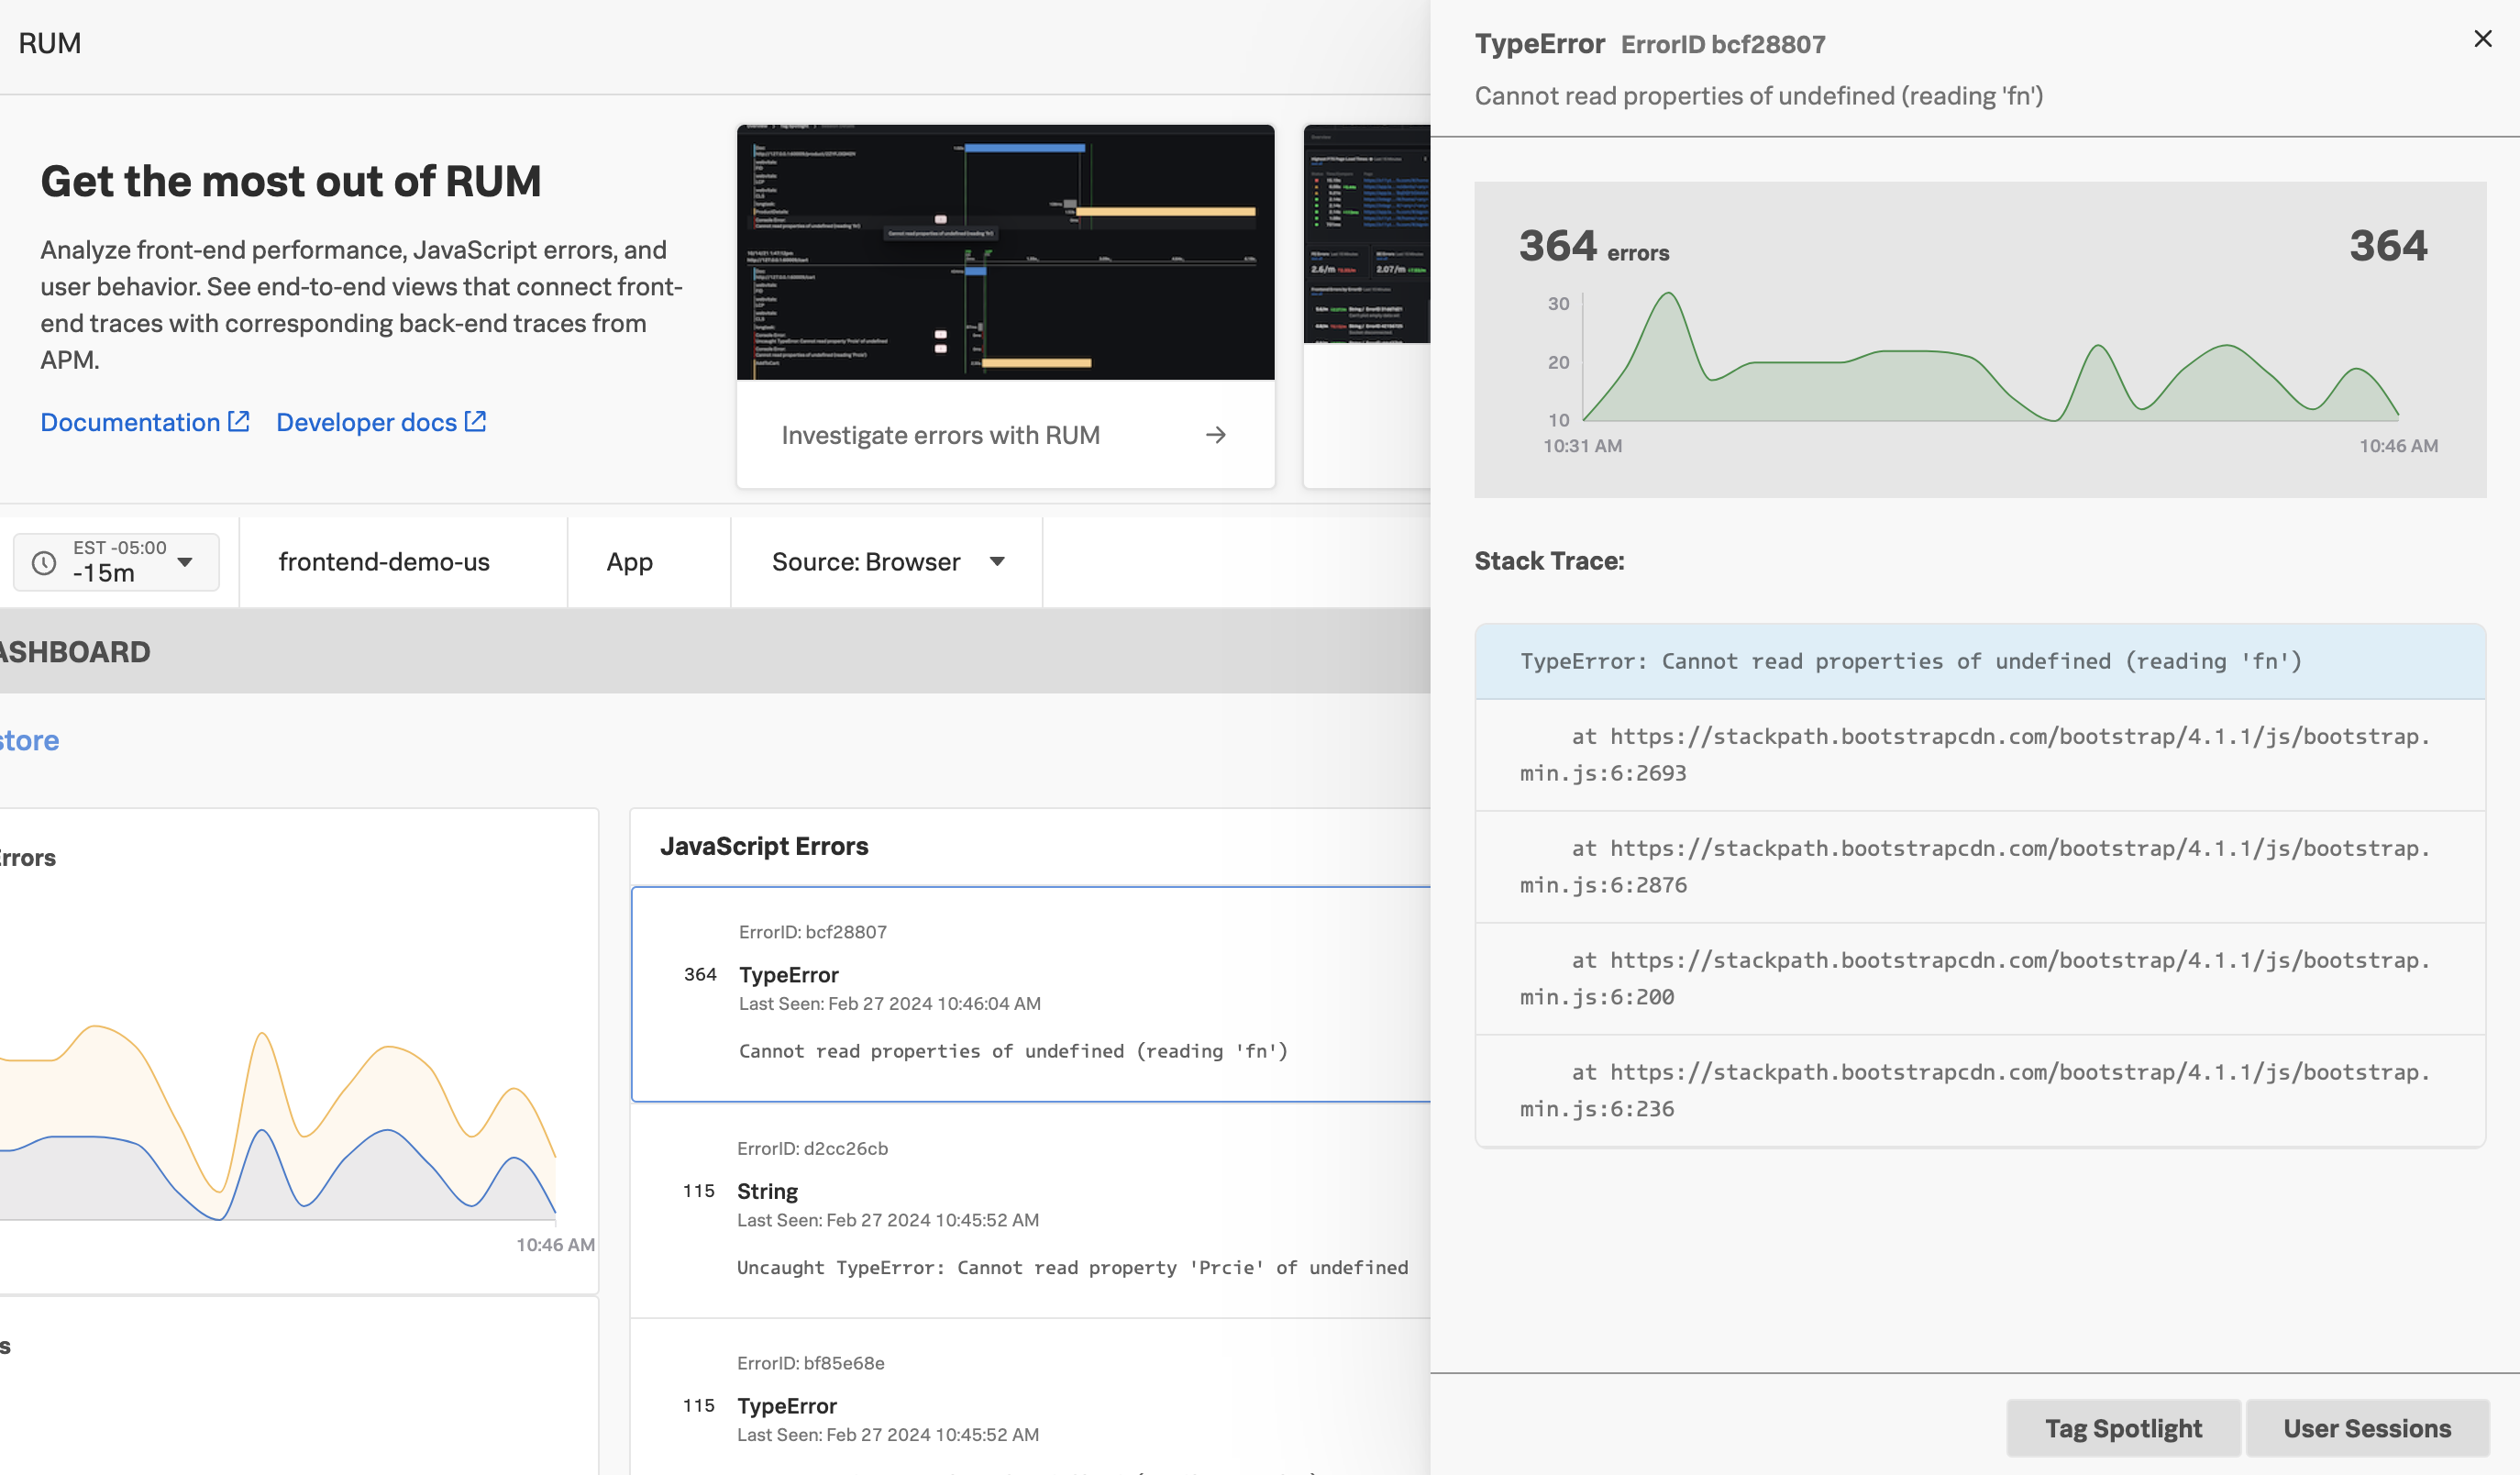
If you click on one of the errors a pop-out opens that will show a summary (below) of the errors over time, along with a Stack Trace of the JavaScript error, giving you an indication of where the problems occurred. (We will see this in more detail in one of the following sections)
4. Web Vitals
The next section of the RUM Application Summary Dashboard is showing you Google’s Core Web Vitals, three metrics that are not only used by Google in its search ranking system, but also quantify end user experience in terms of loading, interactivity, and visual stability.
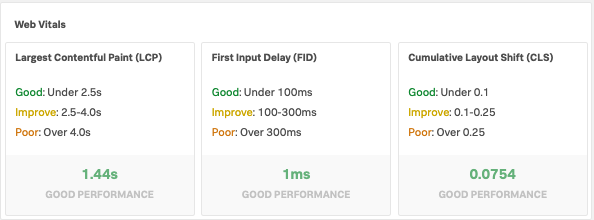
As you can see our site is well behaved and scores Good for all three Metrics. These metrics can be used to identify the effect changes to your application have, and help you improve the performance of your site.
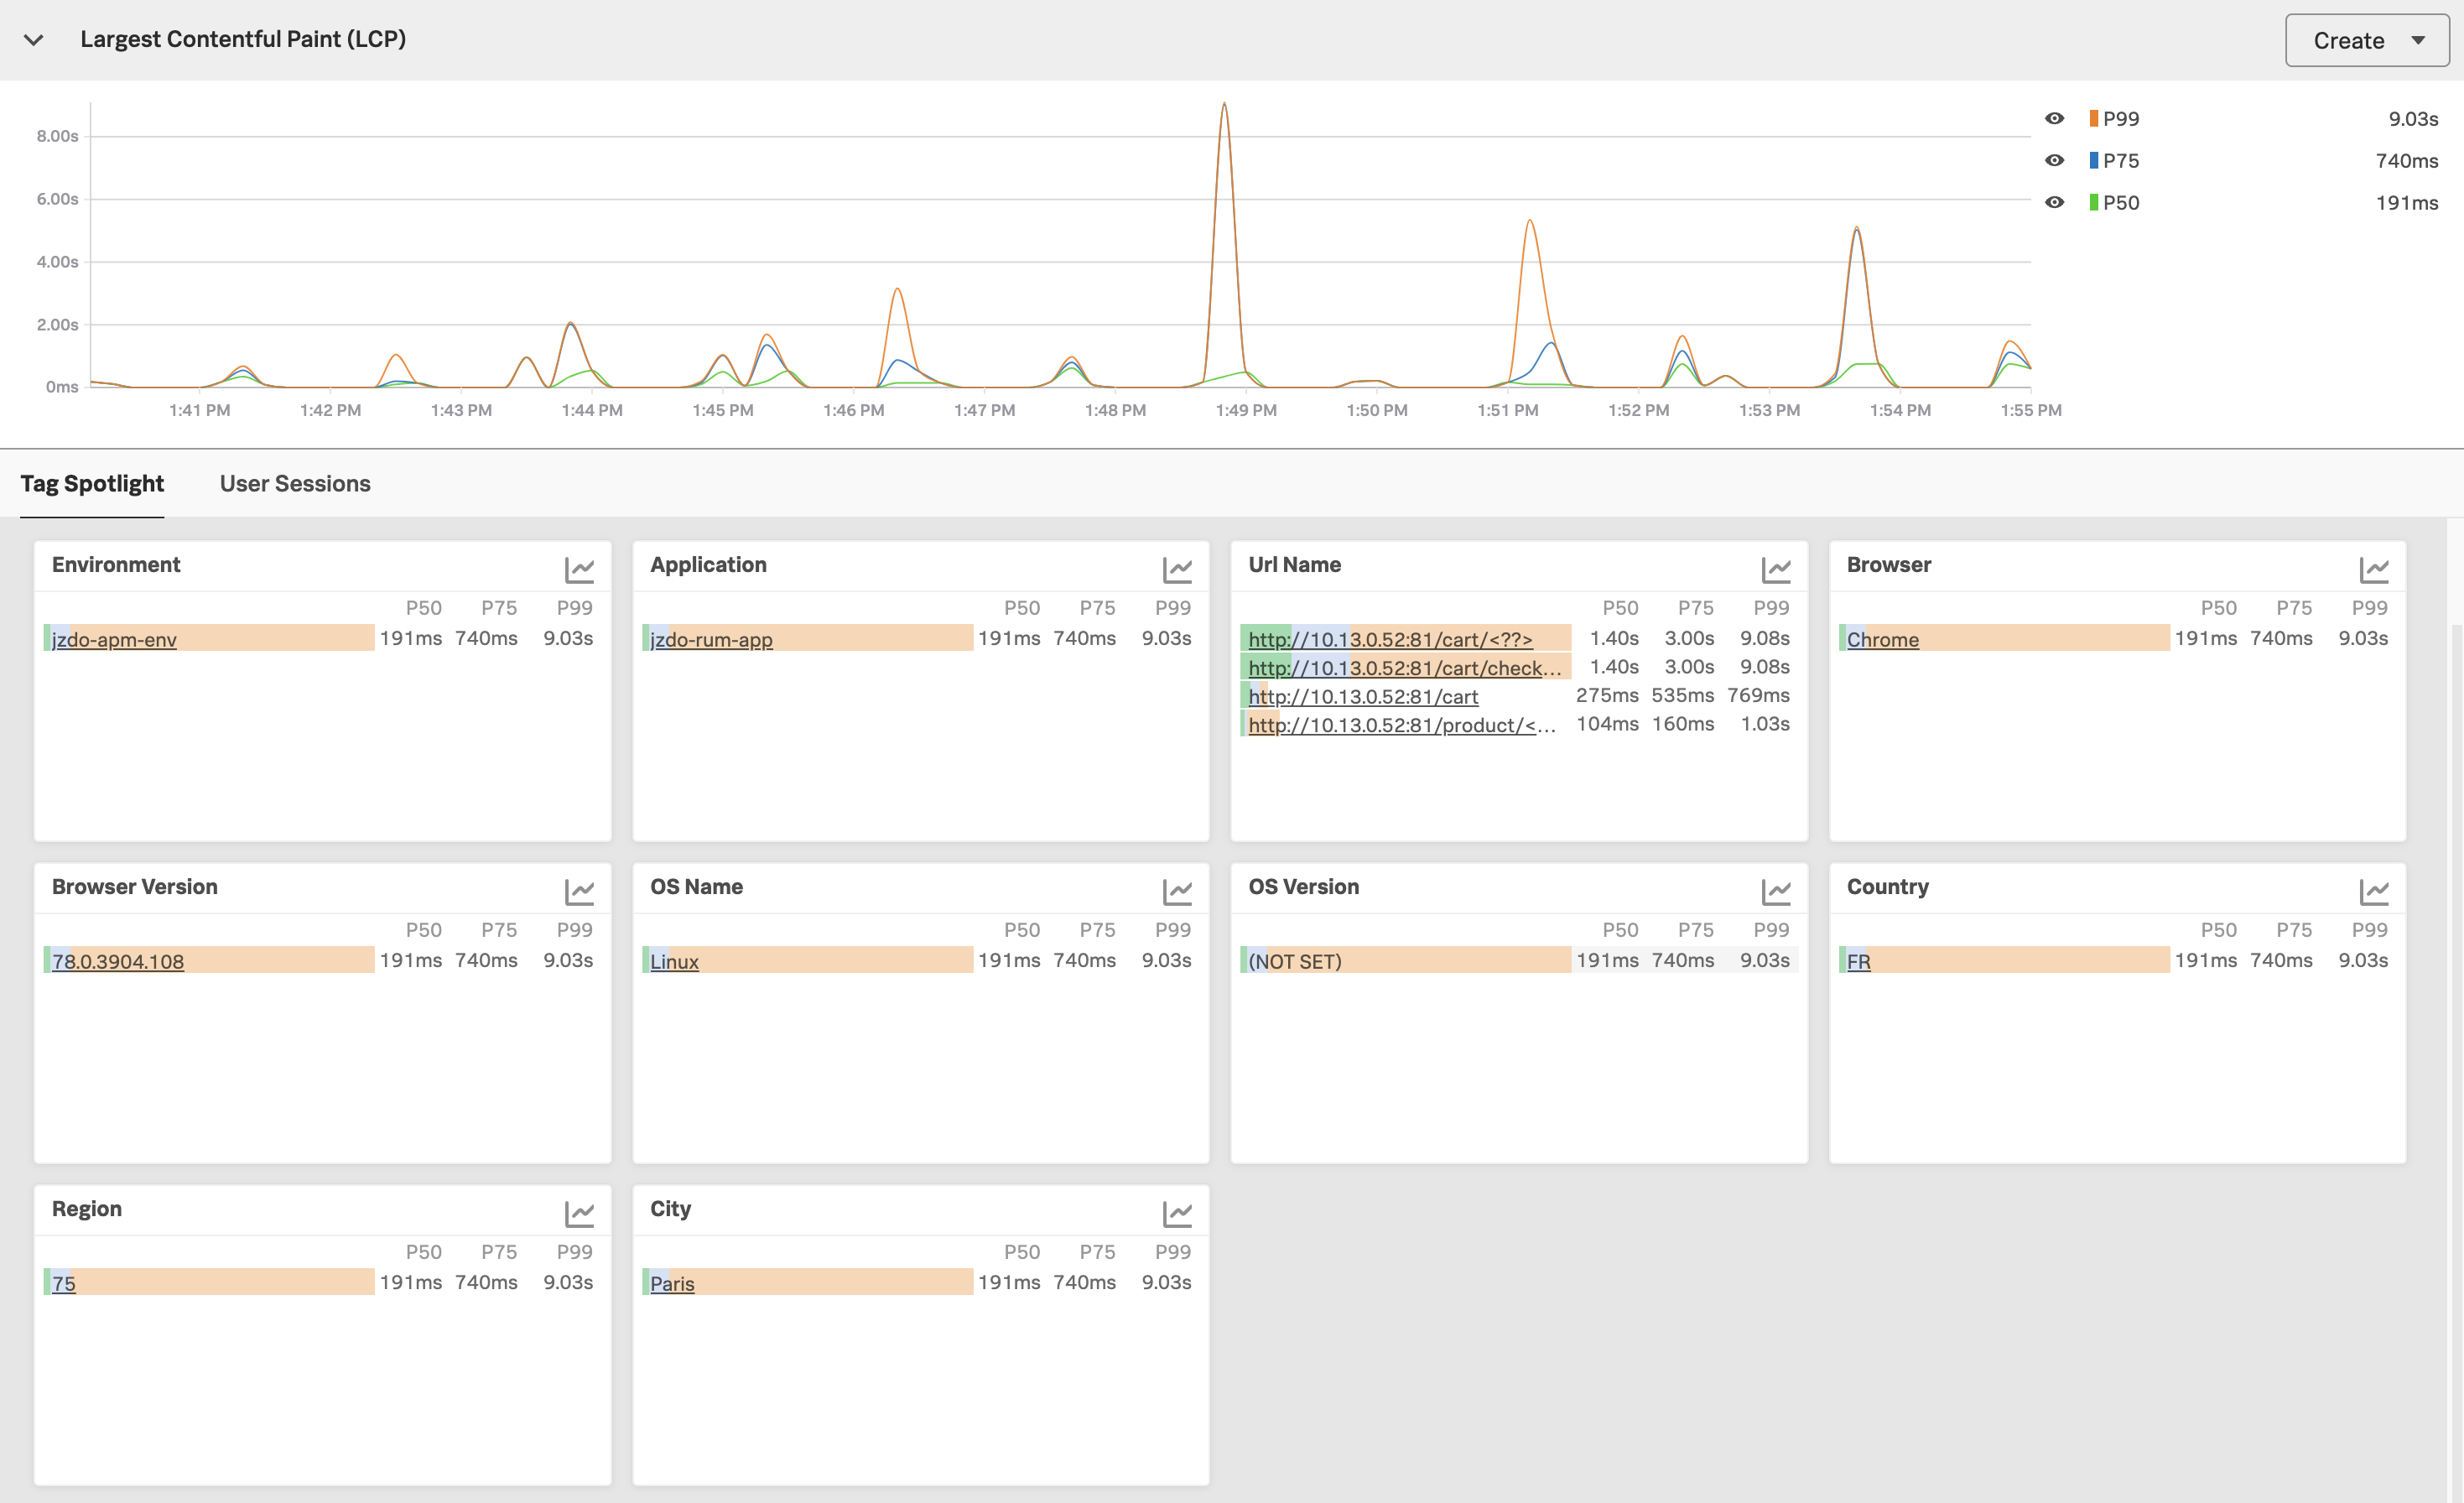
If you click on any of the Metrics shown in the Web Vitals pane you will be taken to the corresponding Tag Spotlight Dashboard. e.g. clicking on the Largest Contentful Paint (LCP) chartlet, you will be taken to a dashboard similar to the screen shot below, that gives you timeline and table views for how this metric has performed. This should allow you to spot trends and identify where the problem may be more common, such as an operating system, geolocation, or browser version.
5. Most Recent Detectors
The final section of the RUM Application Summary Dashboard is focused on providing you an overview of recent detectors that have triggered for your application. We have created a detector for this screen shot but your pane will be empty for now. We will add some detectors to your site and make sure they are triggered in one of the next sections.
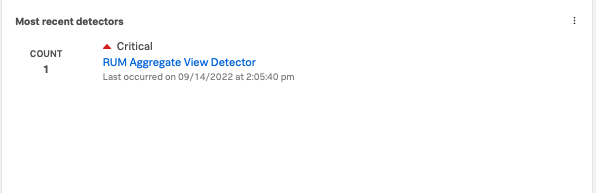
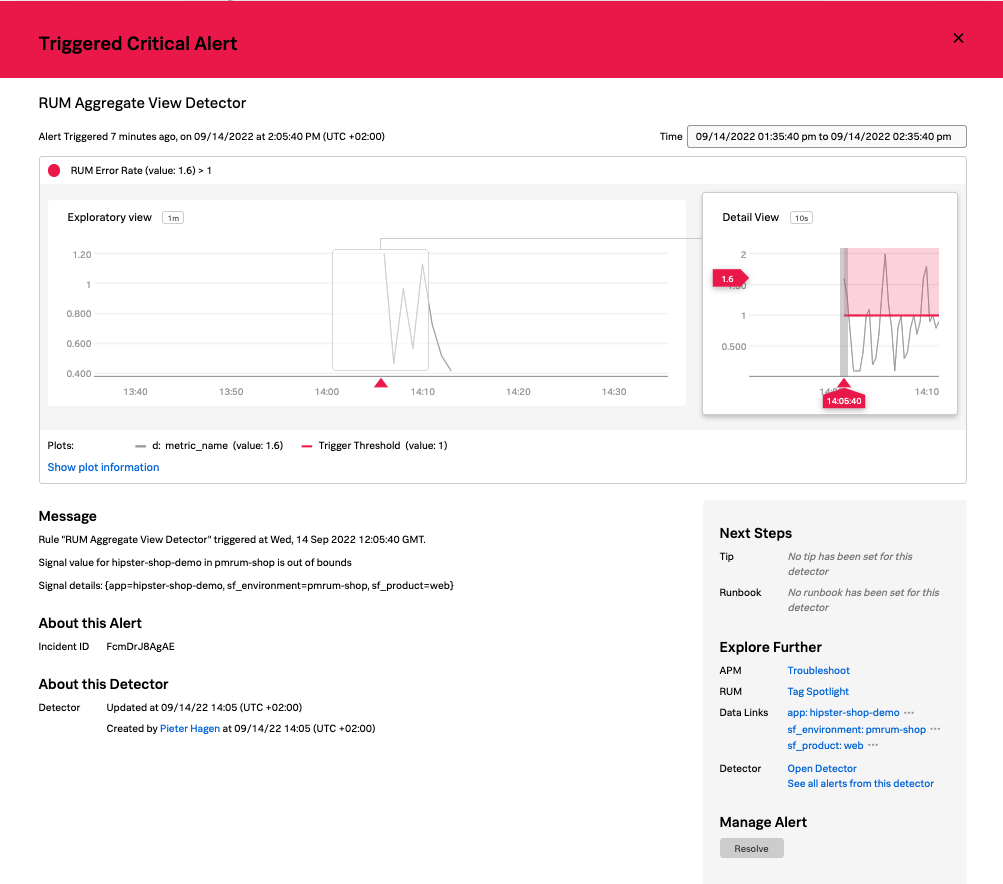
In the screen shot you can see we have a critical alert for the RUM Aggregated View Detector, and a Count, how often this alert has triggered in the selected time window. If you happen to have an alert listed, you can click on the name of the Alert (that is shown as a blue link) and you will be taken to the Alert Overview page showing the details of the alert (Note: this will move you away from the current page, Please use the Back option of your browser to return to the overview page).
Please take a few minutes to experiment with the RUM Application Summary Dashboard and the underlying chart and dashboards before going on to the next section.