Chart Detectors
With our custom dashboard charts, we can create detectors focussed directly on the data and conditions we care about. In building our charts, we also built signals that can trigger alerts.
Static detectors
For many KPIs, we have a static value in mind as a threshold.
In your custom End User Experience dashboard, go to the “LCP - all tests” chart.
Click the bell icon on the top right of the chart, and select “New detector from chart”

Change the detector name to include your team name and initials, and adjust the alert details. Change the threshold to 2500 or 4000 and see how the alert noise preview changes.

Change the severity, and add yourself as a recipient before you save this detector. Click Activate.

Advanced: Dynamic detectors
Sometimes we have metrics that vary naturally, so we want to create a more dynamic detector that isn’t limited by the static threshold we decide in the moment.
To create dynamic detectors on your chart, click the link to the “old” detector wizard.

Change the detector name to include your team name and initials, and Click Create alert rule

Confirm the signal looks correct and proceed to Alert condition.

Select the “Sudden Change” condition and proceed to Alert settings

Play with the settings and see how the estimated alert noise is previewed in the chart above. Tune the settings, and change the advanced settings if you’d like, before proceeding to the Alert message.

Customize the severity, runbook URL, any tips, and message payload before proceeding to add recipients.
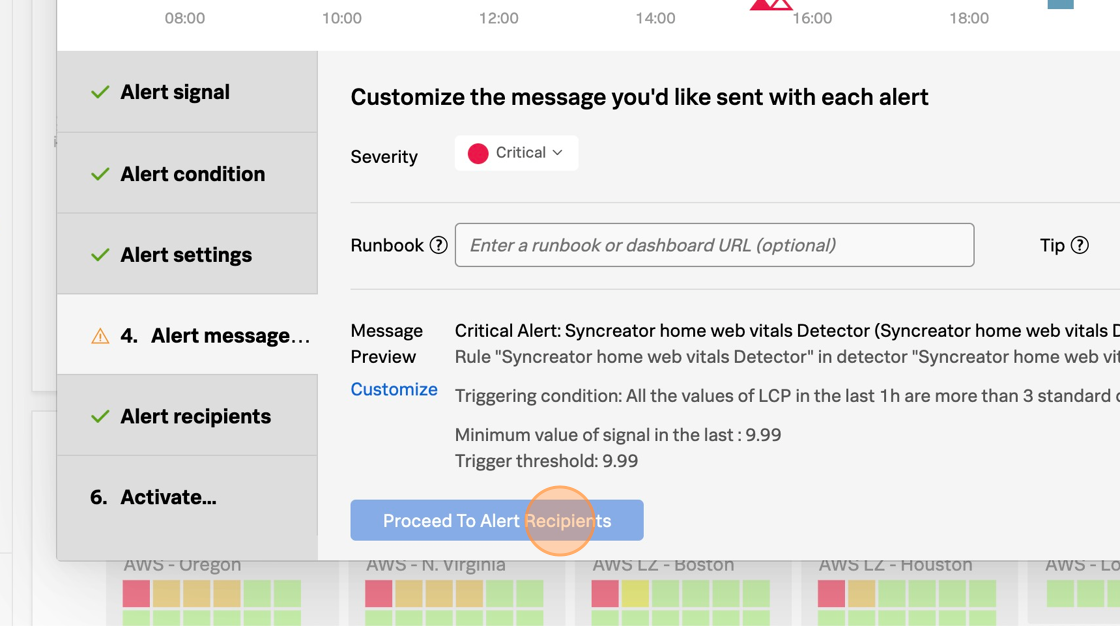
For the sake of this workshop, only add your own email address as recipient. This is where you would add other options like webhooks, ticketing systems, and Slack channels if it’s in your real environment.

Finally, confirm the detector name before clicking Activate Alert Rule
