Optimize End User Experiences
90 minutes Author Sarah WareHow can we use Splunk Observability to get insight into end user experience, and proactively test scenarios to improve that experience?
Sections:
- Set up basic Synthetic tests to understand availability and performance ASAP
- Uptime test
- API test
- Single page Browser test
- Explore RUM to understand our real users
- Write advanced Synthetics tests based on what we’ve learned about our users and what we need them to do
- Customize dashboard charts to capture our KPIs, show trends, and show data in context of our events
- Create Detectors to alert on our KPIs
Tip
Keep in mind throughout the workshop: how can I prioritize activities strategically to get the fastest time to value for my end users and for myself/ my developers?
Context
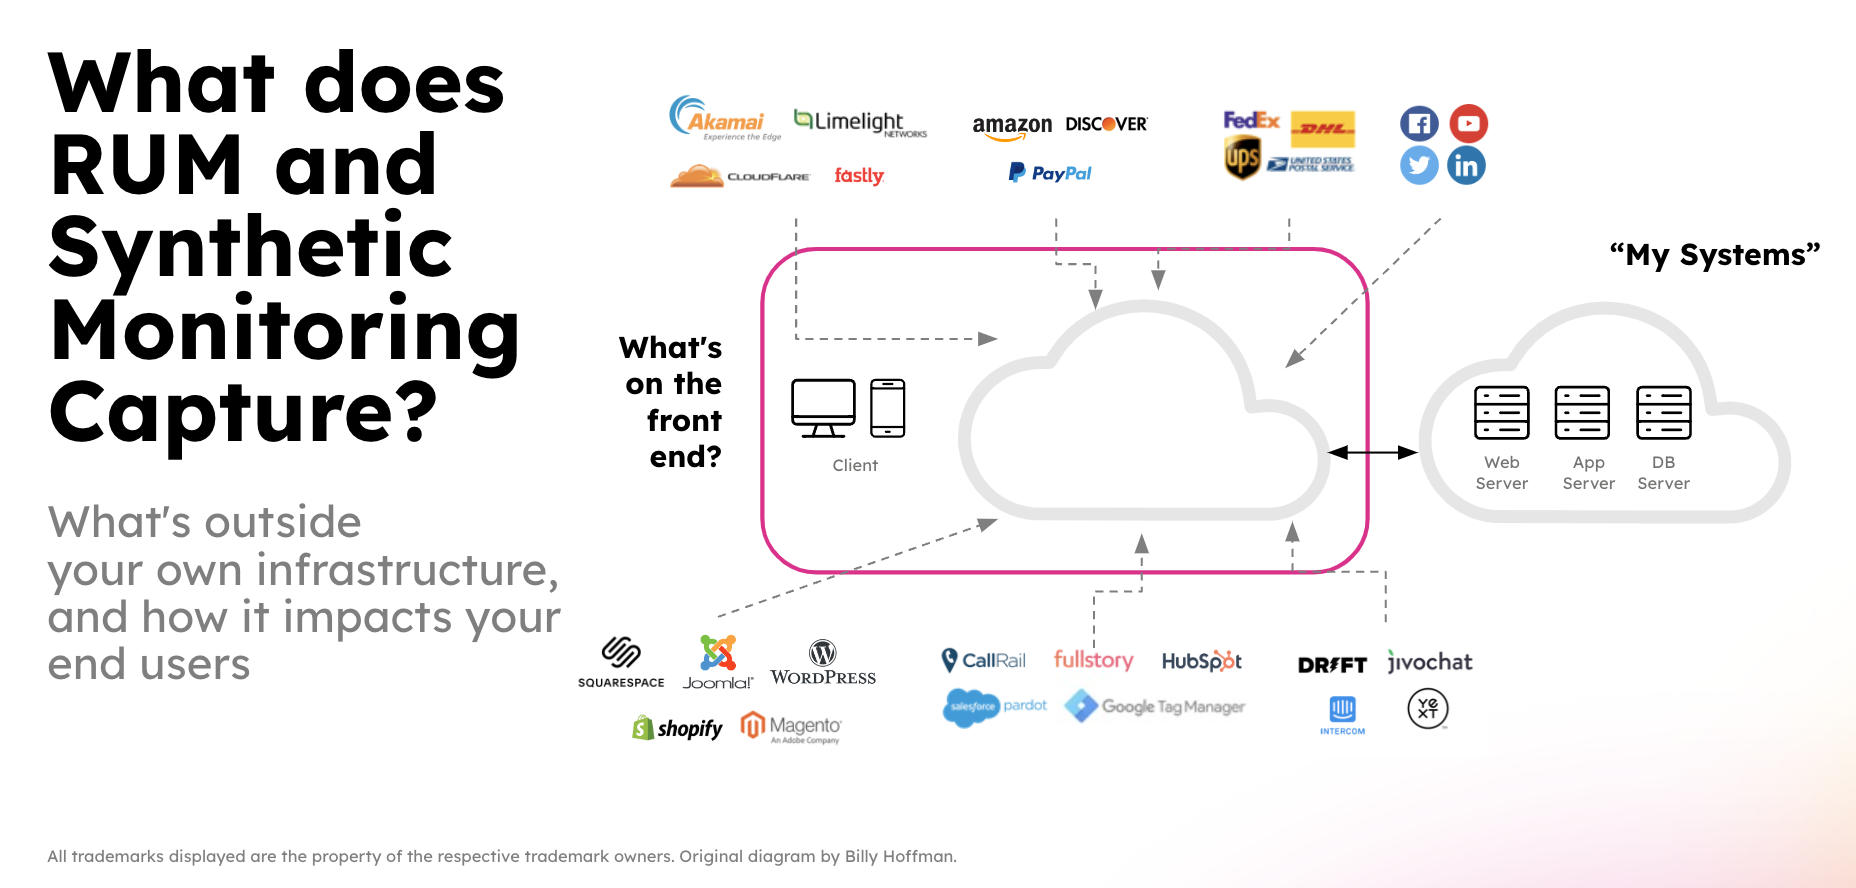
As a reminder, we need frontend performance monitoring to capture everything that goes into our end user experience. If we’re just monitoring the backend, we’re missing all of the other resources that are critical to our users’ success. Read What the Fastly Outage Can Teach Us About Observability for a real world example. Click the image below to zoom in.
References
Throughout this workshop, we will see references to resources to help further understand end user experience and how to optimize it. In addition to Splunk Docs for supported features and Lantern for tips and tricks, Google’s web.dev and Mozilla are great resources.
Remember that the specific libraries, platforms, and CDNs you use often also have their own specific resources. For example React, Wordpress, and Cloudflare all have their own tips to improve performance.