Getting Started
3 minutes Author Tim HardDuring this technical Optimize Cloud Monitoring Workshop, you will build out an environment based on a lightweight Kubernetes1 cluster.
To simplify the workshop modules, a pre-configured AWS/EC2 instance is provided.
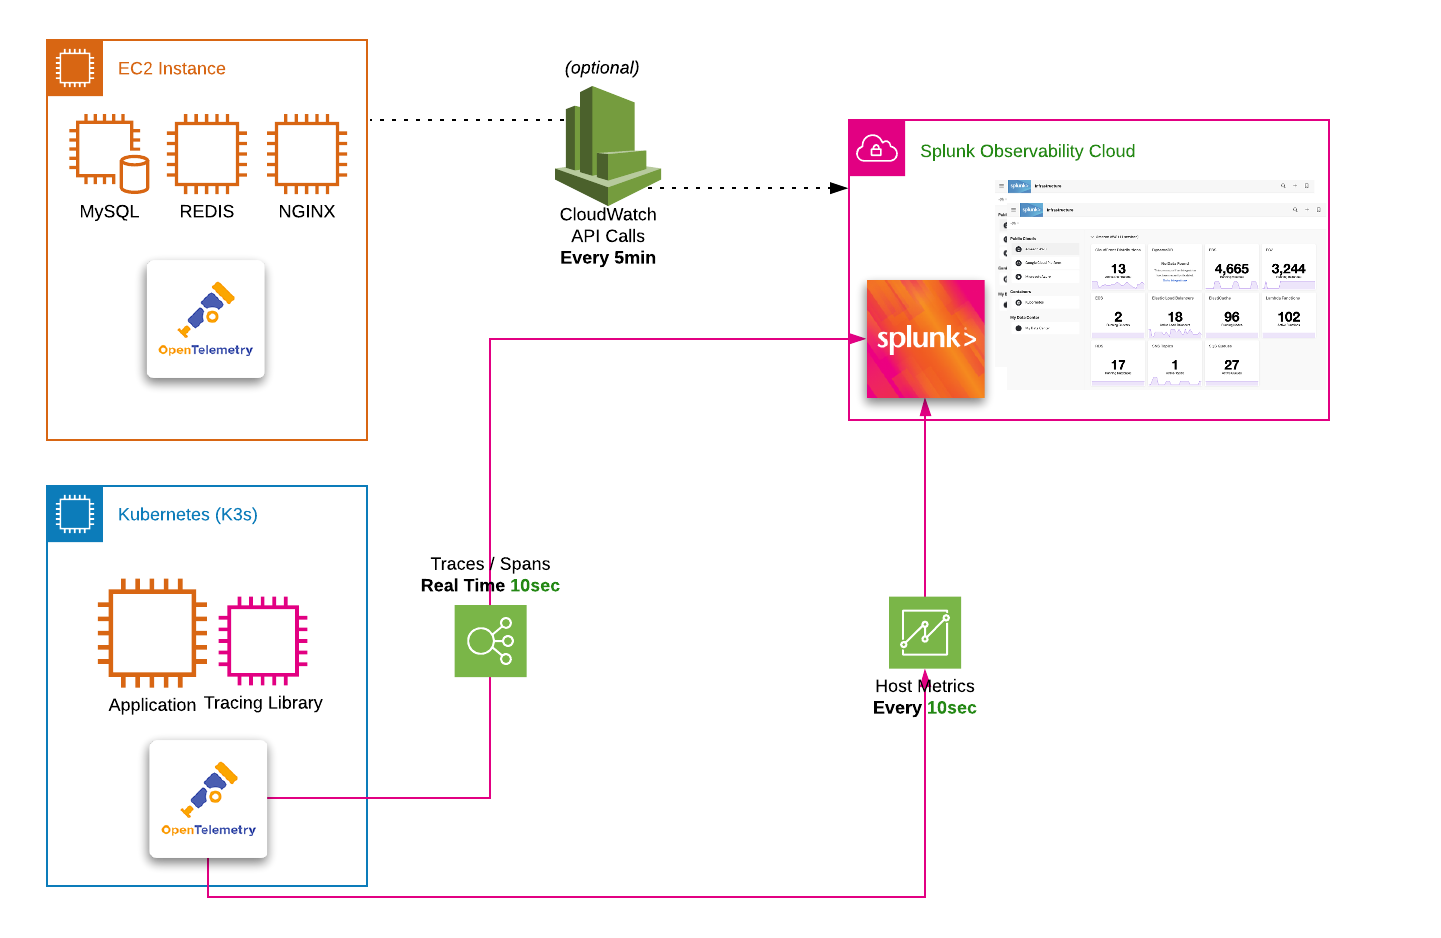
The instance is pre-configured with all the software required to deploy the Splunk OpenTelemetry Connector2 and the microservices-based OpenTelemetry Demo Application3 in Kubernetes which has been instrumented using OpenTelemetry to send metrics, traces, spans and logs.
This workshop will introduce you to the benefits of standardized data collection, how content can be re-used across teams, correlating metrics and logs, and creating detectors to fire alerts. By the end of these technical workshops, you will have a good understanding of some of the key features and capabilities of the Splunk Observability Cloud.
Here are the instructions on how to access your pre-configured AWS/EC2 instance
Kubernetes is a portable, extensible, open-source platform for managing containerized workloads and services, that facilitates both declarative configuration and automation. ↩︎
OpenTelemetry Collector offers a vendor-agnostic implementation on how to receive, process and export telemetry data. In addition, it removes the need to run, operate and maintain multiple agents/collectors to support open-source telemetry data formats (e.g. Jaeger, Prometheus, etc.) sending to multiple open-source or commercial back-ends. ↩︎
The OpenTelemetry Demo Application is a microservice-based distributed system intended to illustrate the implementation of OpenTelemetry in a near real-world environment. ↩︎