Infrastrcuture Navigators
5 minutes Author Tim HardSplunk Infrastructure Monitoring (IM) is a market-leading monitoring and observability service for hybrid cloud environments. Built on a patented streaming architecture, it provides a real-time solution for engineering teams to visualize and analyze performance across infrastructure, services, and applications in a fraction of the time and with greater accuracy than traditional solutions.
300+ Easy-to-use OOTB content: Pre-built navigators and dashboards, deliver immediate visualizations of your entire environment so that you can interact with all your data in real time.
Kubernetes navigator: Provides an instant, comprehensive out-of-the-box hierarchical view of nodes, pods, and containers. Ramp up even the most novice Kubernetes user with easy-to-understand interactive cluster maps.
AutoDetect alerts and detectors: Automatically identify the most important metrics, out-of-the-box, to create alert conditions for detectors that accurately alert from the moment telemetry data is ingested and use real-time alerting capabilities for important notifications in seconds.
Log views in dashboards: Combine log messages and real-time metrics on one page with common filters and time controls for faster in-context troubleshooting.
Metrics pipeline management: Control metrics volume at the point of ingest without re-instrumentation with a set of aggregation and data-dropping rules to store and analyze only the needed data. Reduce metrics volume and optimize observability spend.
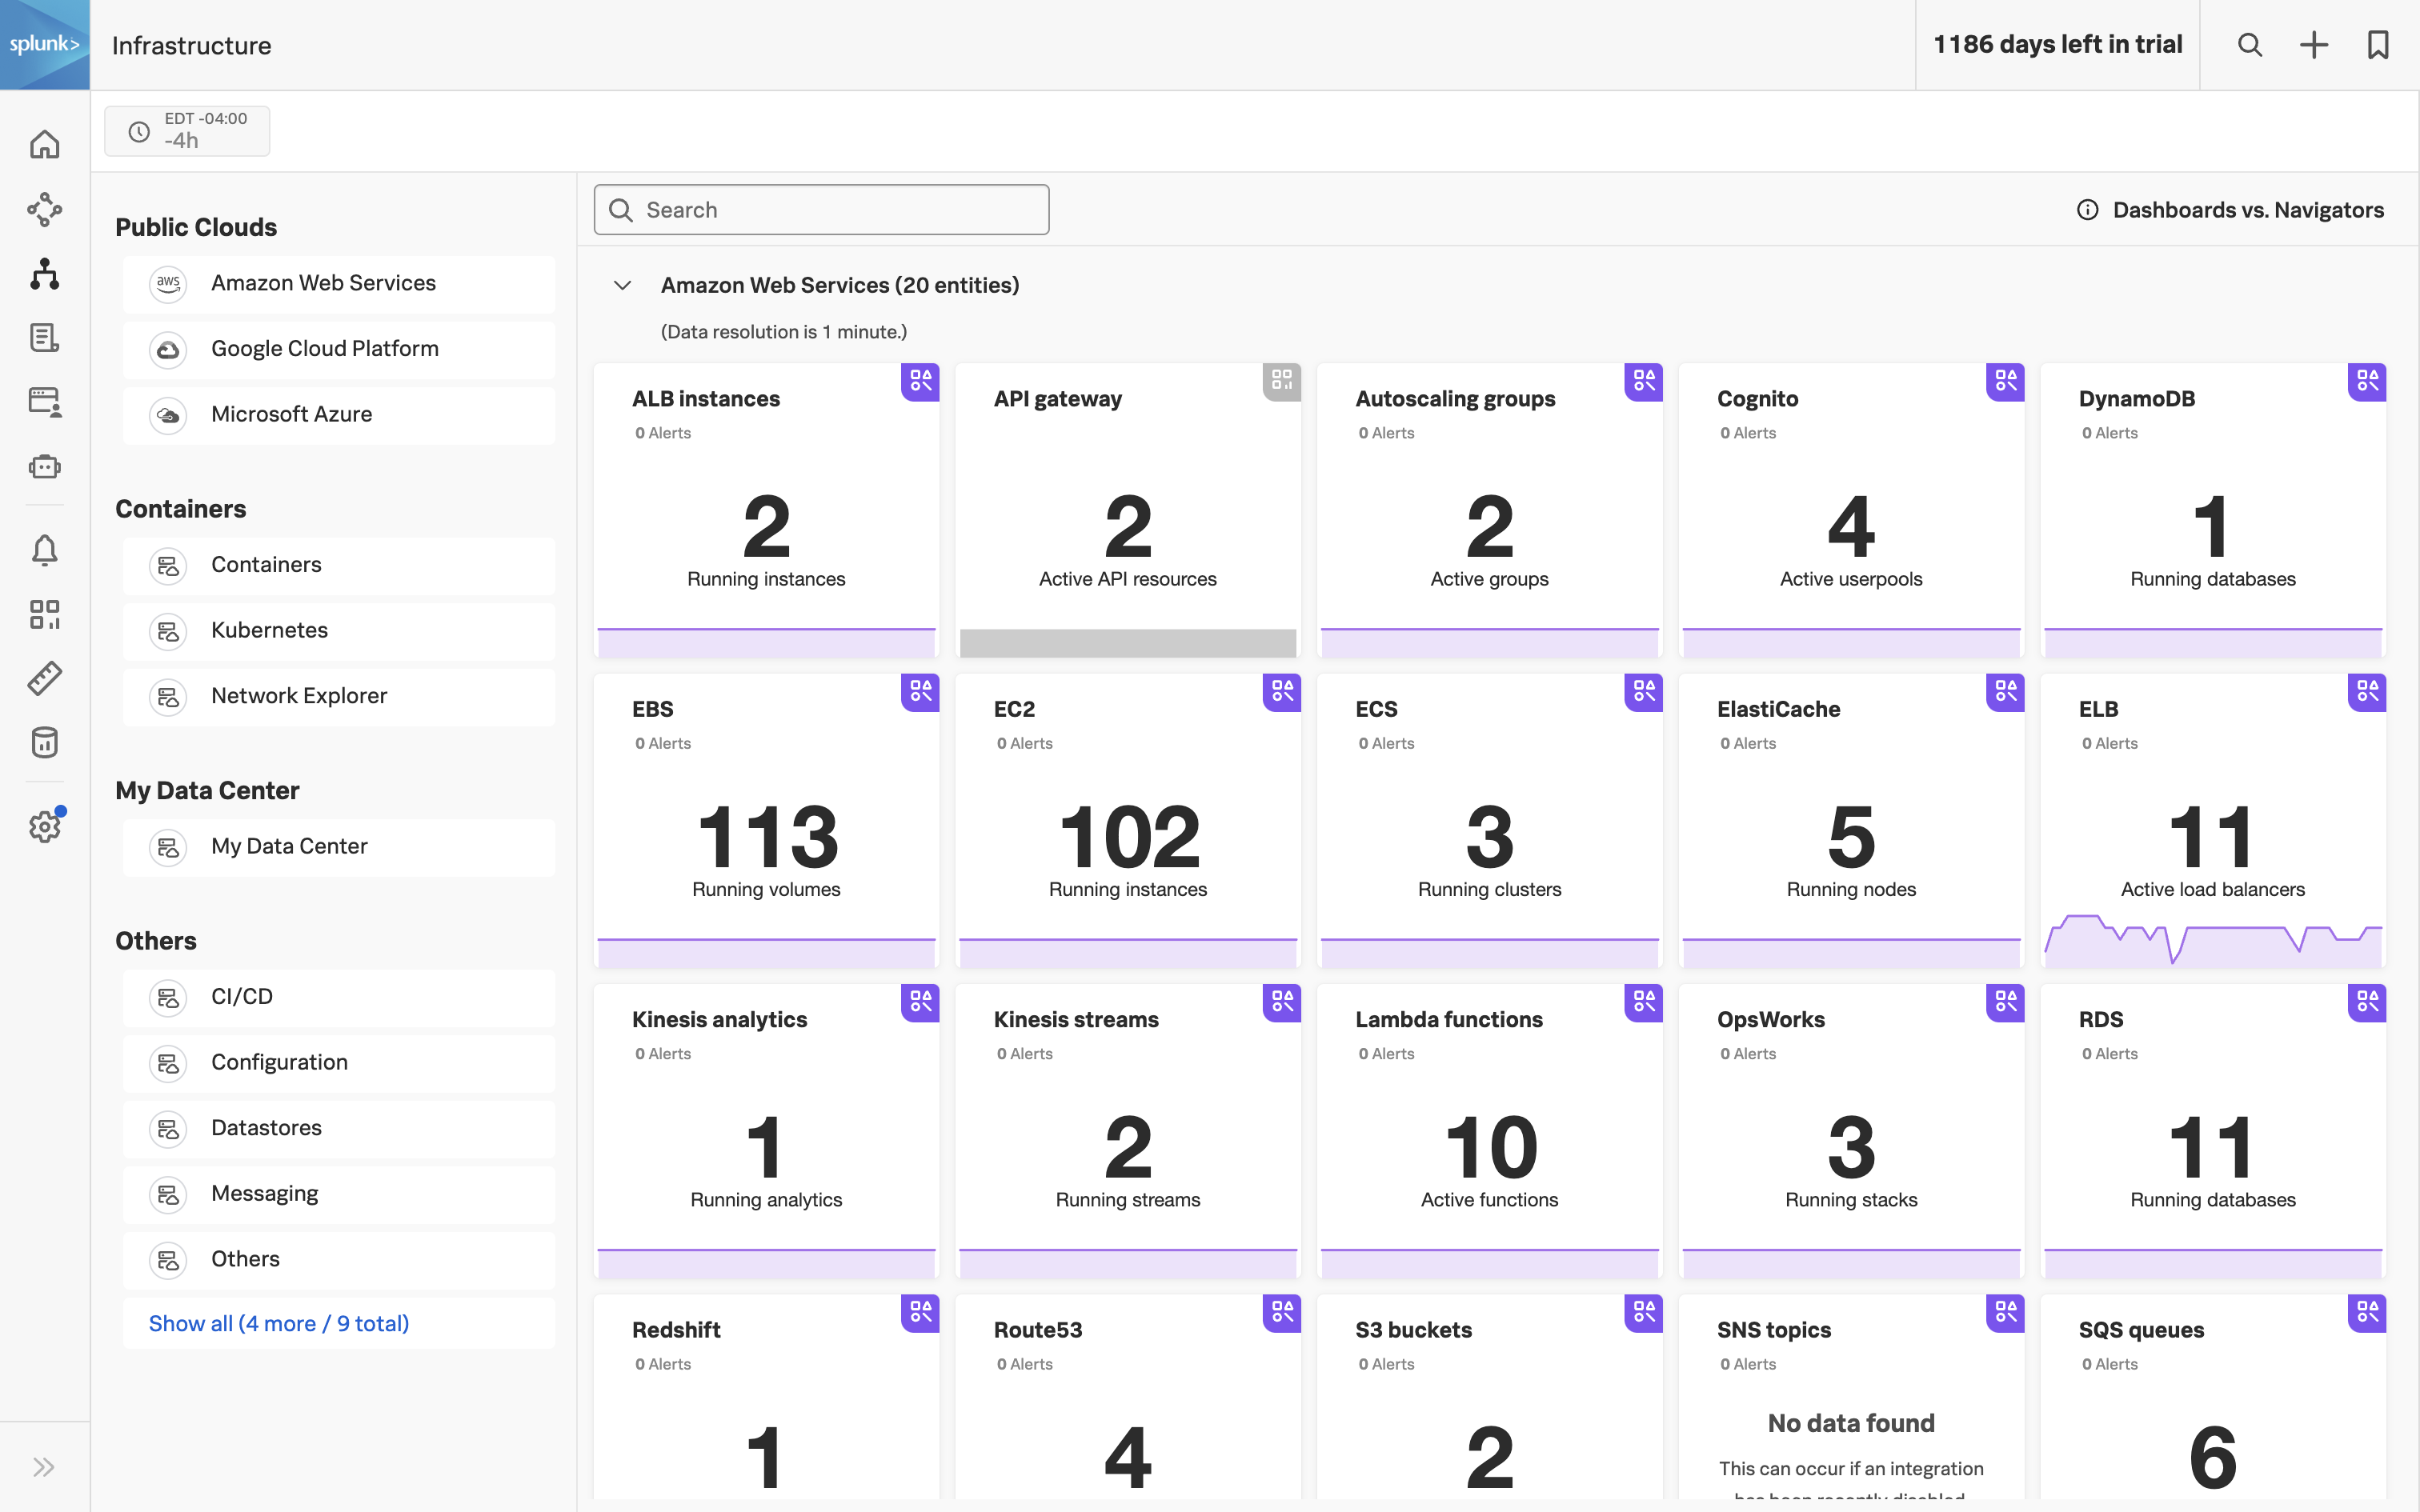
- From the Splunk Observability Cloud homepage, click the
 button -> Kubernetes -> K8s nodes
 - First, use the
 option to pick your cluster.
 - From the filter drop-down box, use the
store.locationvalue you entered when deploying the application. - You then can start typing the city you used which should also appear in the drop-down values. Select yours and make sure just the one for your workshop is highlighted with a
 .
. - Click the Apply Filter button to focus on our Cluster.
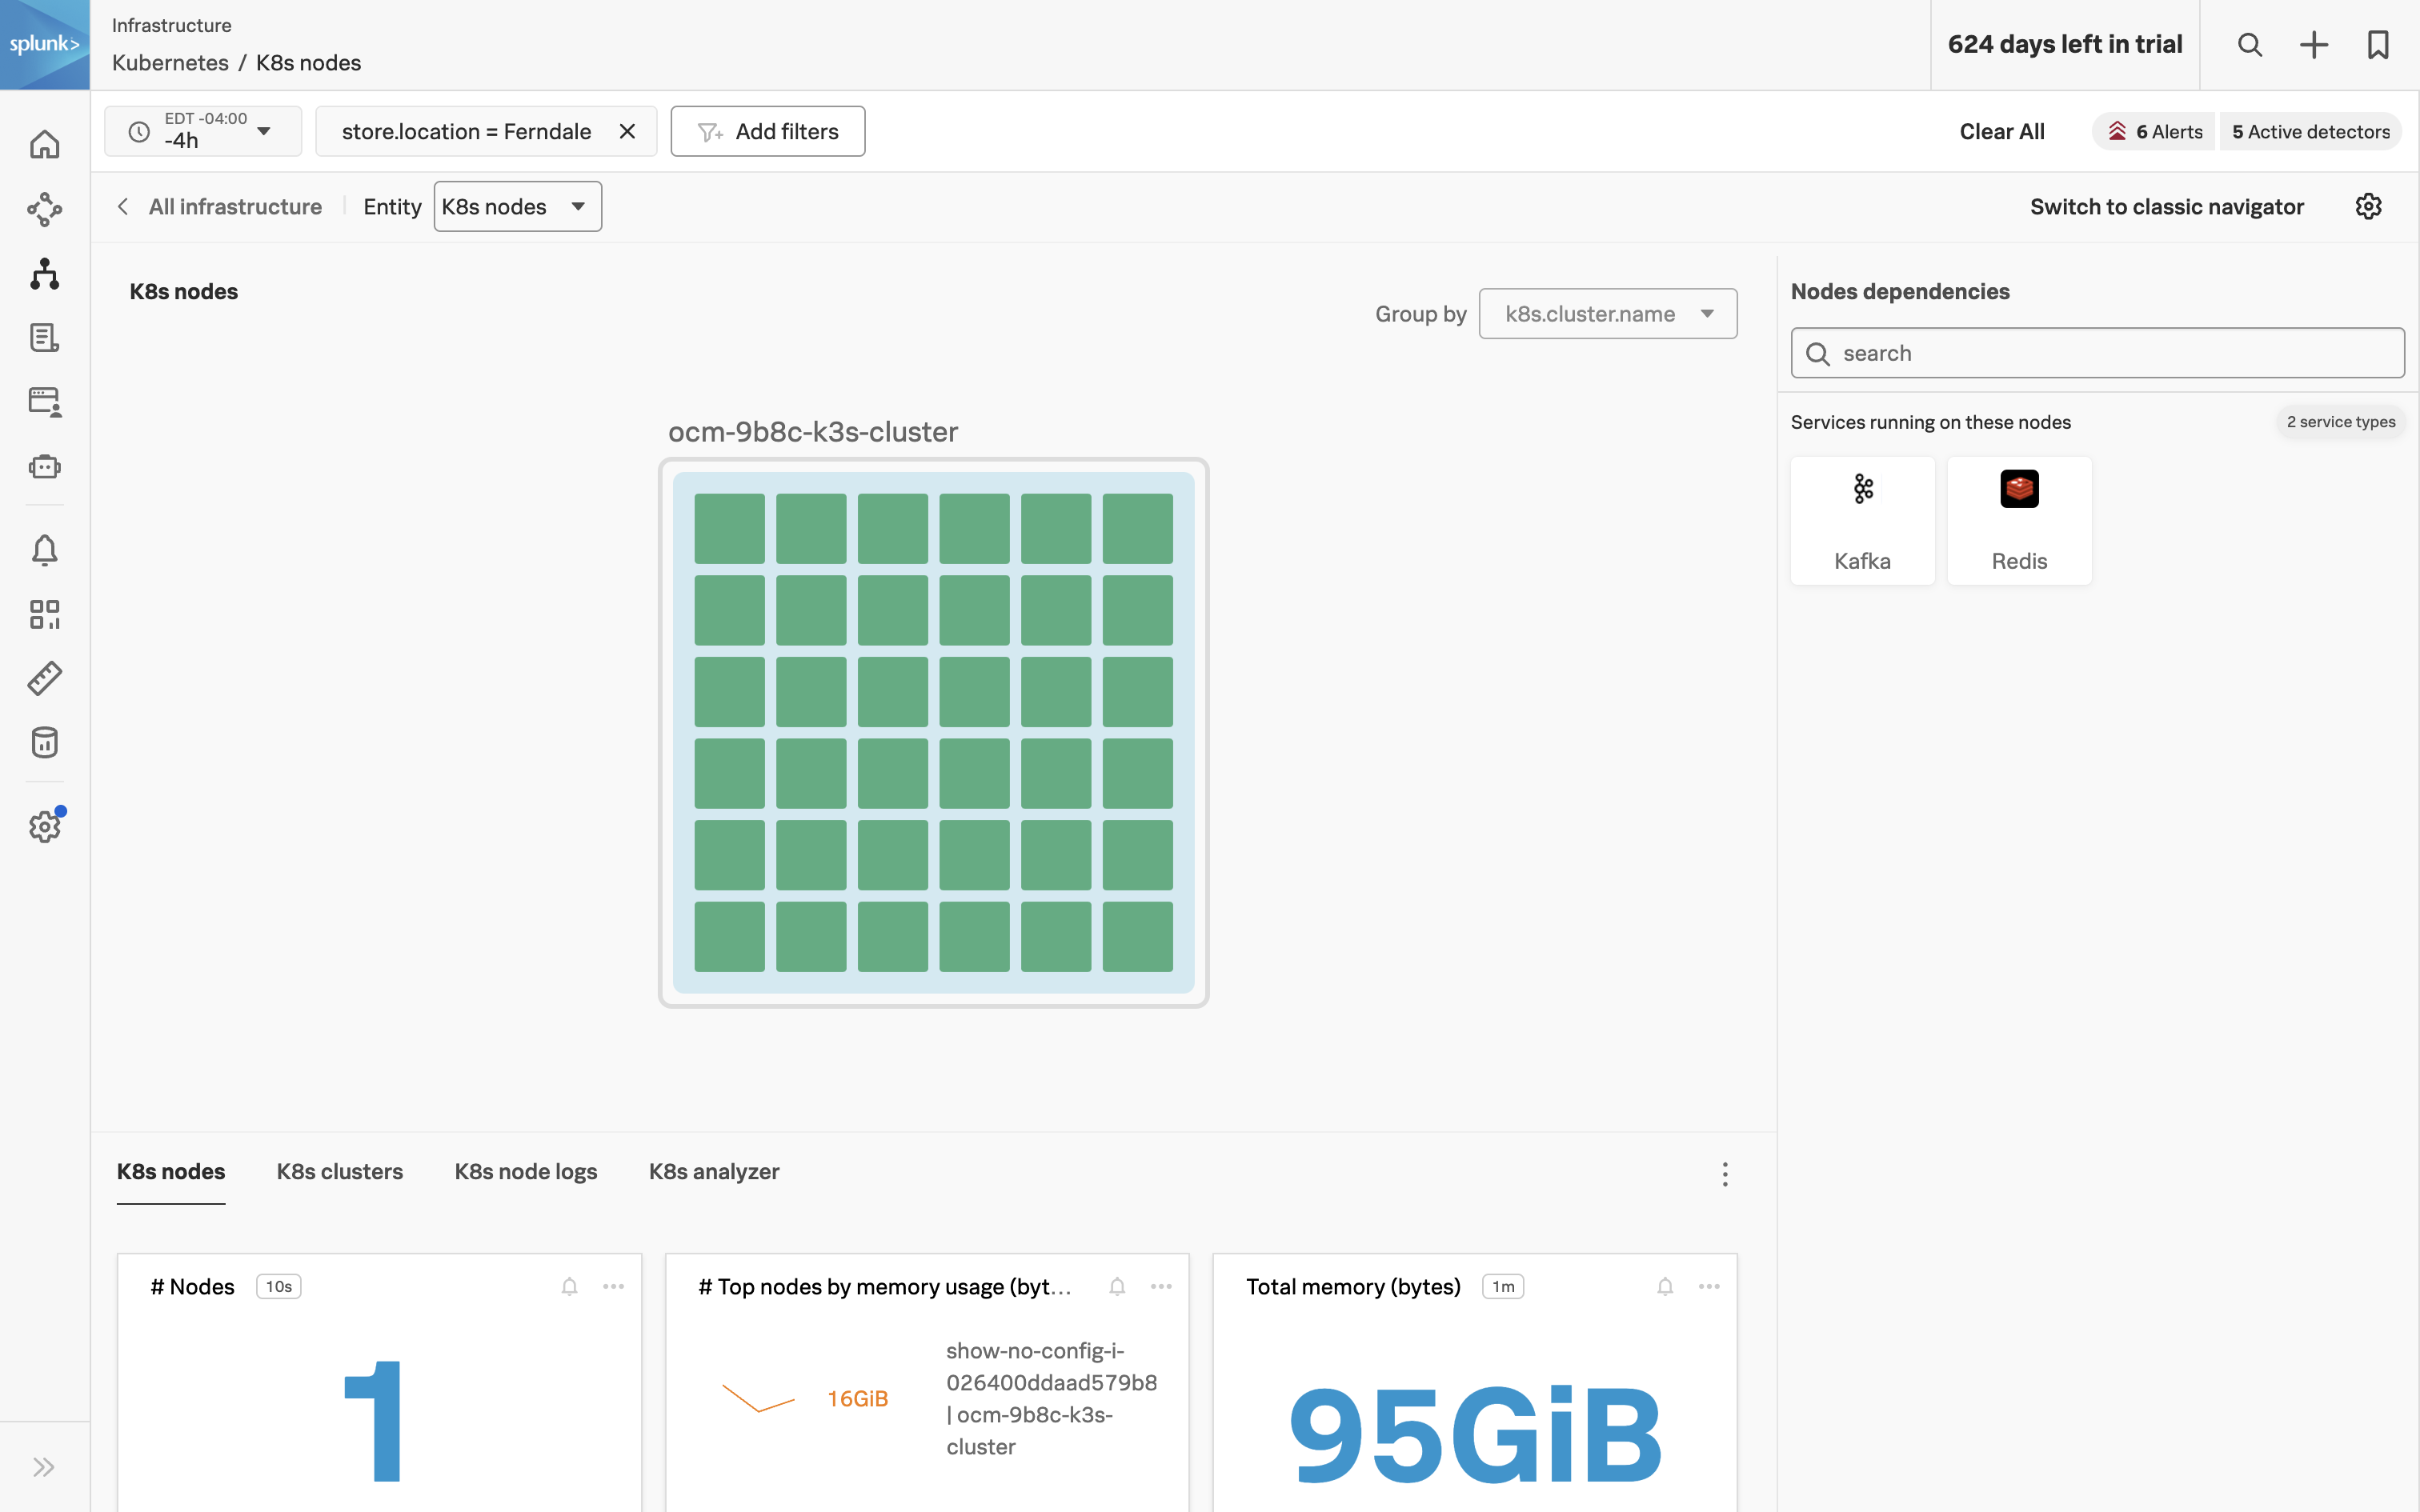
- You should now have your Kubernetes Cluster visible
- Here we can see all of the different components of the cluster (Nodes, Pods, etc), each of which has relevant metrics associated with it. On the right side, you can also see what services are running in the cluster.
Before moving to the next section, take some time to explore the Kubernetes Navigator to see the data that is available Out of the Box.