Dashboard Cloning
5 minutes Author Tim HardITOps teams responsible for monitoring fleets of infrastructure frequently find themselves manually creating dashboards to visualize and analyze metrics, traces, and log data emanating from rapidly changing cloud-native workloads hosted in Kubernetes and serverless architectures, alongside existing on-premises systems. Moreover, due to the absence of a standardized troubleshooting workflow, teams often resort to creating numerous custom dashboards, each resembling the other in structure and content. As a result, administrative overhead skyrockets and MTTR slows.
To address this, you can use the out-of-the-box dashboards available in Splunk Observability Cloud for each and every integration. These dashboards are filterable and can be used for ad hoc troubleshooting or as a templated approach to getting users the information they need without having to start from scratch. Not only do the out-of-the-box dashboards provide rich visibility into the infrastructure that is being monitored they can also be cloned.
- In Splunk Observability Cloud, click the Global Search
 button. (Global Search can be used to quickly find content)
 - Search for Pods and select K8s pods (Kubernetes)

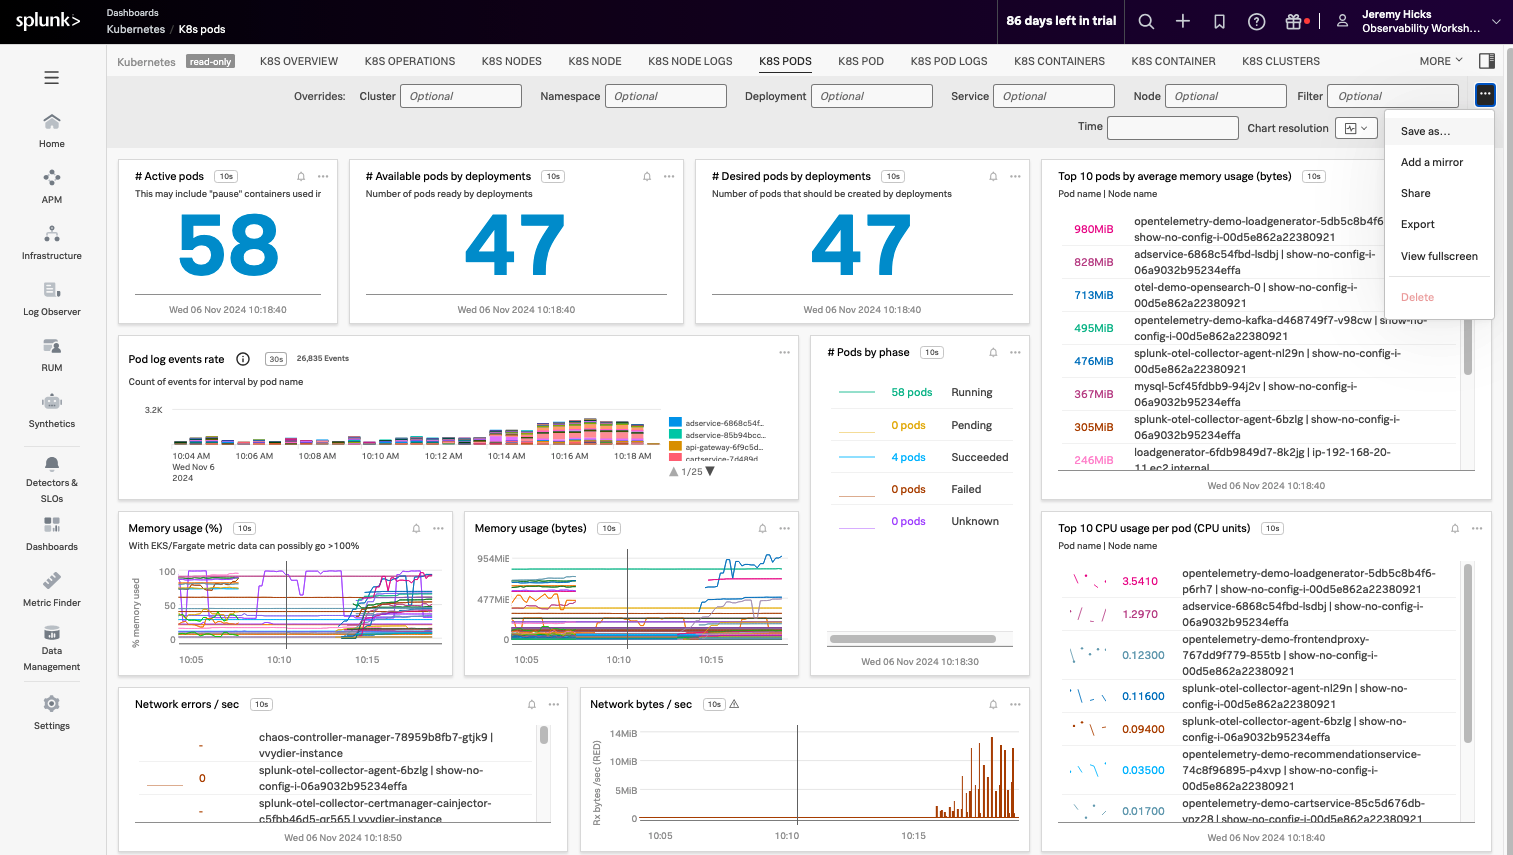
- This will take you to the out-of-the-box Kubernetes Pods dashboard which we will use as a template for mirroring dashboards.
- In the upper right corner of the dashboard click the Dashboard actions button (3 horizontal dots) -> Click Save As…
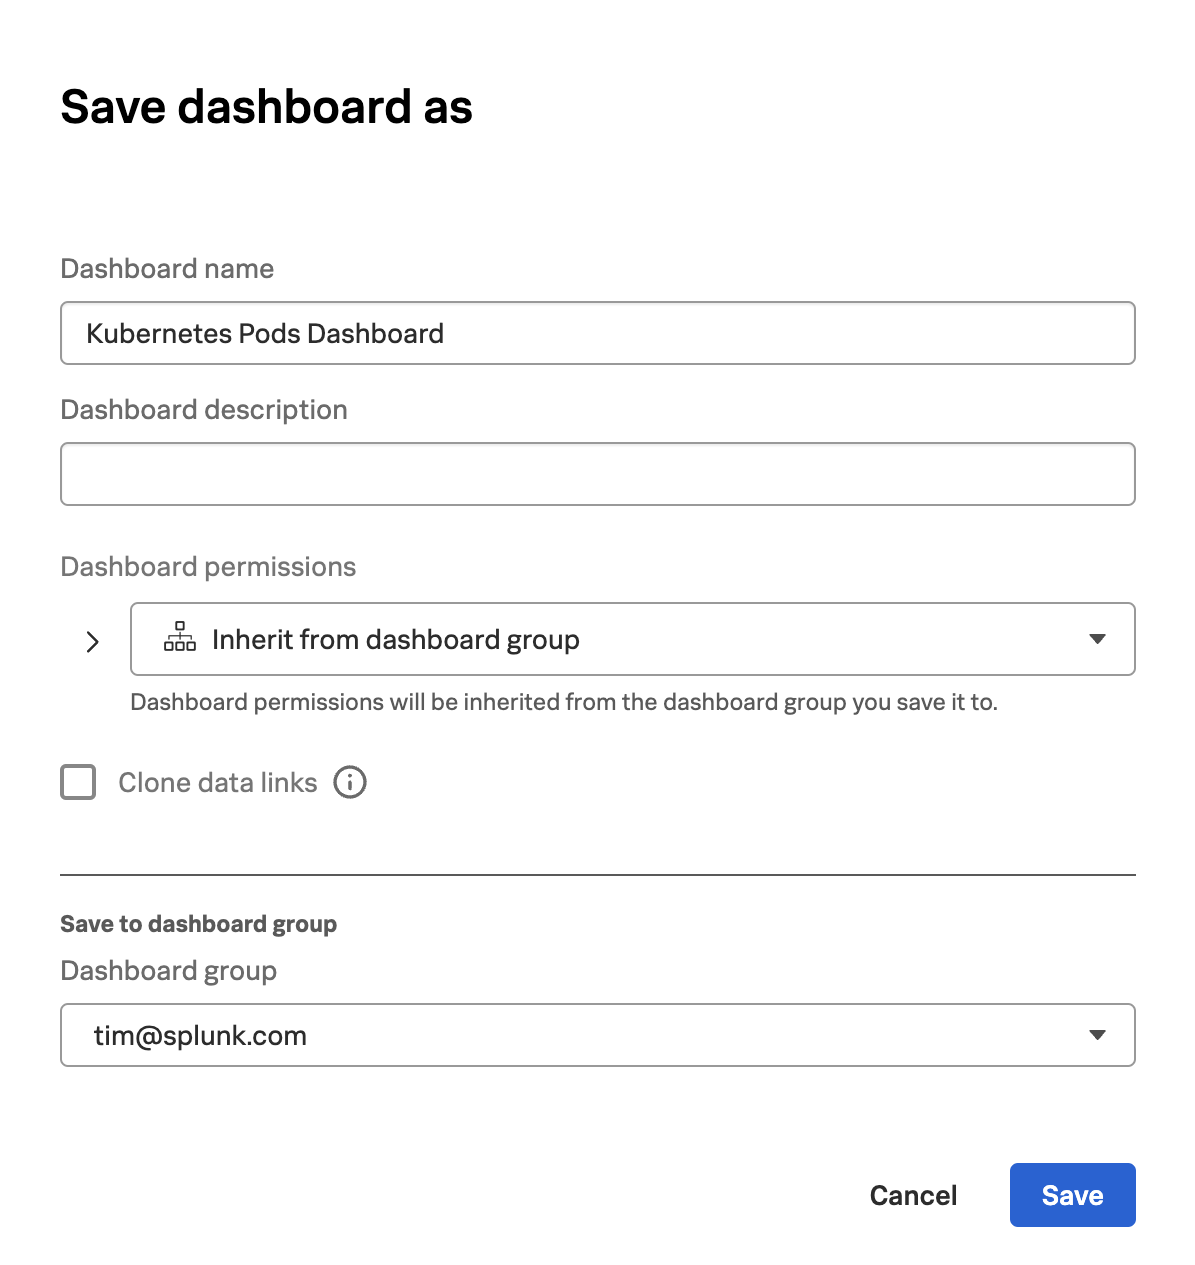
- Enter a dashboard name (i.e. Kubernetes Pods Dashboard)
- Under Dashboard group search for your e-mail address and select it.
- Click Save
Note: Every Observability Cloud user who has set a password and logged in at least once, gets a user dashboard group and user dashboard. Your user dashboard group is your individual workspace within Observability Cloud.
After saving, you will be taken to the newly created dashboard in the Dashboard Group for your user. This is an example of cloning an out-of-the-box dashboard which can be further customized and enables users to quickly build role, application, or environment relevant views.
Custom dashboards are meant to be used by multiple people and usually represent a curated set of charts that you want to make accessible to a broad cross-section of your organization. They are typically organized by service, team, or environment.