Correlate Metrics and Logs
5 minutes Author Tim HardIn this section, we’ll dive into the seamless correlation of metrics and logs facilitated by the robust naming standards offered by OpenTelemetry. By harnessing the power of OpenTelemetry within Splunk Observability Cloud, we’ll demonstrate how troubleshooting issues becomes significantly more efficient for Site Reliability Engineers (SREs) and operators. With this integration, contextualizing data across various telemetry sources no longer demands manual effort to correlate information. Instead, SREs and operators gain immediate access to the pertinent context they need, allowing them to swiftly pinpoint and resolve issues, improving system reliability and performance.
Exercise: View pod logs
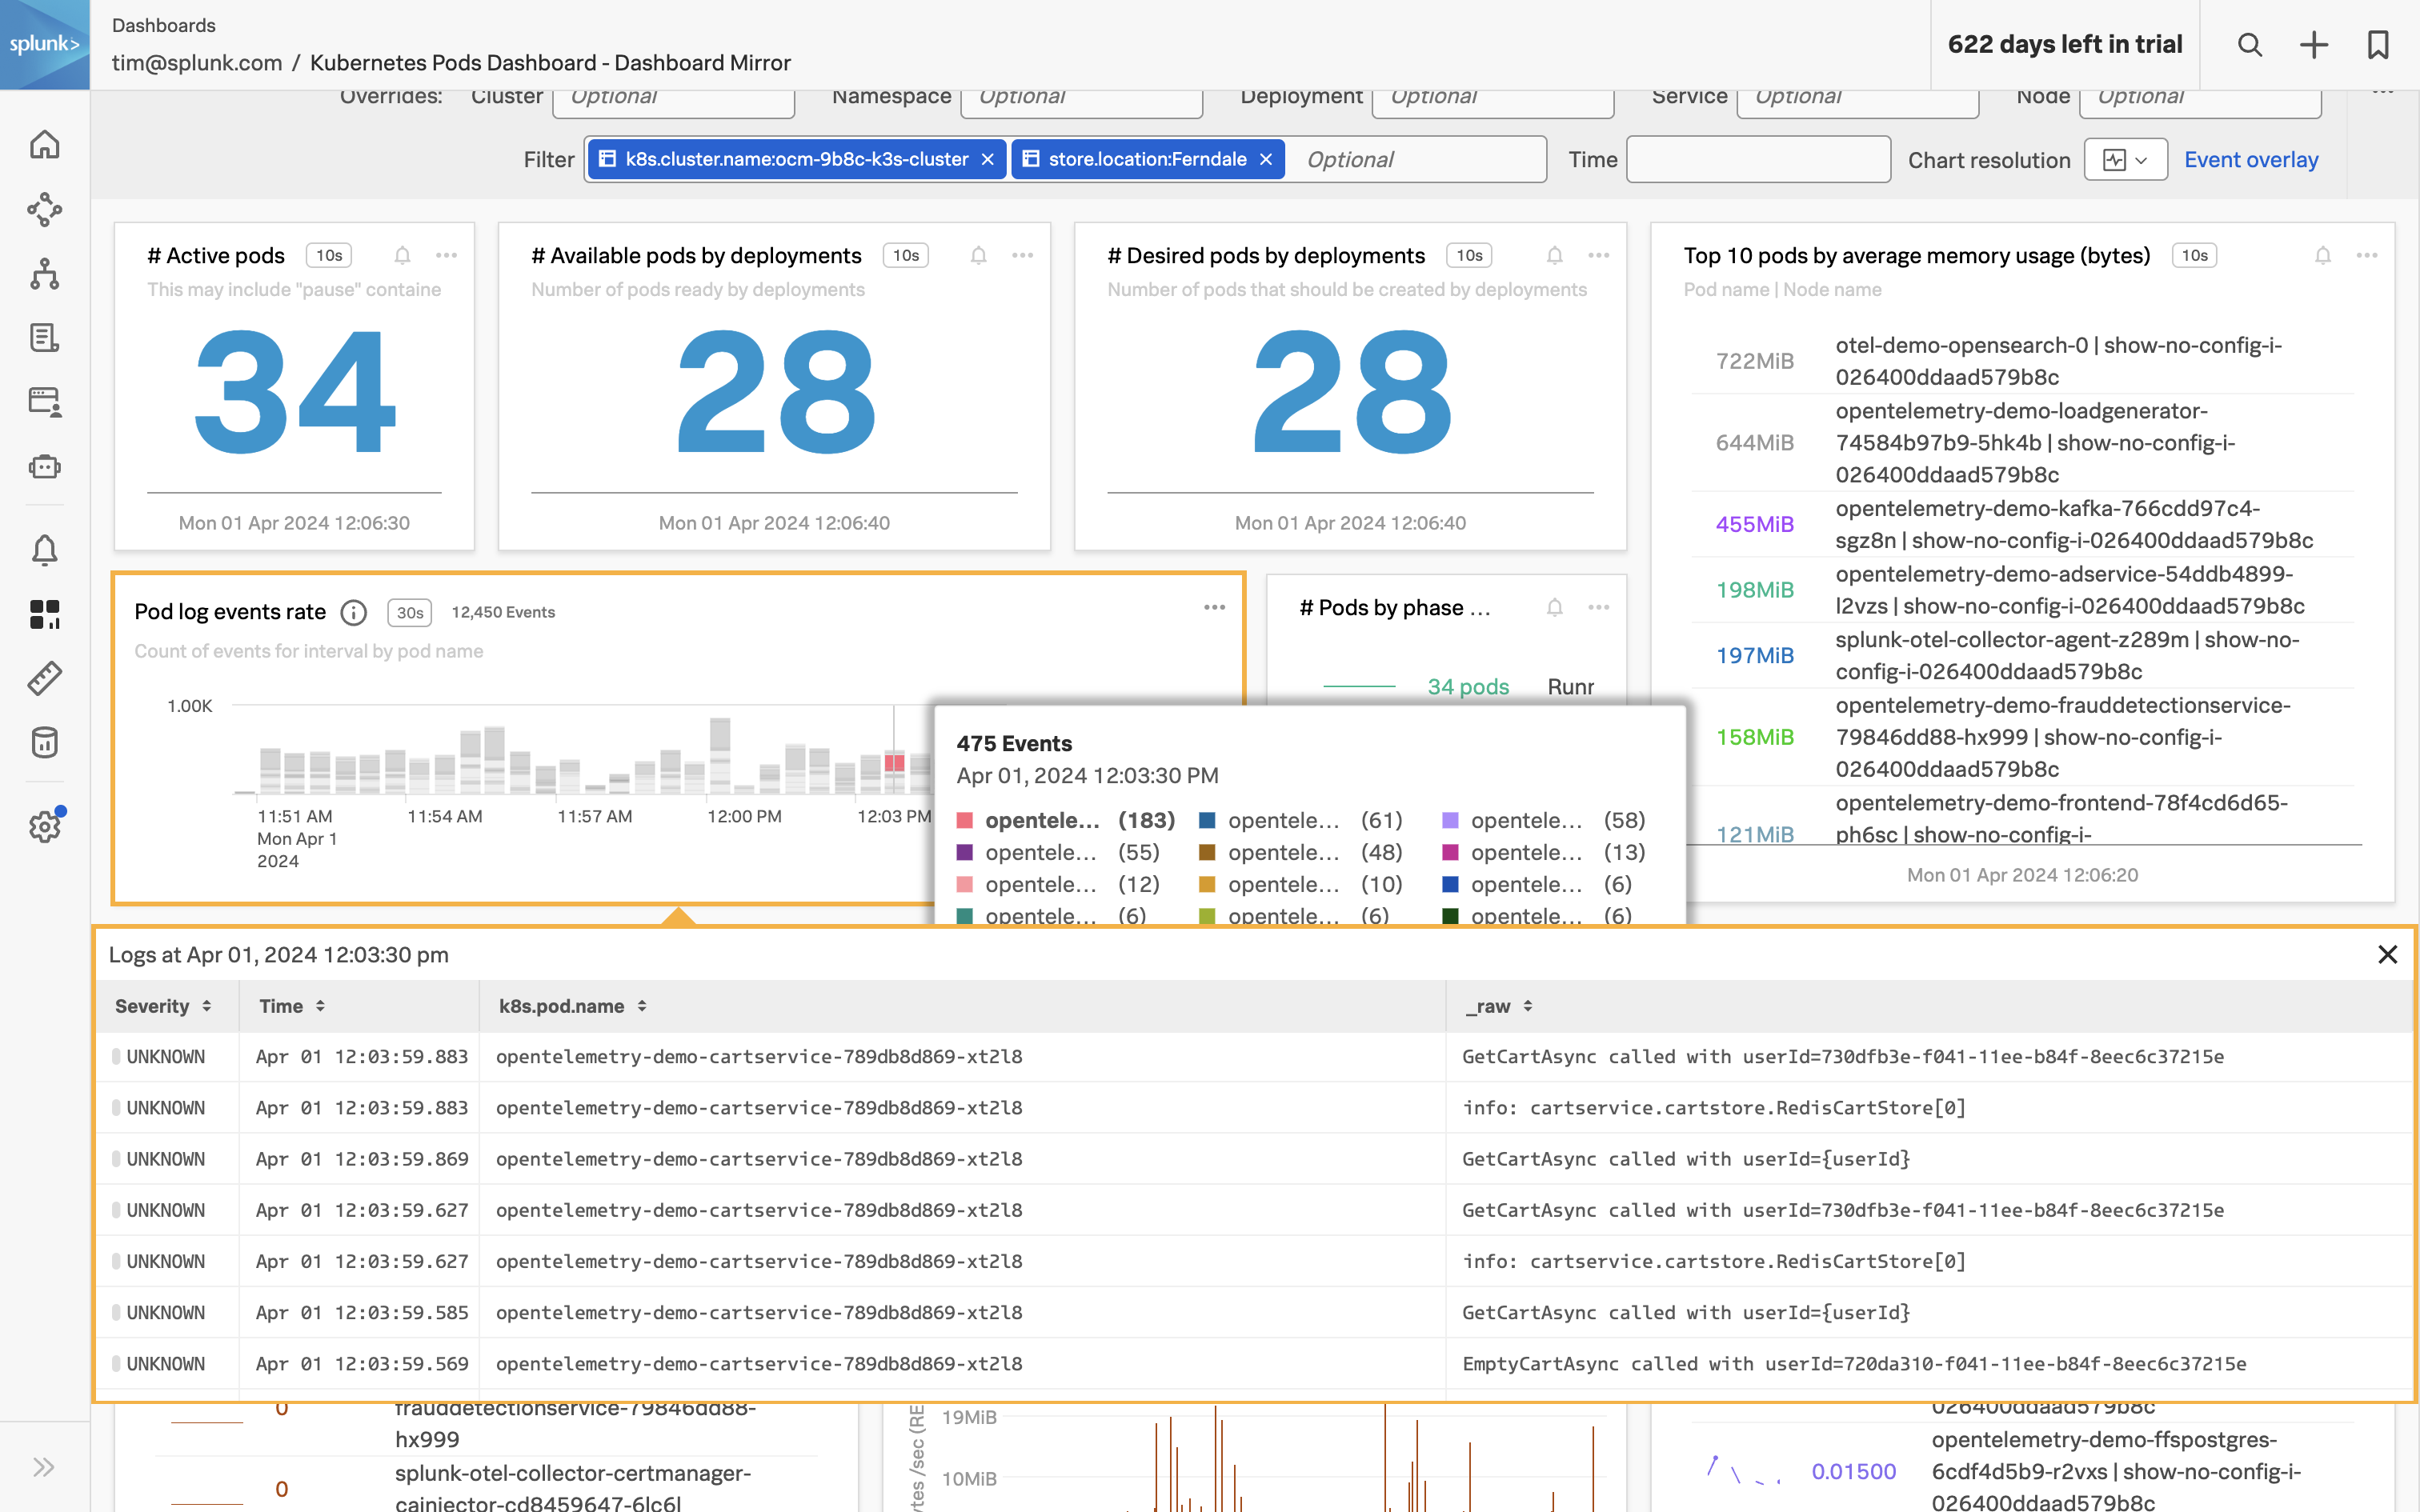
The Kubernetes Pods Dashboard you created in the previous section already includes a chart that contains all of the pod logs for your Kubernetes Cluster. The log entries are split by container in this stacked bar chart. To view specific log entries perform the following steps:
On the Kubernetes Pods Dashboard click on one of the bar charts. A modal will open with the most recent log entries for the container you’ve selected.
Click one of the log entries.
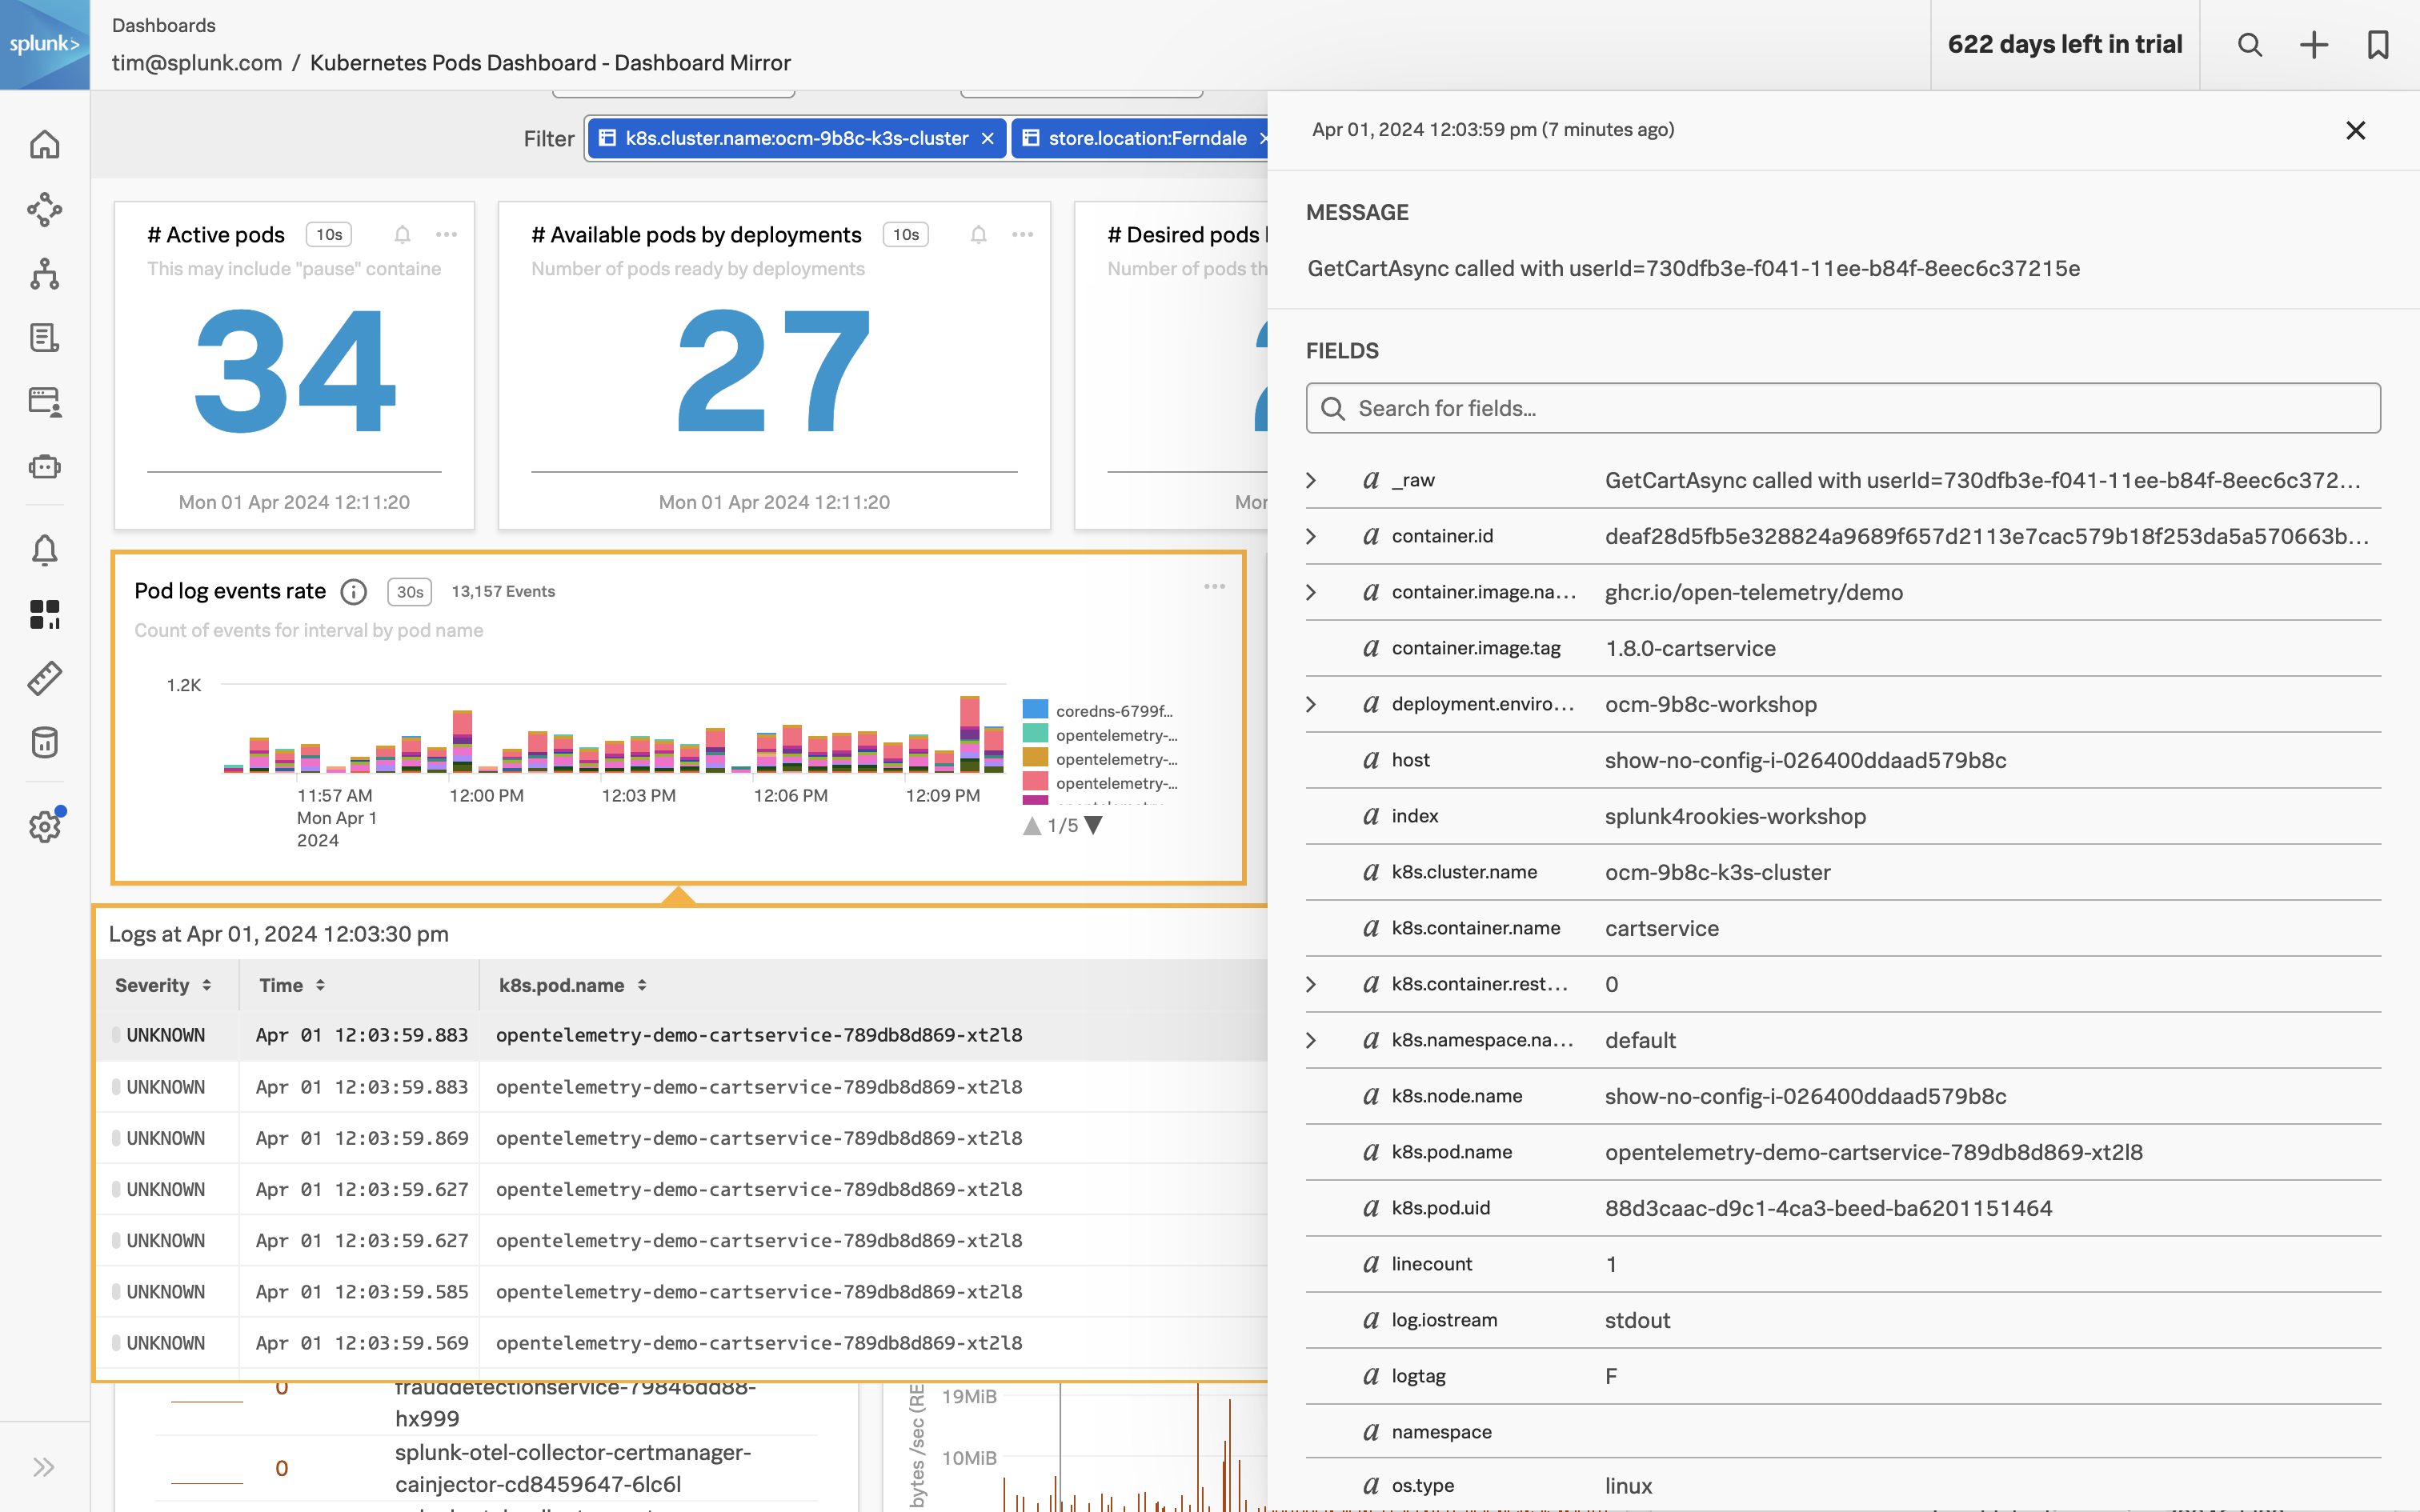
Here we can see the entire log event with all of the fields and values. You can search for specific field names or values within the event itself using the Search for fields bar in the event.
Enter the city you configured during the application deployment
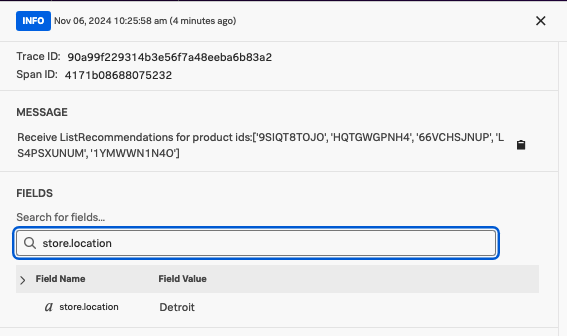
The event will now be filtered to the
store.locationfield. This feature is great for exploring large log entries for specific fields and values unique to your environment or to search for keywords likeErrororFailure.Close the event using the
Xin the upper right corner.Click the Chart actions (three horizontal dots) on the Pod log event rate chart
Click View in Log Observer
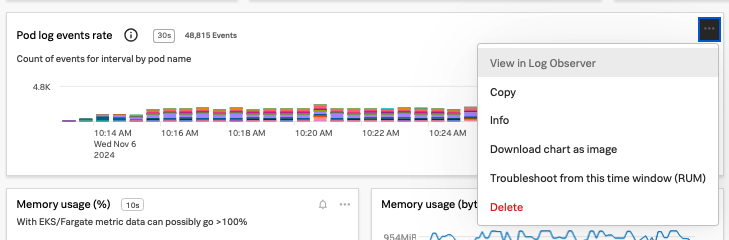
This will take us to Log Observer. In the next section, you’ll create a chart based on log events and add it to the K8s Pod Dashboard you cloned in section 3.2 Dashboard Cloning. You’ll also see how this new chart is automatically added to the mirrored dashboard you created in section 3.3 Dashboard Mirroring.