Create Log-based Chart
5 minutes Author Tim HardIn Log Observer, you can perform codeless queries on logs to detect the source of problems in your systems. You can also extract fields from logs to set up log processing rules and transform your data as it arrives or send data to Infinite Logging S3 buckets for future use. See What can I do with Log Observer? to learn more about Log Observer capabilities.
In this section, you’ll create a chart filtered to logs that include errors which will be added to the K8s Pod Dashboard you cloned in section 3.2 Dashboard Cloning.
Exercise: Create Log-based Chart
Because you drilled into Log Observer from the K8s Pod Dashboard in the previous section, the dashboard will already be filtered to your cluster and store location using the k8s.cluster.name and store.location fields and the bar chart is split by k8s.pod.name. To filter the dashboard to only logs that contain errors complete the following steps:
Log Observer can be filtered using Keywords or specific key-value pairs.
In Log Observer click Add Filter along the top.
Make sure you’ve selected Fields as the filter type and enter
severityin the Find a field… search bar.Select
severityfrom the fields list.You should now see a list of severities and the number of log entries for each.
Under Top values, hover over Error and click the
=button to apply the filter.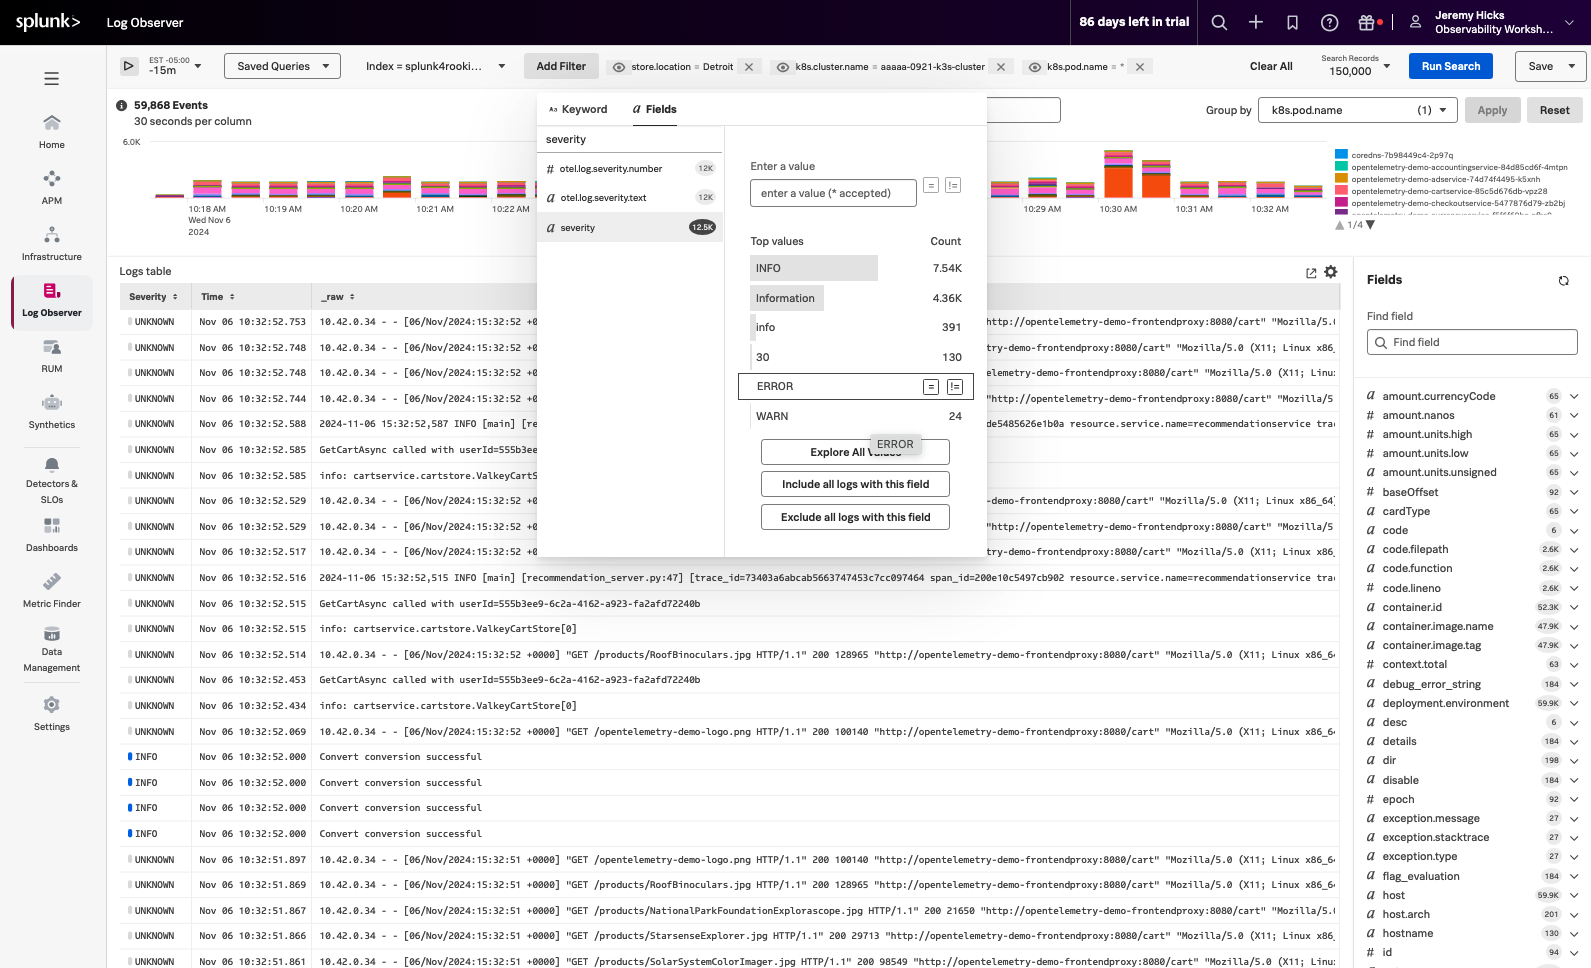
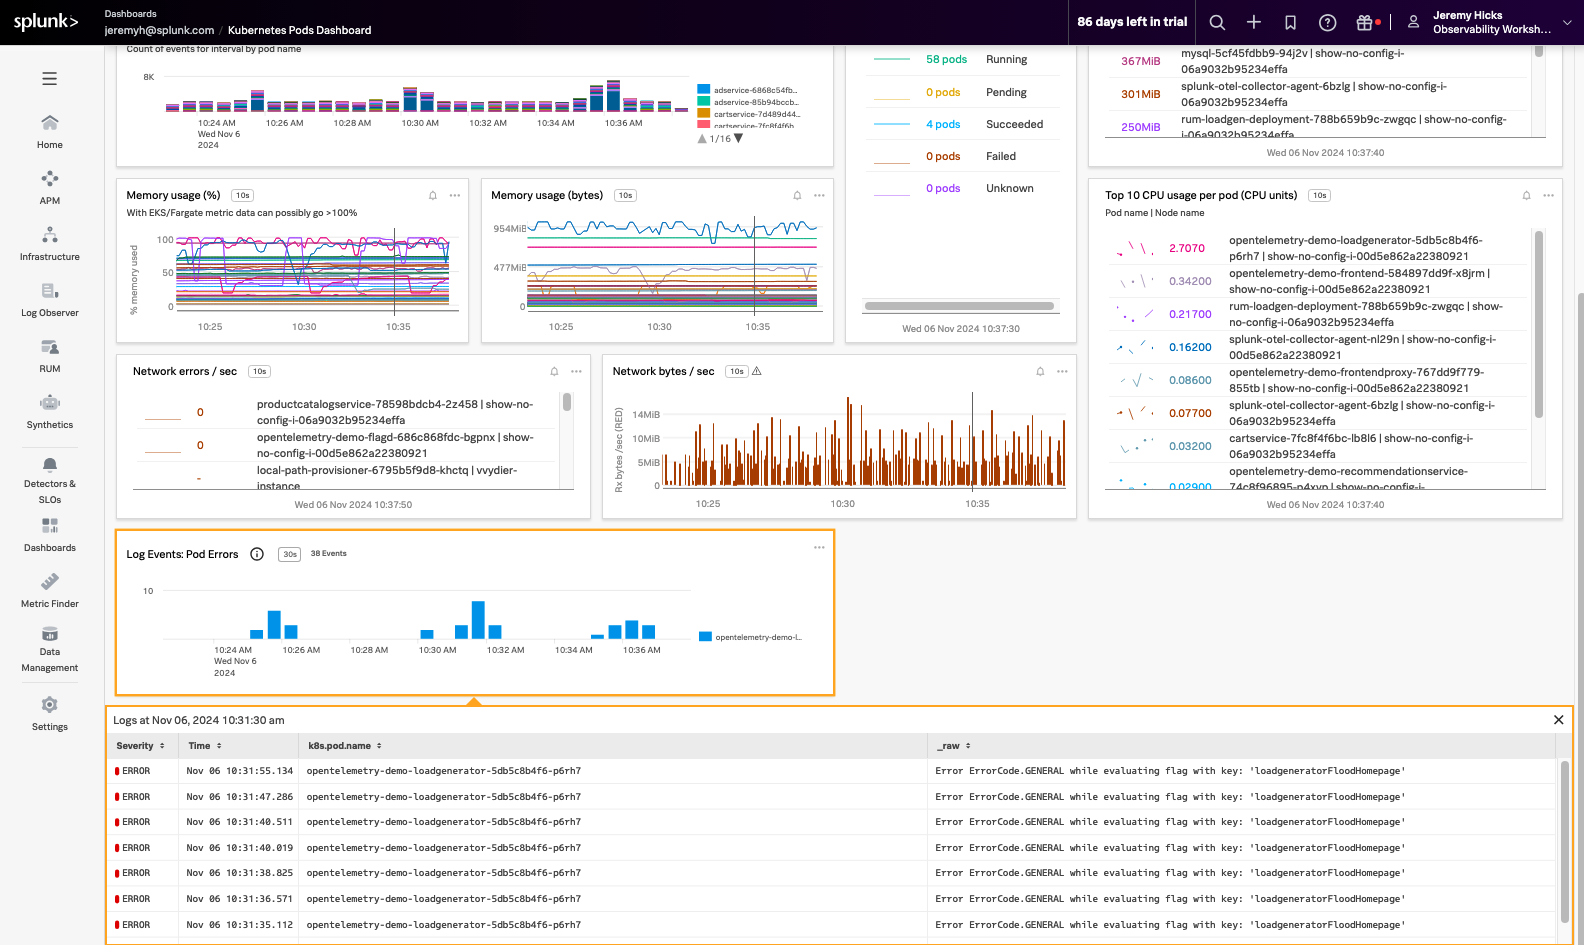
The dashboard will now be filtered to only log entries with a severity of Error and the bar chart will be split by the Kubernetes Pod that contains the errors. Next, you’ll save the chart on your Kubernetes Pods Dashboard.
In the upper right corner of the Log Observer dashboard click Save.
Select Save to Dashboard.
In the Chart name field enter a name for your chart.
(Optional) In the Chart description field enter a description for your chart.
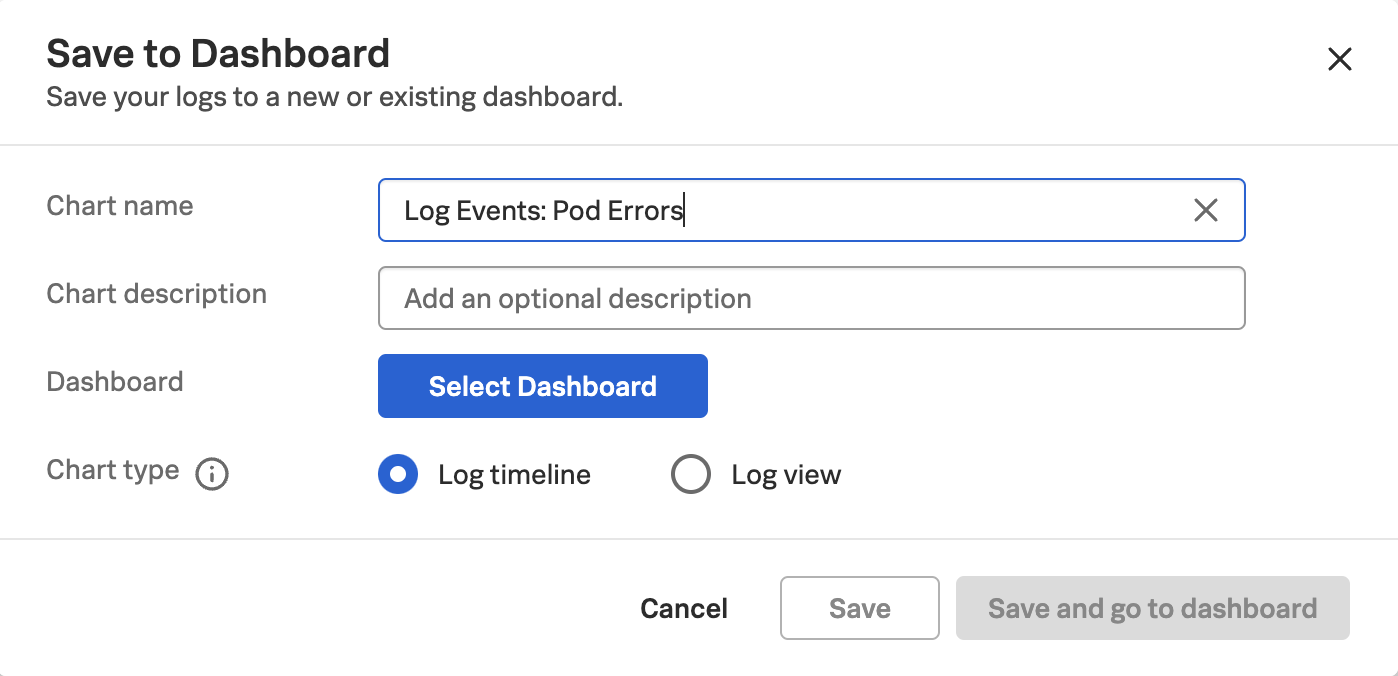
Click Select Dashboard and search for the name of the Dashboard you cloned in section 3.2 Dashboard Cloning.
Select the dashboard in the Dashboard Group for your email address.
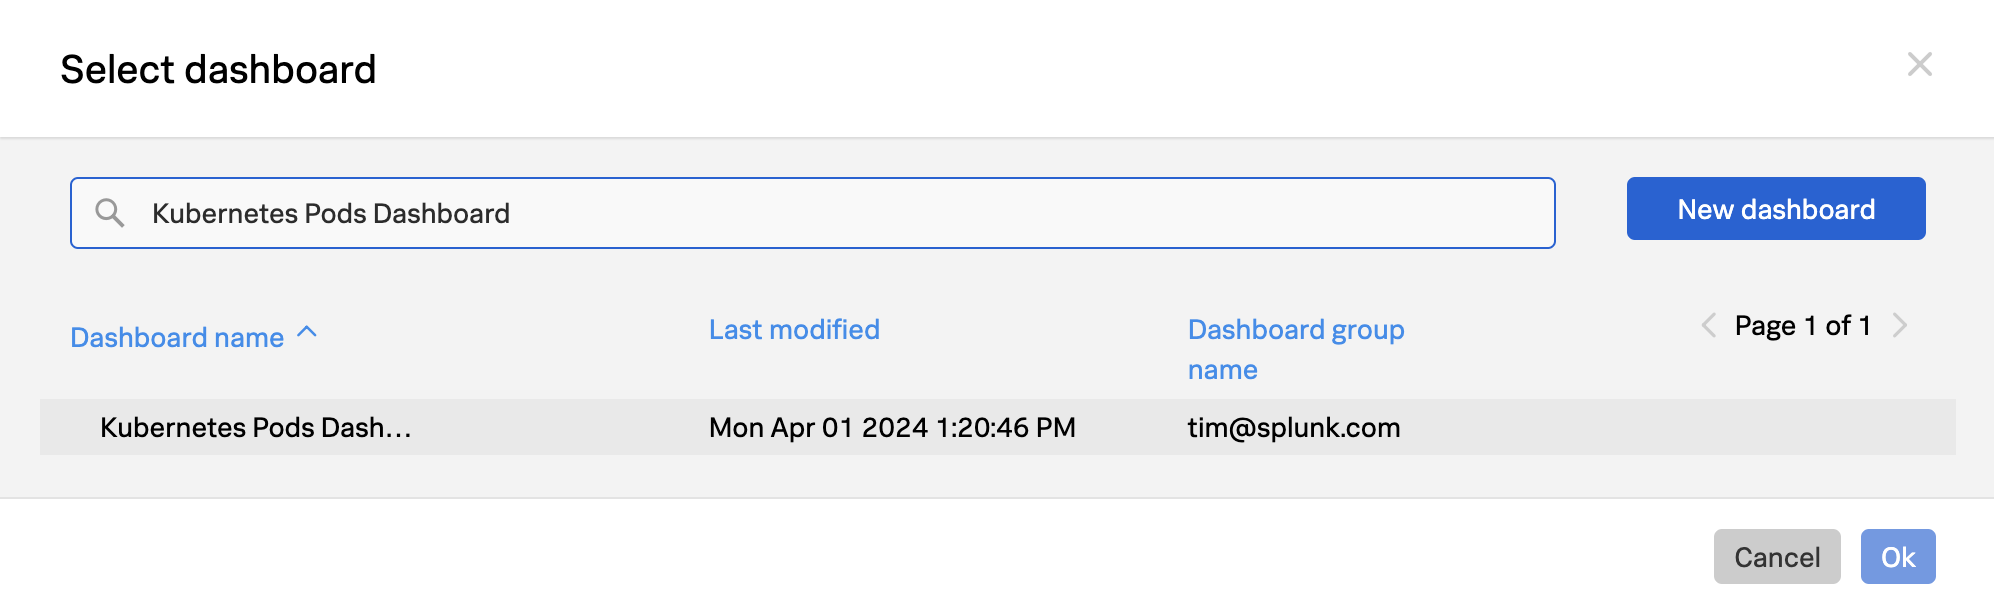
Click OK
For the Chart type select Log timeline
Click Save and go to the dashboard
You will now be taken to your Kubernetes Pods Dashboard where you should see the chart you just created for pod errors.
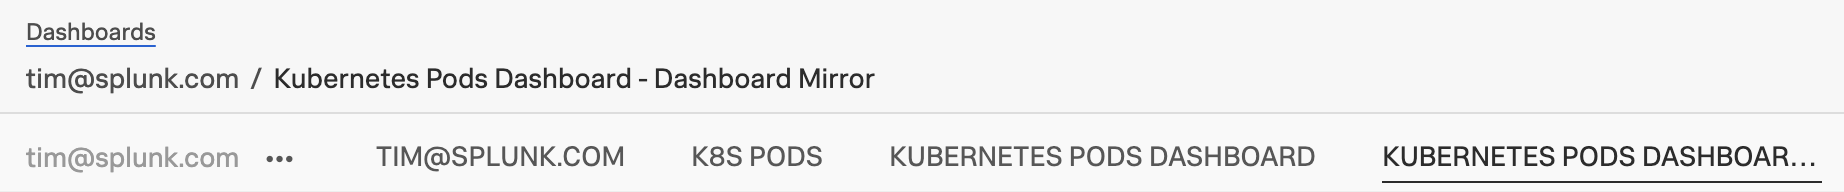
Because you updated the original Kubernetes Pods Dashboard, your mirrored dashboard will also include this chart as well! You can see this by clicking the mirrored version of your dashboard along the top of the Dashboard Group for your user.
Now that you’ve seen how data can be reused across teams by cloning the dashboard, creating dashboard mirrors and how metrics can easily be correlated with logs, let’s take a look at how to create alerts so your teams can be notified when there is an issue with their infrastructure, services, or applications.