Create Custom Detector
10 minutes Author Tim HardSplunk Observability Cloud provides detectors, events, alerts, and notifications to keep you informed when certain criteria are met. There are a number of pre-built AutoDetect Detectors that automatically surface when common problem patterns occur, such as when an EC2 instance’s CPU utilization is expected to reach its limit. Additionally, you can also create custom detectors if you want something more optimized or specific. For example, you want a message sent to a Slack channel or to an email address for the Ops team that manages this Kubernetes cluster when Memory Utilization on their pods has reached 85%.
Exercise: Create Custom Detector
In this section you’ll create a detector on Pod Memory Utilization which will trigger if utilization surpasses 85%
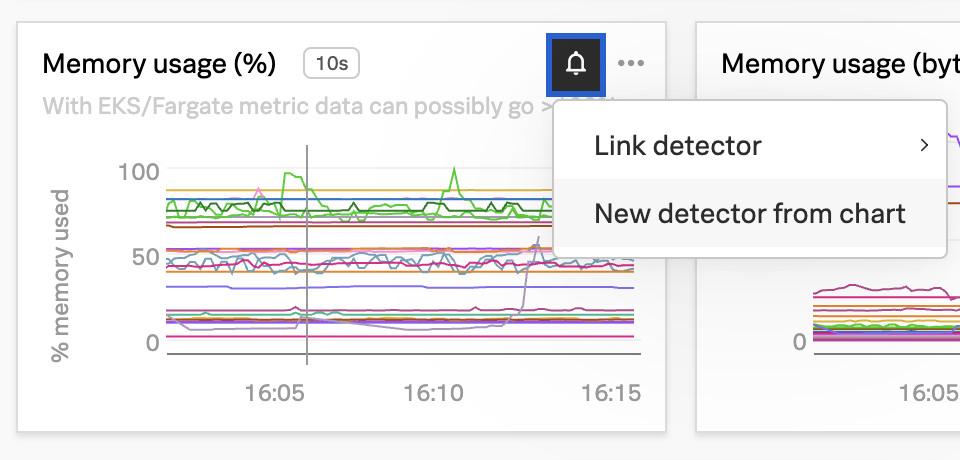
On the Kubernetes Pods Dashboard you cloned in section 3.2 Dashboard Cloning, click the Get Alerts button (bell icon) for the Memory usage (%) chart -> Click New detector from chart.
In the Create detector add your initials to the detector name.
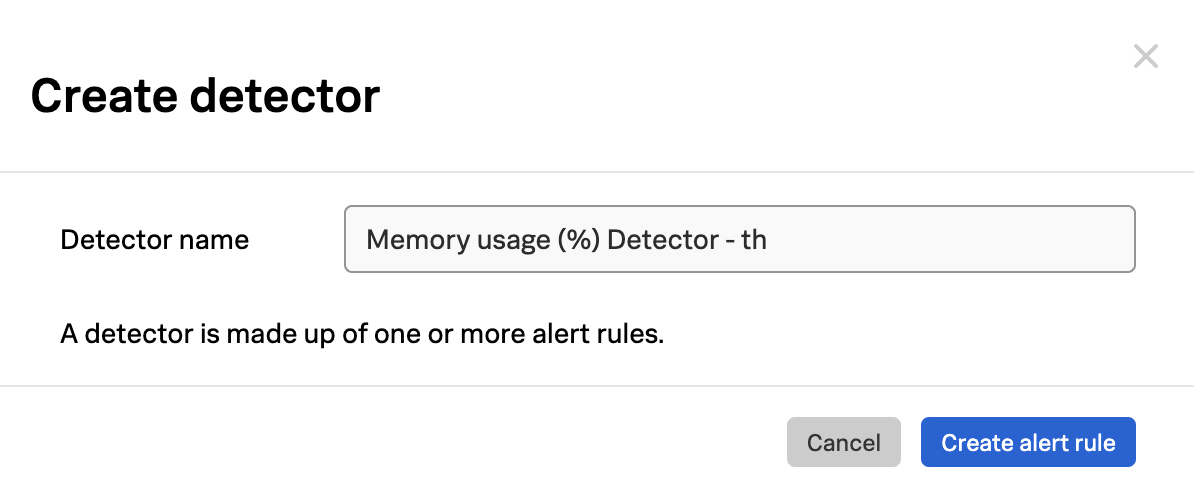
Click Create alert rule.
These conditions are expressed as one or more rules that trigger an alert when the conditions in the rules are met. Importantly, multiple rules can be included in the same detector configuration which minimizes the total number of alerts that need to be created and maintained. You can see which signal this detector will alert on by the bell icon in the Alert On column. In this case, this detector will alert on the Memory Utilization for the pods running in this Kubernetes cluster.
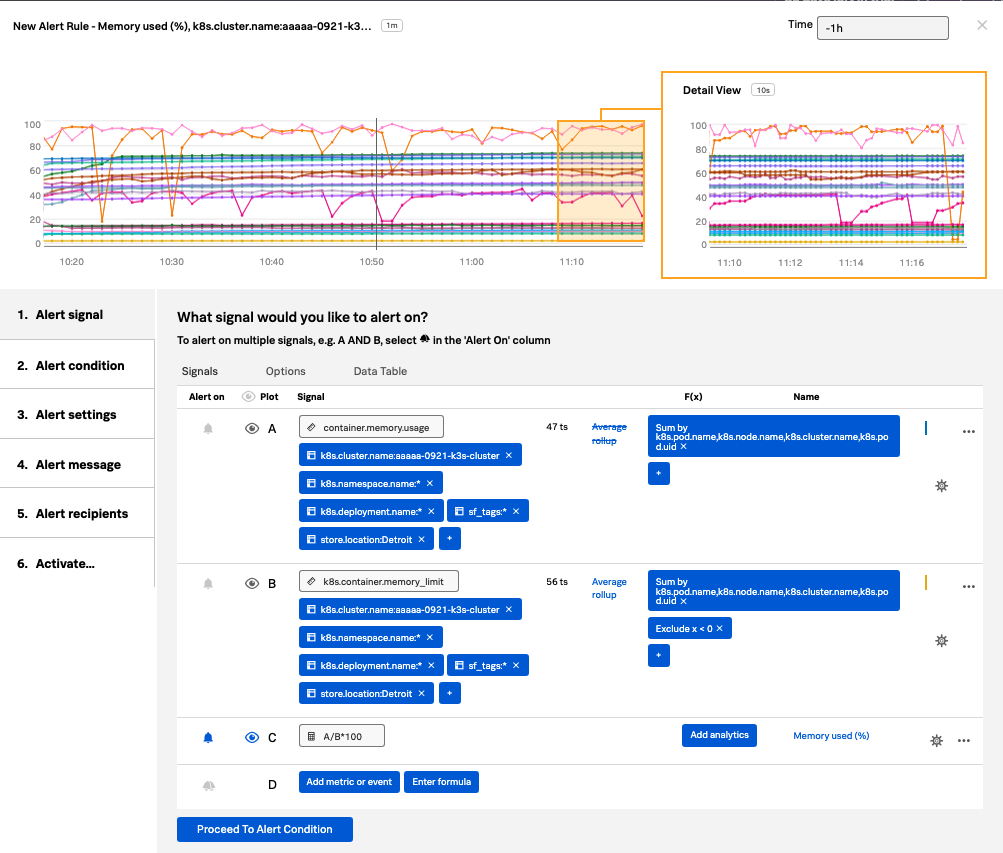
Click Proceed To Alert Conditions.
Many pre-built alert conditions can be applied to the metric you want to alert on. This could be as simple as a static threshold or something more complex, for example, is memory usage deviating from the historical baseline across any of your 50,000 containers?
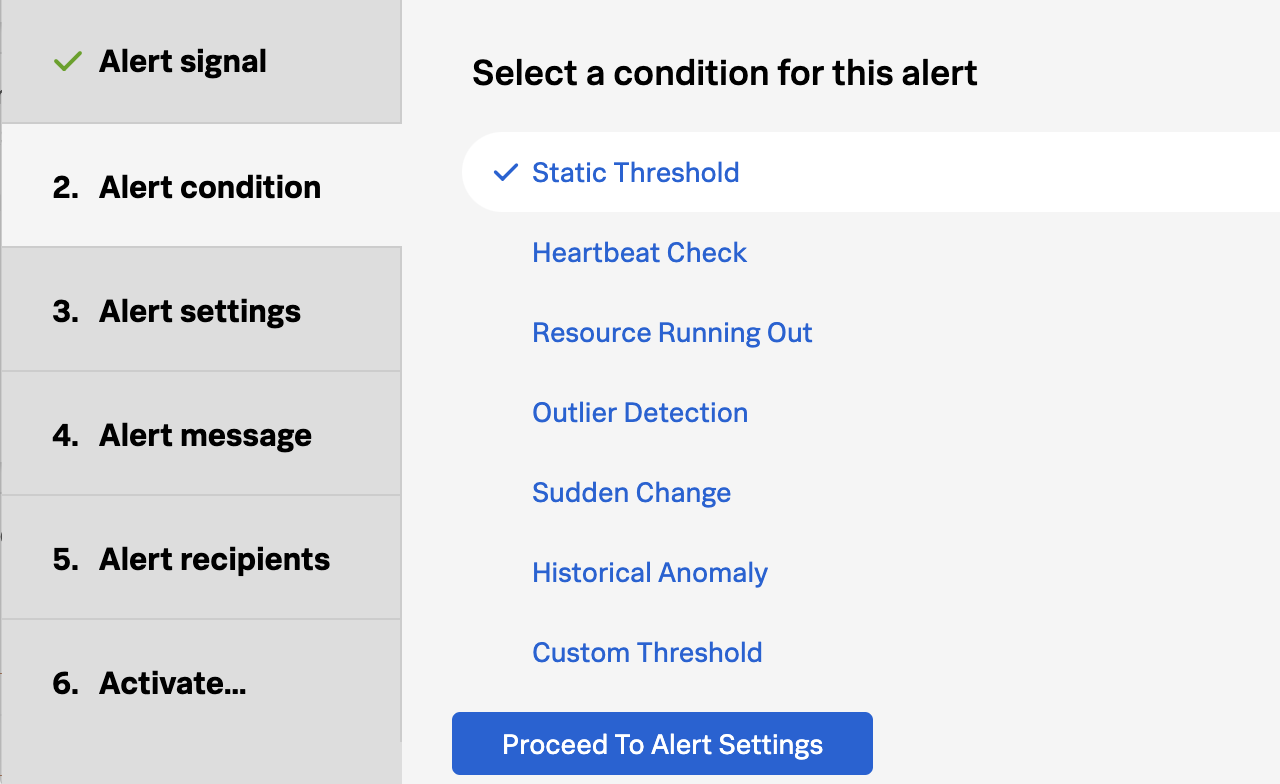
Select Static Threshold.
Click Proceed To Alert Settings.
In this case, you want the alert to trigger if any pods exceed 85% memory utilization. Once you’ve set the alert condition, the configuration is back-tested against the historical data so you can confirm that the alert configuration is accurate, meaning will the alert trigger on the criteria you’ve defined? This is also a great way to confirm if the alert generates too much noise.
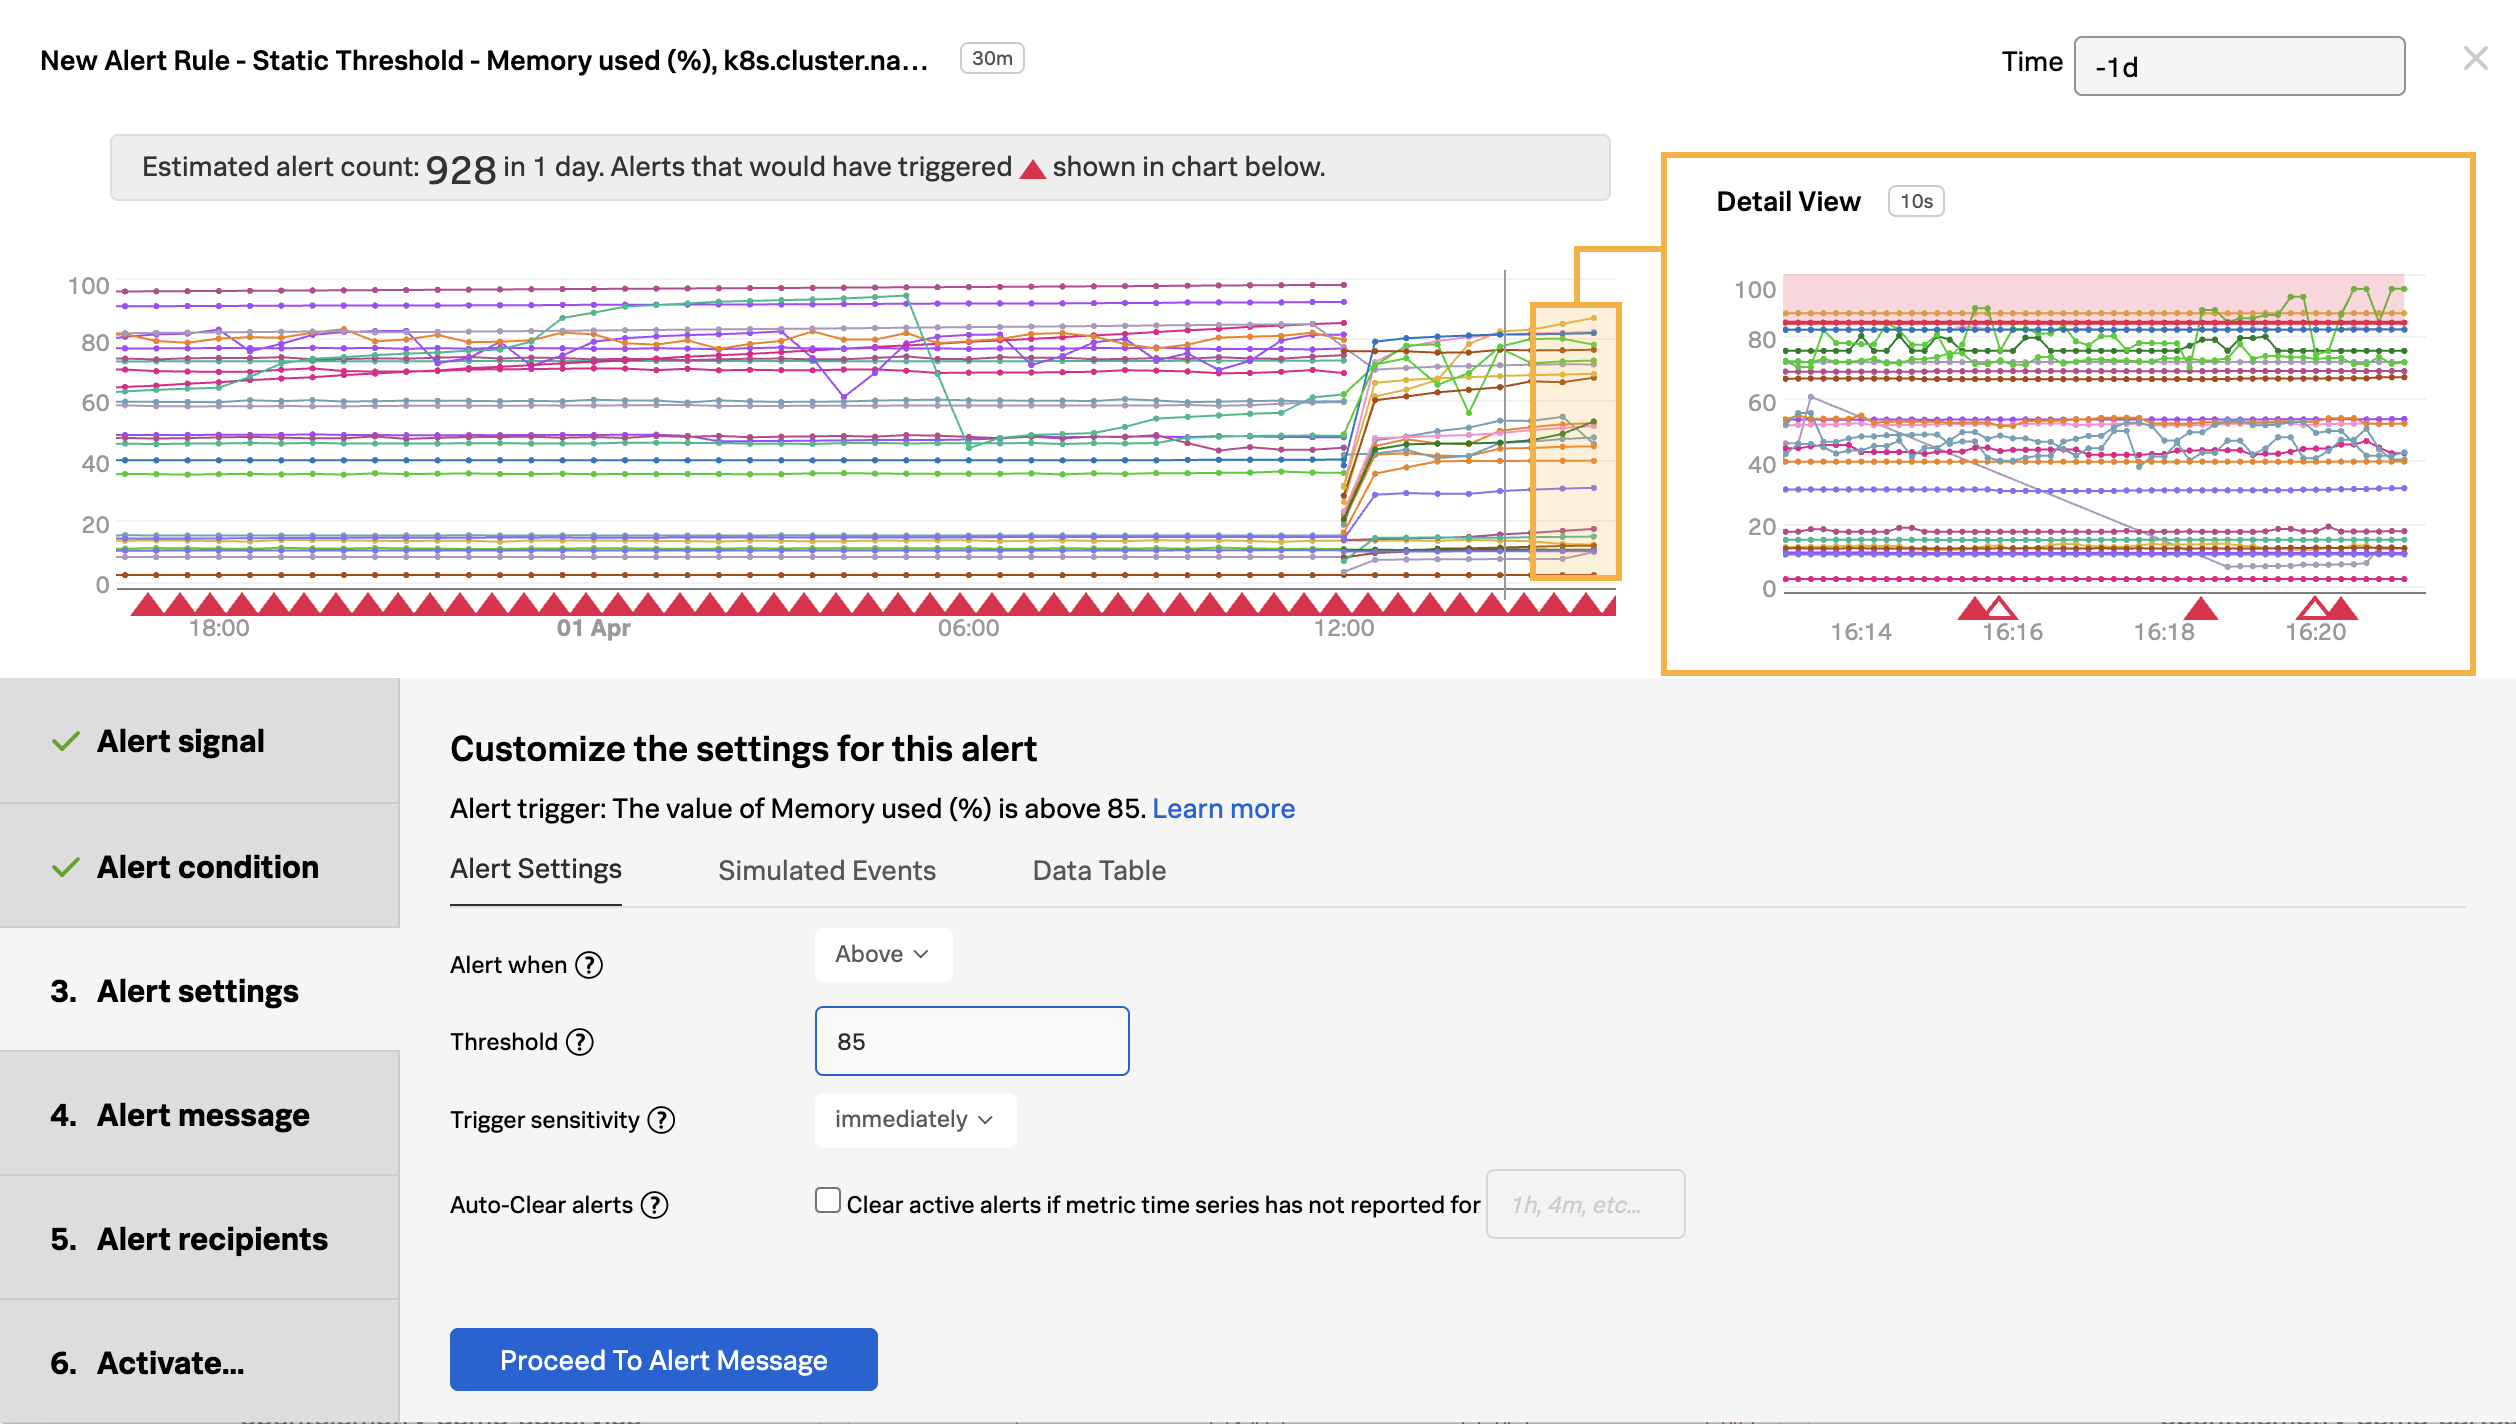
Enter 85 in the Threshold field.
Click Proceed To Alert Message.
Next, you can set the severity for this alert, you can include links to runbooks and short tips on how to respond, and you can customize the message that is included in the alert details. The message can include parameterized fields from the actual data, for example, in this case, you may want to include which Kubernetes node the pod is running on, or the
store.locationconfigured when you deployed the application, to provide additional context.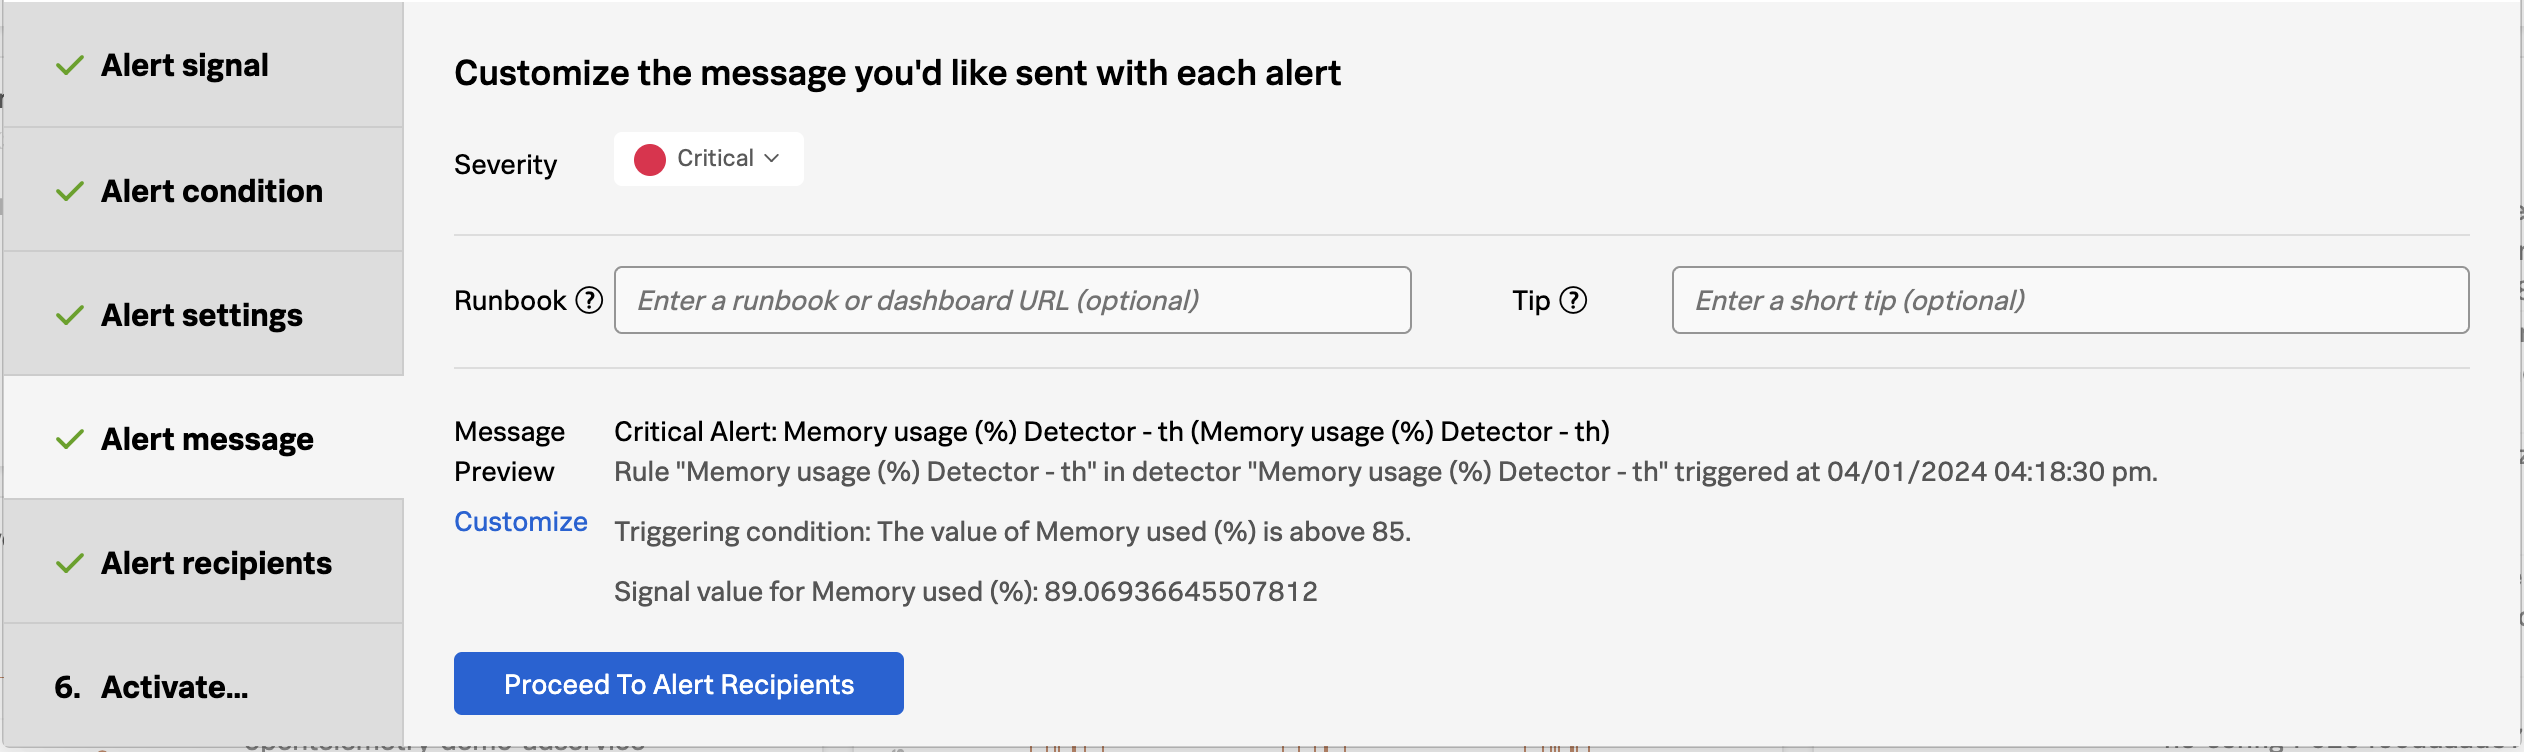
Click Proceed To Alert Recipients.
You can choose where you want this alert to be sent when it triggers. This could be to a team, specific email addresses, or to other systems such as ServiceNow, Slack, Splunk On-Call or Splunk ITSI. You can also have the alert execute a webhook which enables me to leverage automation or to integrate with many other systems such as homegrown ticketing tools. For the purpose of this workshop do not include a recipient
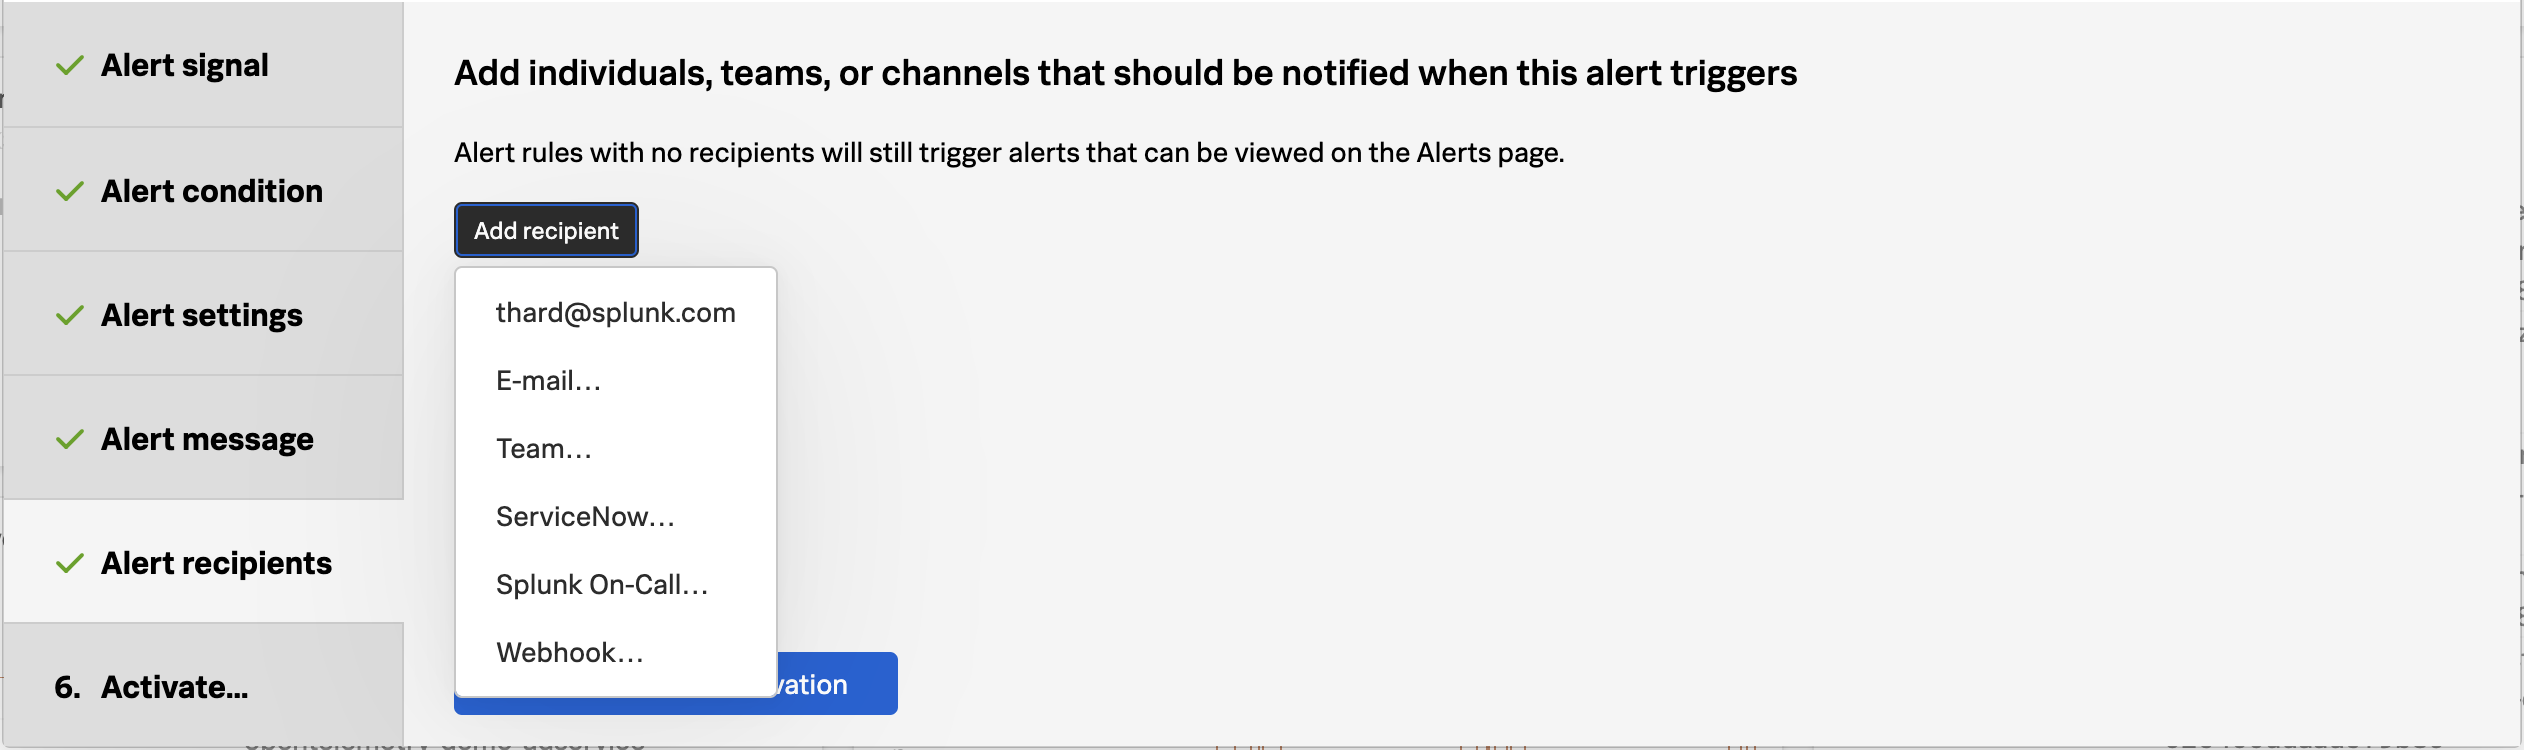
Click Proceed To Alert Activation.
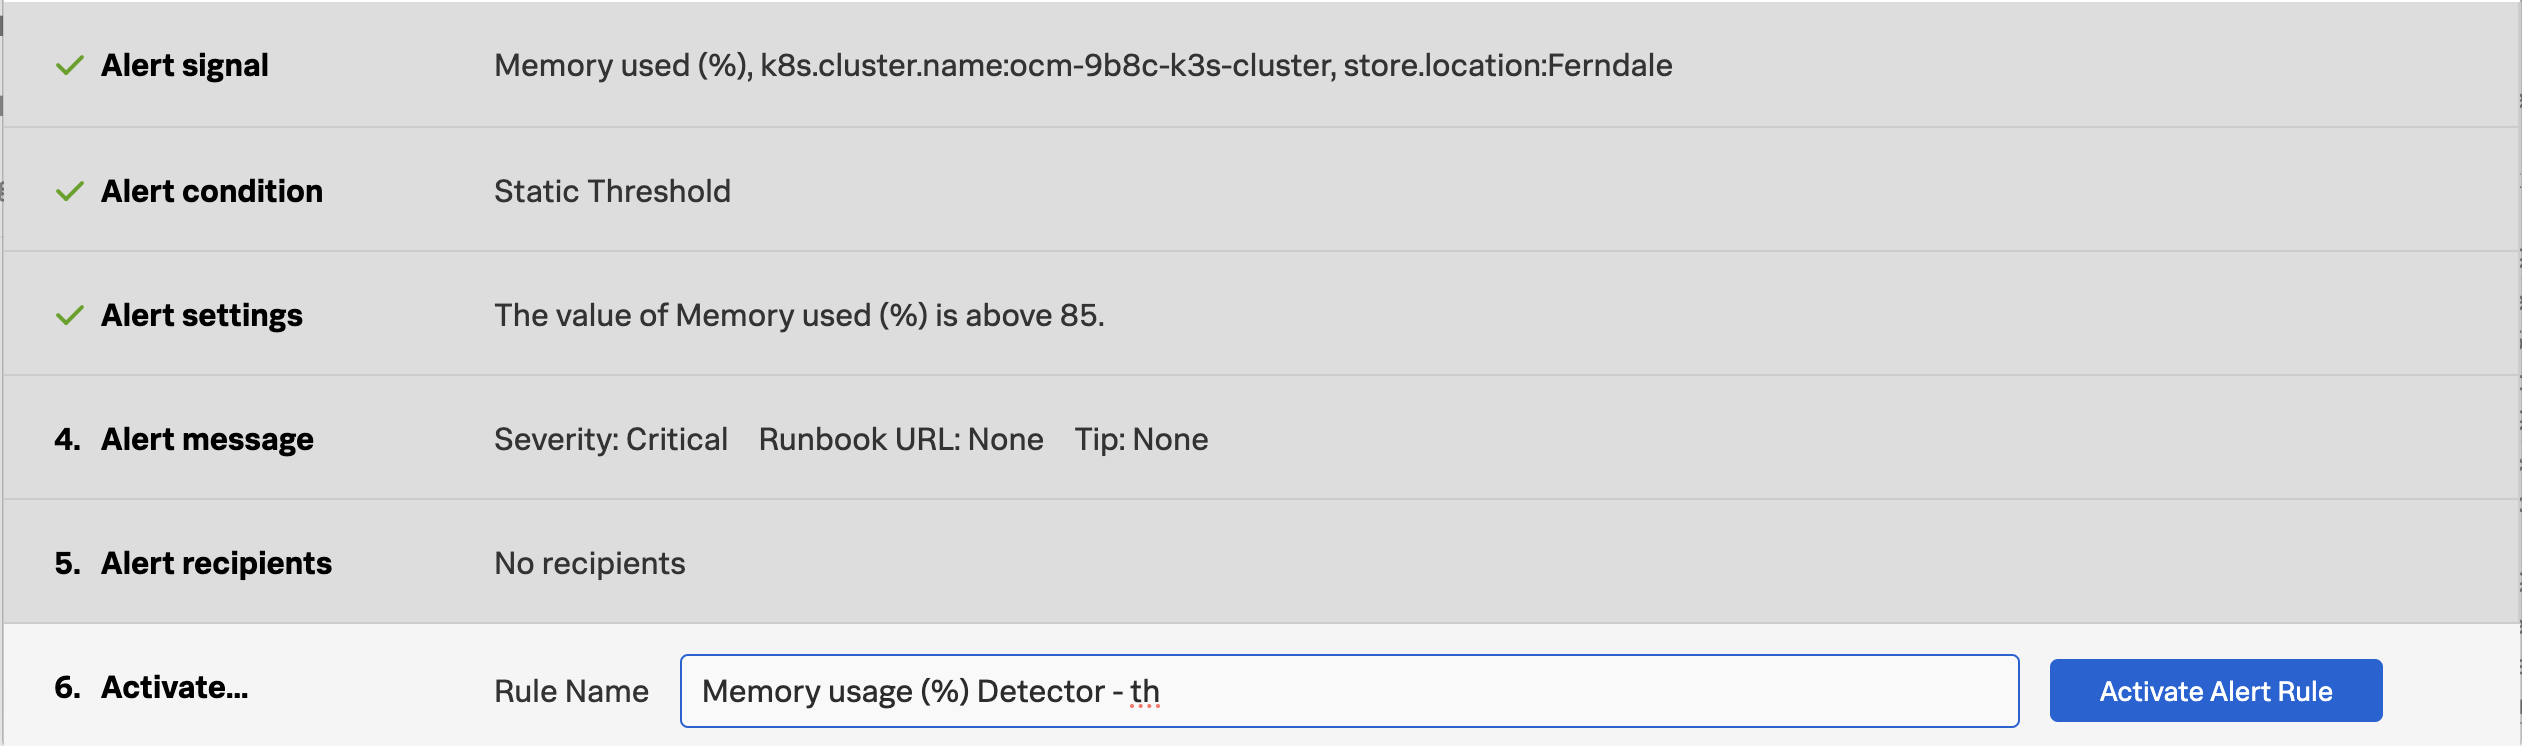
Click Activate Alert.
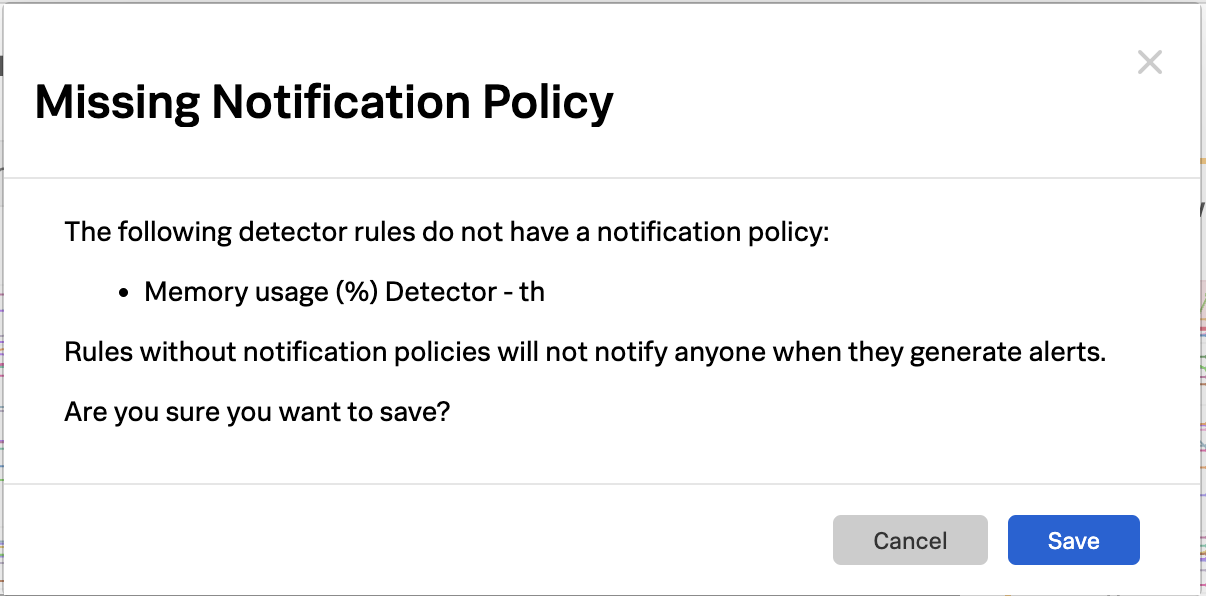
You will receive a warning because no recipients were included in the Notification Policy for this detector. This can be warning can be dismissed.
Click Save.
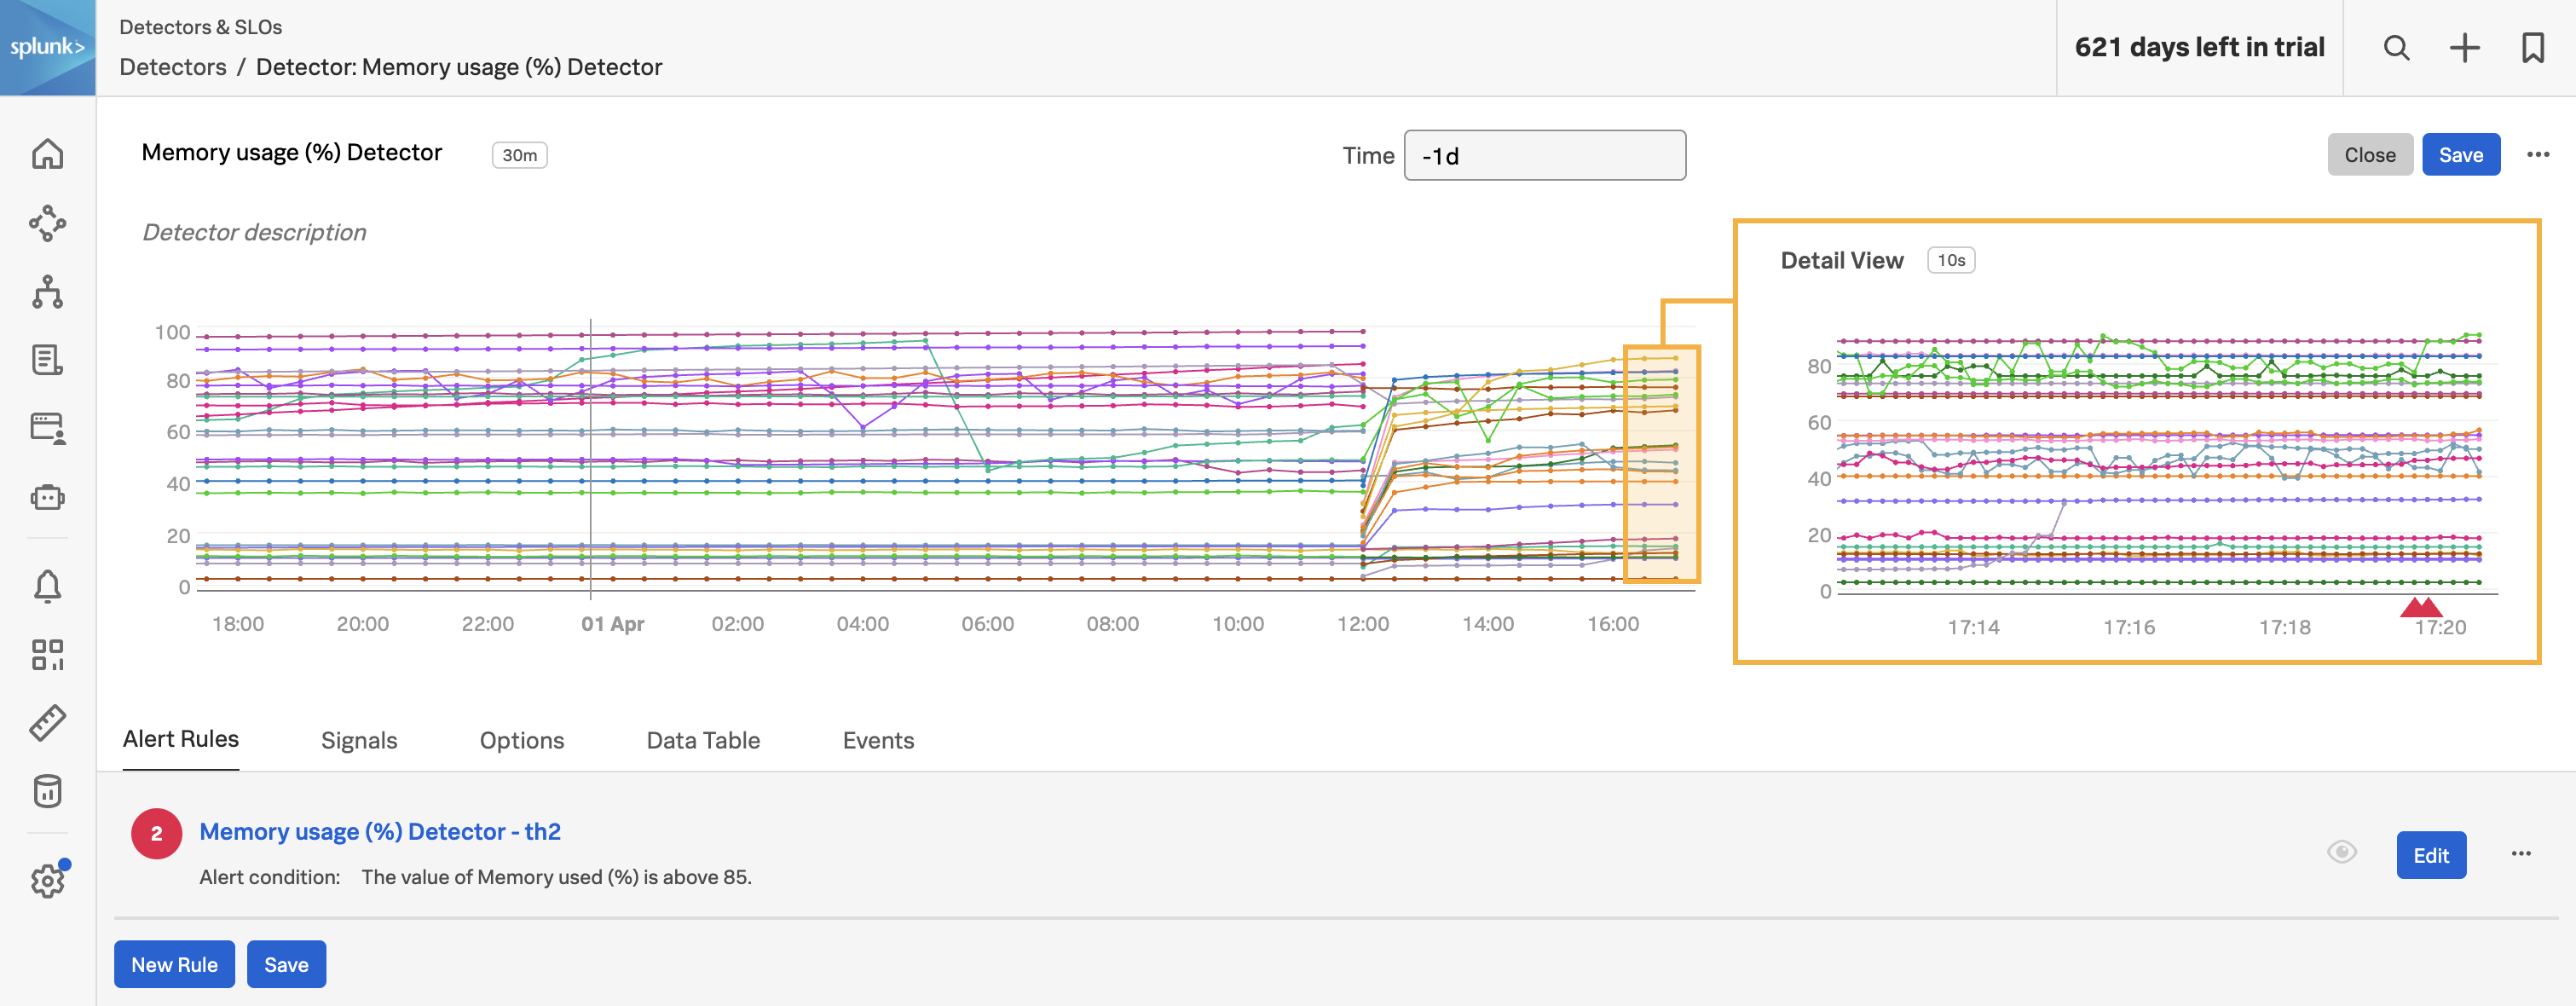
You will be taken to your newly created detector where you can see any triggered alerts.
In the upper right corner, Click Close to close the Detector.
The detector status and any triggered alerts will automatically be included in the chart because this detector was configured for this chart.
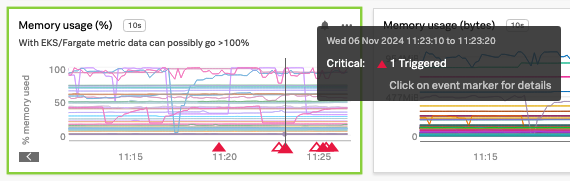
Congratulations! You’ve successfully created a detector that will trigger if pod memory utilization exceeds 85%. After a few minutes, the detector should trigger some alerts. You can click the detector name in the chart to view the triggered alerts.